Should investors be worried about a return of inflation?

Should investors be worried about a return of inflation?

The global bull market since the end of the GFC has been characterised by what feels like a few extremes: super high liquidity, super low interest rates and super low inflation. Understandably, there is concern that if one of those three elements changes it could spell the end of the bull market. Is that concern justified? In short, yes. What should you do about it? Well, there’s no real short answer for that.

Why low inflation matters

There are a few things affected by inflation that in turn influence markets: bond yields, interest rates and PE ratios.

BOND YIELDS: Inflation is like kryptonite for bonds: when it looks like inflation is going up bond prices go down and bond yields, which is basically the interest those bonds pay the investor, go up, because bond yields move in the opposite direction to prices.

In turn, rising bond yields can affect the price of a whole universe of financial assets, because those assets are valued using a ‘discounted cash flow’ (DCF). That means you try to work out how much you’re willing to pay for an asset (like a company or some shares) by calculating what the future cash flows you’d earn from owning the asset are worth today.

To calculate the DCF you use a ‘discount rate’, and that is normally the 10-year bond yield. If that bond yield goes up, the DCF valuation will go down. That’s one of the reasons given for the rise in asset values over the past few years as bond yields kept declining, and that, of course, could slow right down or even go into reverse if those bond yields go up.

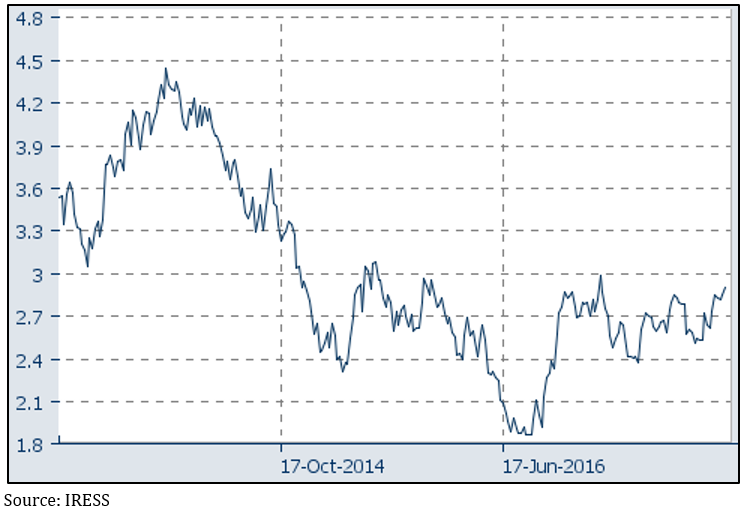
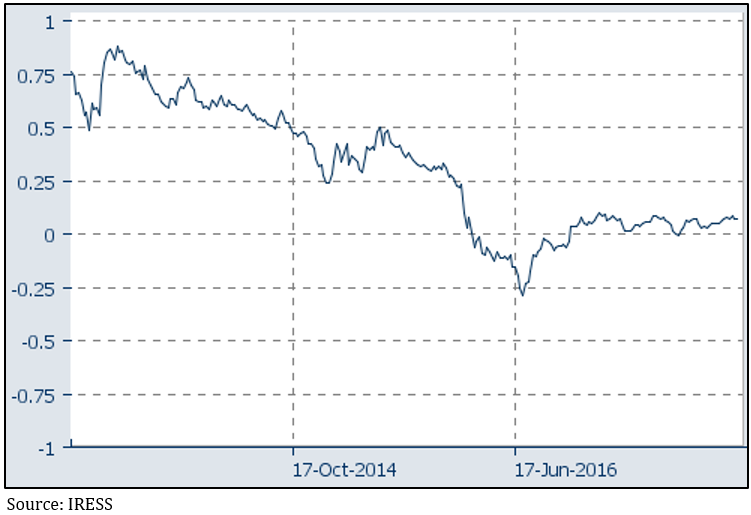
So what’s happened to bond yields lately? They’ve gone up, but they’re a long way from being what you’d call high and they reflect the different phases the various economies are in – see charts 1 to 3.


Chart 1: US 10-year bond yields are a long way off their lows, but an even longer way from their highs
Should investors be worried about a return of inflation_chart1
Chart 2: the Australian 10-year bond yield is also off its lows and shows how the US and Australian economies are very different phases right now
Chart 2: the Australian 10-year bond yield is also off its lows and shows how  the US and Australian economies are very different phases right now
Chart 3: While Japanese 10 year bonds have also risen, they are barely positive at 0.07%

INTEREST RATES:

central banks set cash rates partly based on what they think is happening with inflation. Some may remember the cripplingly high interest rates of the early 1980s when the US Federal Reserve, under the governorship of Paul Volcker, set out to crush 10% inflation by hiking interest rates to record high levels of 20%!

Over the past few years central banks have been more worried about inflation being too low, which in turn helped justify keeping interest rates very low. Obviously, if inflation looks like it could get out of hand you’d expect the central banks to raise interest rates faster than what the market would otherwise have factored in.

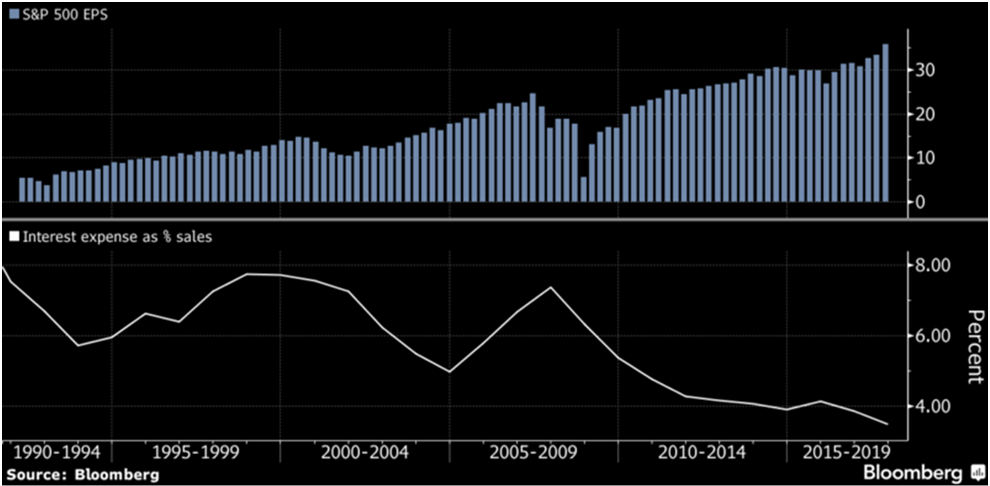
According to Bloomberg, rising US stock prices have been supported by super low interest rates that helped cut the cost of servicing debt for companies in the S&P 500 to an all-time low of 3.5% of sales over the past 12 months, compared with 7.4% in 2007. That amounts to US$320 billion in savings that boosted profitability and would be threatened by rising interest rates – see chart 4.


Chart 4: low interest rates have resulted in record low debt servicing costs, making US companies more profitable
Chart 4: low interest rates have resulted in record low debt servicing costs,  making US companies more profitable

The other risk is that rising interest rates will feed through to the housing market and slow borrowing and roll on to reducing consumer spending.

So what’s happened to interest rates lately? The only major economy that has seen official interest rates go up in the past few years is the US, where the Fed has raised rates five times from the record low 0.25% to the still very low 1.5%. All eyes are on the Fed to see how they’ll react to the recent strong economic news out of the US.

PRICE TO EARNINGS (PE) RATIO:

changes in the PE ratio can be the most important factor in determining where a stock market trades. A high PE ratio generally reflects a more buoyant market, that is, investors are willing to pay a higher price for a given level of earnings.

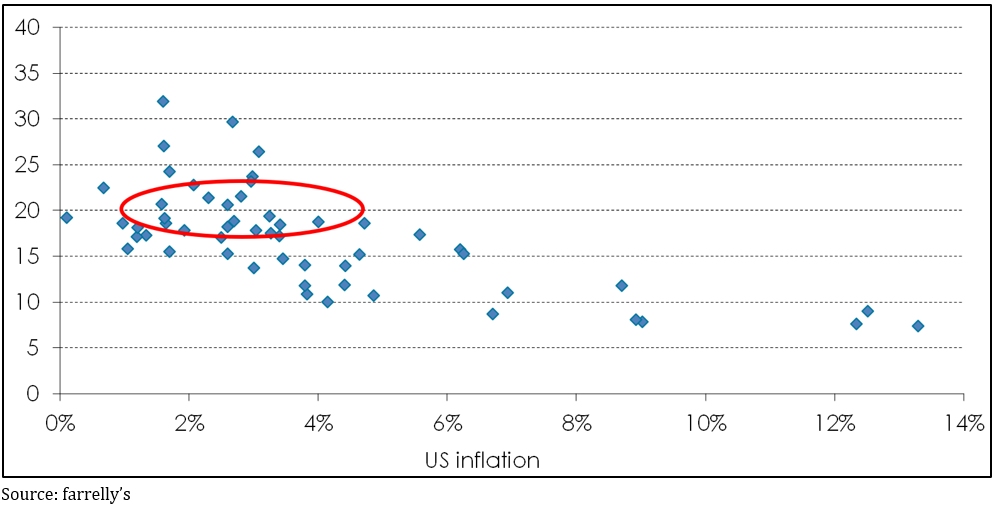
Historically, low inflation also tends to see higher PE ratios – see chart 5. Whether that’s because low inflation makes investors feel more buoyant is actually a pretty complex question, but over the past 10 years the US’s PE ratio has gone from about 11 to 18.


Chart 5: US PE ratios vs inflation

What should you do about rising inflation?

If rising inflation can have negative consequences for equities markets what should you do about it? Apart from being wary about your bond exposures, the timing of market reactions to changes in inflation is, like all questions of market timing, next to impossible to predict.

Likewise it can be difficult to know which way the markets will jump given particular inflation data; it’s frequent you’ll see markets react counter intuitively.

It comes back to basics: a well-diversified portfolio will often be the best protection against negative market surprises, including inflation.

This one chart says a lot about the world right now

This one chart says a lot about the world right now

Pricing risk correctly is fundamental to any business; get it wrong and things can go badly pear shaped. One measure of risk in financial markets is the ‘high yield credit spread’, and right now it looks crazy.

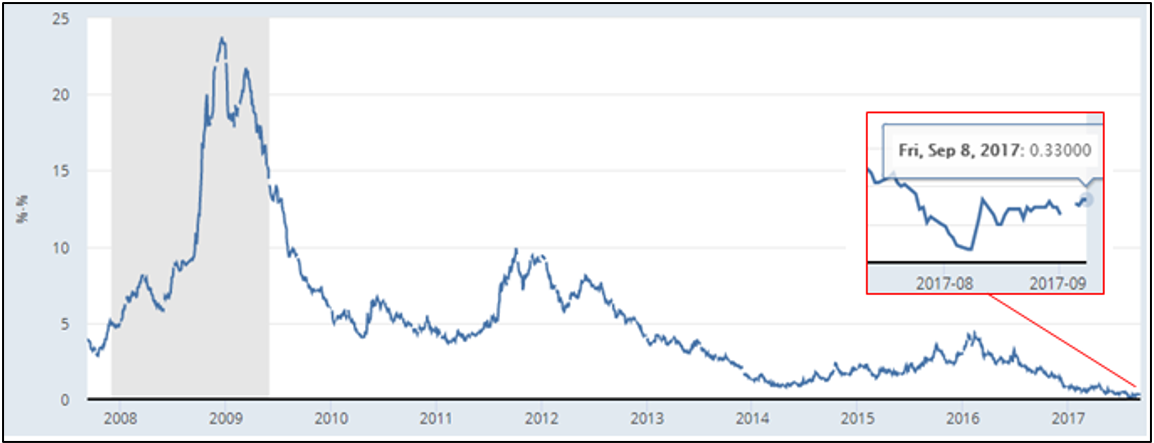
The ‘high yield credit spread’ is the difference in yield between junk bonds (also known as high yield bonds) and the US 10 year government bond. Chart 1 shows this spread closed last week at 0.33%, which is close to the lowest it’s ever been.


Chart 1: The high yield credit spread
Source: St Louis Federal Reserve

Why is this significant? A junk bond is one that the ratings agencies, like S&P and Moody’s, consider to have a higher risk of default, whereas a US 10 year bond is considered the height of security (even with an unpredictable president negotiating the debt ceiling). While the ratings agencies got a bad name during the GFC, that was on their ratings for financially engineered products that chopped up a whole lot of different bonds and put them into the same single product – they were a disaster. When it comes to individual companies, the agencies have a very good record, so it’s worth paying attention to them.

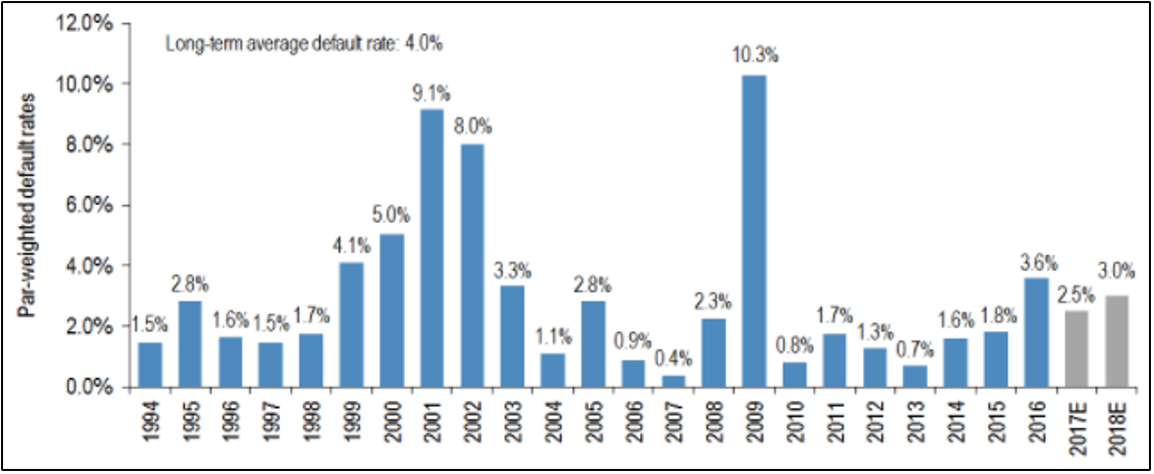
Over the long run, an average of 4% of junk bonds default each year. As usual, the average conceals the variability of the actual outcomes, which is shown in chart 2. While you can make forecasts about what the default rate will be over the next year or two, the risk always lies with those things that are simply unpredictable.


Chart 2: Default rates for high yield bonds
Source: JP Morgan

For 2017, forecast junk bond default rates range from 2.5% by JP Morgan, to S&P’s 3.9% and Moody’s 3%. While not big numbers it still means there is some risk, plus you’ve got the chance of an unforeseen event causing a blowout. At the moment, investors are being compensated a measly 0.33% for taking on that extra risk.

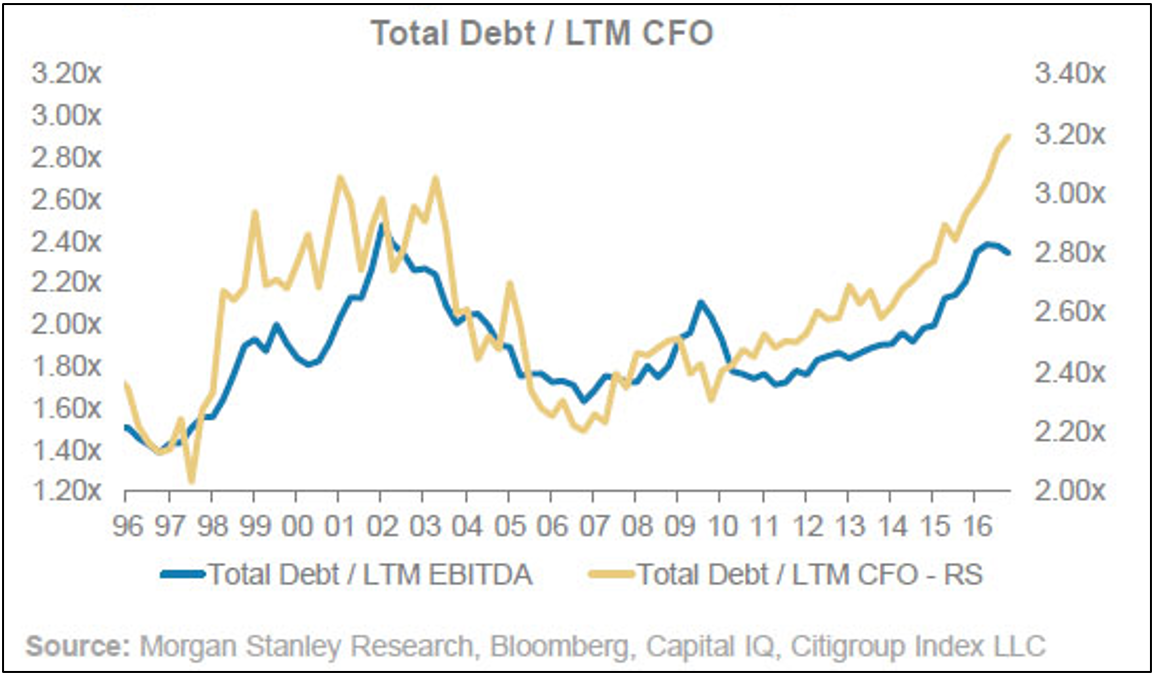
There are all kinds of justifications you can point to for such a low margin of error: interest rates are still at record lows which makes servicing debt much easier, global inflation is very low so there’s barely any upward pressure on interest rates, global growth is slowly picking up and central banks will support the market. All true, but companies have been increasing debt to record levels and chart 3 shows that leverage, as measured by companies’ ability to service their debts from operating cash flows, is back to cyclical highs.


Chart 3: Total debt compared to Last Twelve Monthsof cash flow from operations shows leverage is high
Chart 3: Total debt compared to Last Twelve Months  of cash flow from operations shows leverage is high

Things are currently very good for investors: financial market volatility is still close to all-time lows, debt defaults are low and economic growth is chugging along, so the ongoing reach for higher returns has paid off. The problem is, risk never dies, it just hibernates. 

China: big debts and scary yield curves

China: big debts and scary yield curves

Getting your head around what’s happening in China is really hard. Not only is it a complex economy, but it’s also a country that deals in very big numbers and has a government capable of pulling strings that almost no other country can. So trying to work out if the breathtaking rate of growth in China’s corporate debt as a proportion of GDP is something to worry about is complicated by arguments on both sides, but there’s also the fact that China has what’s called an ‘inverted yield curve’, which in most other countries would have alarm bells ringing as a precursor to recession.

The back story: how do you boost GDP growth? Easy, lots of credit

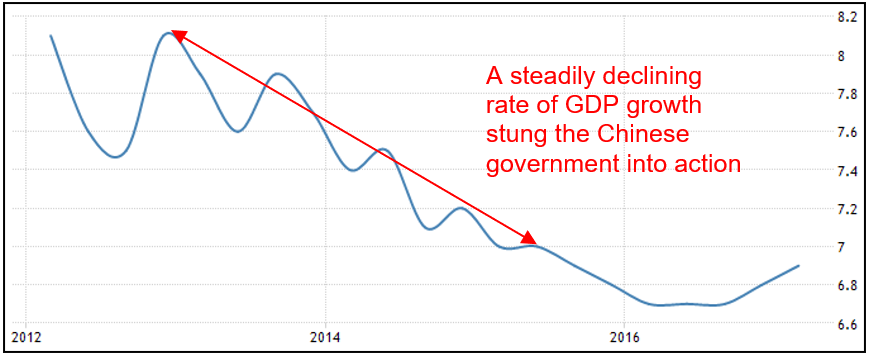
China’s GDP growth rate had slowed from a heady 8.1% in 2013 to a still extraordinary 7.0% midway through 2015 – see chart 1 below – and at the same time disinflation had taken hold with price growth at less than 1% per annum. Industrial production growth also fell from 19% per annum in 2009 to less than 6% by 2015. This was all a bit much for the government to bear: they have stated GDP targets that underpin their social ‘bargain’, where they keep growth high enough to maintain full employment and rising living standards and in return the people behave.


Chart 1: China’s GDP growth rate fell for three straight years
Source: tradingeconomics.com


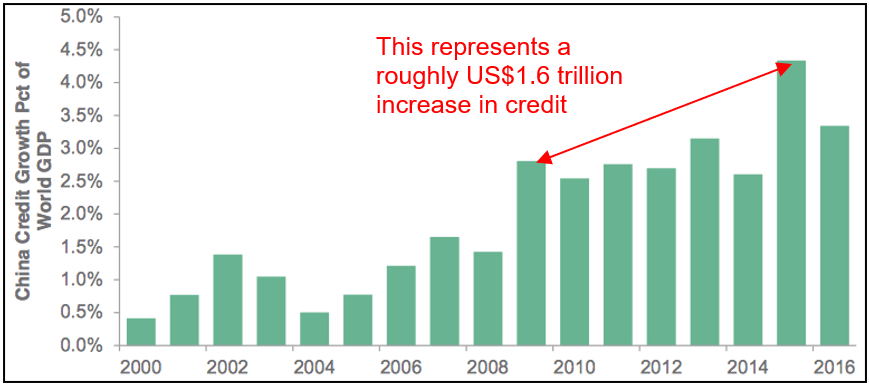
At the same time global growth was struggling to stay positive, so it wasn’t like China could rely on the pre-GFC formula of exporting its way to stronger growth. Instead, to boost growth the Chinese government pulled the same lever as they did in the wake of the GFC: a huge increase in domestic credit – a good old fashioned debt binge. Chart 2 illustrates just how dramatic that increase in credit was: China already had a history of high rates of credit growth, but 2015 and 2016 were a step change on that.


Chart 2: Chinese credit growth rose sharply in 2015 and 2016.
Source: Bloomberg


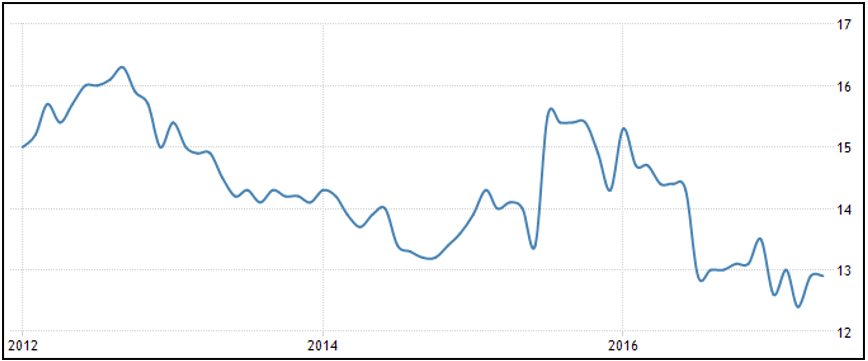
Bear in mind, chart 2 shows Chinese credit growth as a proportion of global GDP, which itself grew from US$60.1 trillion in 2009 to US$74.6 by 2015, so China’s credit had to increase from about US$1.6 trillion to US$3.3 trillion. Bloomberg estimates China’s total debt grew 465% in the 10 years to the end of 2016, and chart 3 shows credit growth peaked in 2015 at more than 15% per annum, which was more than double the rate of GDP growth.


Chart 3: Chinese credit growth peaked in 2015 at more than double the GDP growth rate
Chart 3: Chinese credit growth peaked in 2015  at more than double the GDP growth rate
Source: tradingeconomics.com


Where did all that credit go?

Some of the credit was sunk into residential property investment, where growth rates in prices went from -3% in 2015 to 12% by the end of 2016. But a huge portion was taken up by Chinese companies, many of them State Owned Enterprises (SOE’s). The Bank of International Settlements estimated corporate debt in China was equivalent to 168% of GDP, or US$18 trillion, at the end of 2016. To put that into some perspective, US business debt is currently about US$13.7 trillion or 73% of GDP, Australian business credit is 51% of GDP.

And what did those Chinese companies do with that debt? Certainly there was some investment in capex, but already the Chinese economy faces problems with overcapacity, especially in the heavy industries like coal, steel, cement and plate glass. In fact, the IMF estimates capacity utilization across those four sectors fell by an average of about 20% between 2008-15. Some of those businesses tried to grow their way out of trouble: invest in more plant and equipment to be able to lift production and hopefully revenue, but they became increasingly unprofitable and unable to service their debts.

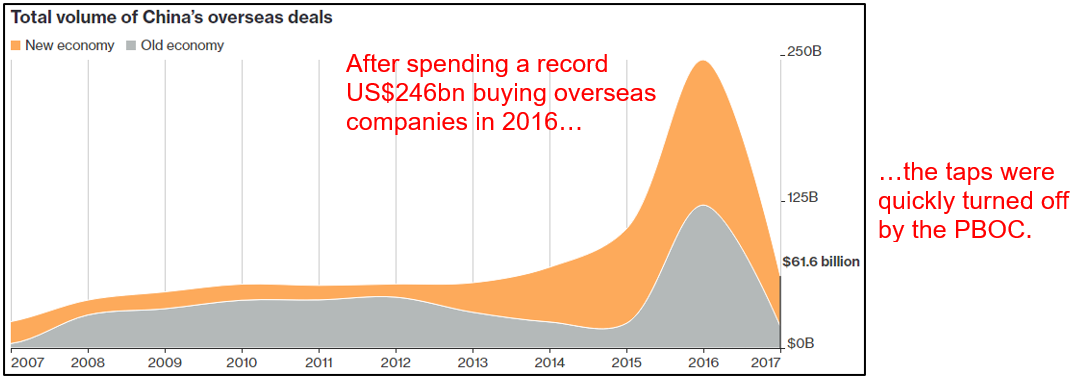
Other Chinese companies went on an overseas shopping spree, buying up a range of ‘new world’ businesses and brands ranging from the likes of software and tech companies to Volvo, Pirelli, the Inter Milan and AC Milan soccer teams, New York’s Waldorf Astoria and US film studios, as well as ‘old world’ businesses like resources and infrastructure (such as the Port of Darwin). In fact, corporate China announced a record US$246bn worth of overseas deals in 2016 – see chart 4 – more than double the previous record amount. At one point they were buying a German company on average every second week!


Chart 4: Chinese companies went on a credit-fueled overseas spending spree
Chart 4: Chinese companies went on a  credit-fueled overseas spending spree
Source: Bloomberg


But chart 4 also shows that even the Chinese central bank must have done a double take when they saw deals like a little known property developer buying the Chicago Stock Exchange and a loss-making iron ore producer buying a UK computer game developer. Indeed the government has made reining in corporate debt levels a priority, after the Governor of the People’s Bank of China said “non-financial corporate leverage [i.e. businesses outside the banking sector] is too high”.

Subsequently credit conditions have tightened up considerably, but that raises a new problem.


How do you unscramble the omelet?

It’s one thing to declare credit growth has to be brought under control, it’s another thing to do that without crashing the system: there are companies taking out new borrowings to finance the existing ones. This is where the Chinese government’s range of tools at their disposal is going to be critical. They can simply direct banks to stop lending to particular sectors or use their considerable financial reserves to prop companies up.

The catch is there is a certain portion of total loans outstanding that will realistically never be repaid, but the government can’t let a state owned company go bankrupt. In its annual report last year S&P estimated non-performing loans at about 6% (others have it at more than double that) of its sample of 200 companies, but tellingly 70% of companies in the sample were SOE’s and they accounted for 90% of the debt. In May Moody’s cut the Chinese credit rating for the first time since 1989.

One way the government is trying to deal with the non-performing loans is setting up ‘credit committees’, where the borrower and lender each appoint people to the committee and it tries to manage the debt. According to the Chinese Banking Regulatory Commission (CBRC) by the end of 2016 there were more than 12,800 such committees managing more than US$2.15 trillion worth of borrowings, which equated to 17% of total commercial bank loans. In one province alone the CBRC set up more than 1,300 committees covering 55% of corporate loans in the region.

Another method is to swap debt for equity, so the lender ends up holding a stake in the borrower. It’s estimated between RMB500 billion–1 trillion of such deals have been done, which have stopped about RMB3.5 trillion in loans from failing.

On the face of it that sounds like a good thing, save a company from failing and prevent job losses and the associated fall out. However, it creates risks of its own, with ‘zombie’ companies surviving only due to government protection rather than going out of business and enabling other, stronger companies to get a better market position and grow stronger. It’s what economists refer to as ‘creative destruction’.


Turning off the tap

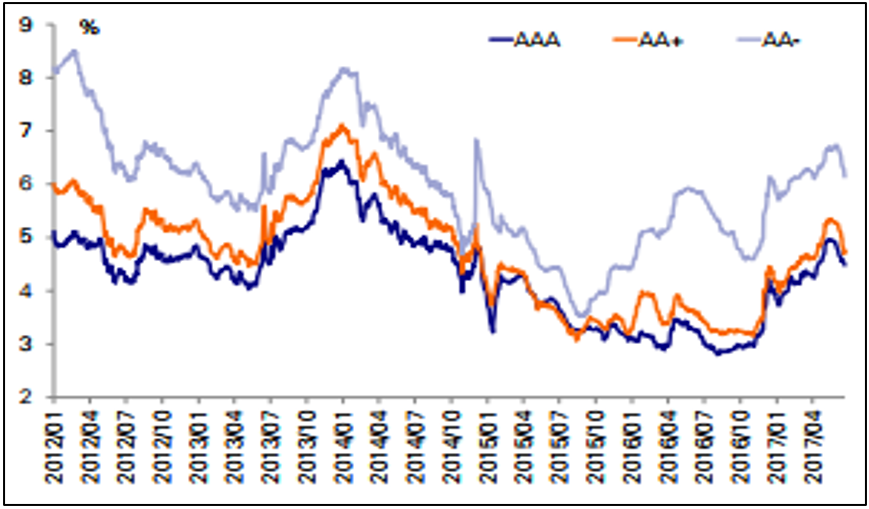
The final method used by the government to cap the growth of credit is through controlling the amount of liquidity by lifting interest rates or restricting who can borrow, which is a blunter instrument that can affect the entire market. An upshot of this has been a steep rise in Chinese corporate bond yields, as shown in chart 5. What that means is when companies want to raise money by selling bonds they have to pay higher and higher rates on them, which obviously makes life even more difficult for those that are struggling to service existing debt already.


Chart 5: Chinese corporate bond yields have seen a steep rise since late 2016
Chart 5: Chinese corporate bond yields  have seen a steep rise since late 2016
Source: Deutsche Bank


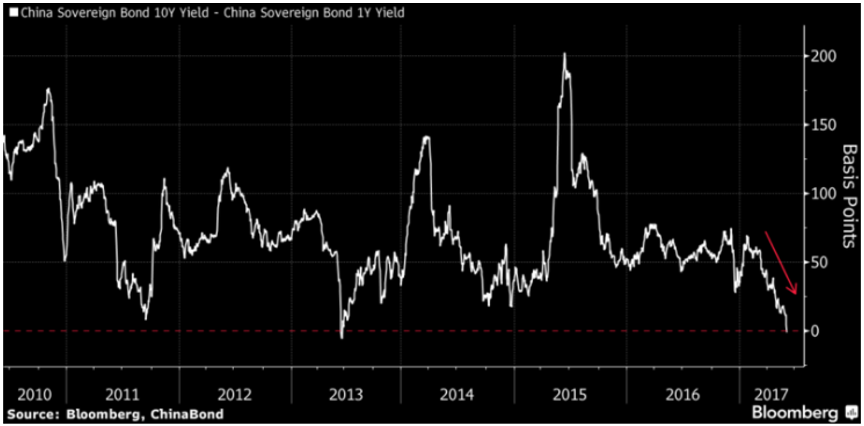
Something of real note is that recently the Chinese yield curve ‘inverted’, which means short-term yields on government bonds went higher than longer-term yields – see chart 6. That is an entirely abnormal situation given usually the buyer of a bond will require more compensation the longer they are exposed to the risk of the issuer defaulting. It’s only the second time this has ever happened in China and would normally suggest the market expects the economy to slow sharply in the medium-term.


Chart 6: the Chinese government bond yield curve has ‘inverted’
Source: Bloomberg


In the US, the yield curve has inverted seven times since the 1960’s and every time it preceded a recession. The last time the Chinese yield curve inverted the economy did not recess, which may well happen again this time, but it certainly indicates the market is under stress. Indeed, the idiosyncrasies of the Chinese bond market may make comparisons with the US meaningless: it’s nowhere near as deep and there are a lot more short-term bonds issued than long-term, and it is nowhere near as unregulated.


What does it mean?

As I said at the beginning, China is an incredibly complex beast. Some parts of the Chinese story beggar belief, like since 2009 China has increased its money supply by more than the entire US money supply; China has 260% of its economy in cash compared with 75% in the US; the Chinese banking system is now the biggest in the world at US$34 trillion, meaning Chinese banks are nearly three times the size of the economy while the US$7 trillion US banking system is equivalent to 40% of its economy; the amount the Chinese banking system has increased its assets since 2009 took the US banks 150 years to accumulate.

These are all staggering facts and prompt many questions and arguments. How can the Chinese money supply go up more than three-fold yet the currency over that period hasn’t changed in value? While a strong currency can be a matter of political pride, an overvalued currency makes for ridiculously cheap foreign purchases, be they companies, resources or houses.

The doomsayers point to the heydays of a rampant Japanese economy when Japanese companies were buying assets all over the world funded by more and more debt and every one of the top ten global banks were all Japanese. Their asset/debt bubble deflated by 85%, leaving the economy moribund for decades and battling deflation ever since. Perhaps it’s a case of history rhyming?

You can also draw on other lessons from the past. For instance, since 1990 every emerging market economy that saw the ratio of private sector debt to GDP increase by more than 30% in a decade experienced a banking crisis: China’s ratio increased by 93% in the nine years since 2007 to be 211% of GDP.

An obvious question is: what could be the catalyst? I have no idea, but bear in mind the Asian Financial Crisis of 1998, characterized by artificially high exchange rates and excessive debt build up, was triggered by Thailand floating its currency. Not many people would have connected those dots.

On the other hand, China bulls point out the government has done a remarkably good job managing what has been the greatest social transformation in history. It has tools at its disposal that western central banks can only dream about and government reserves that would be capable of recapitalizing the banking system. Plus, the gloom crew has been calling a Chinese debt bubble for years.

The issues touched on here could easily take up a whole book, if not two or three. Unfortunately when you’re talking an excess of debt bad things tend to happen, but while this is another example of a situation that warrants careful attention, it could easily go on for a lot longer than anyone might expect. Meanwhile the Chinese stock market is more than 20% cheaper than the US and China single handedly accounts for one third of global GDP growth. We need to hope it keeps going.

Inflation to stay low. But how low?

Inflation to stay low. But how low?

This article was written by our asset allocation consultant, Tim Farrelly. Inflation is a critical determinant of the direction of interest rates and bond yields, which in turn affects how pretty much every asset is valued. If inflation goes up, so do bond yields, which drives down asset values. So it follows that one of the reasons both bonds and equities have done well over the past seven years is because inflation has been low, but how long will that last?

By Tim Farrelly

What drives inflation?

In 1970, Milton Friedman had the answer…

“Inflation is always and everywhere a monetary phenomenon in the sense that it is and can be produced only by a more rapid increase in the quantity of money than in output.”

– Milton Friedman 1970

But, by 1978, the answers didn’t seem quite so straightforward…

“Inflation is obviously a serious problem. What is the solution? I do not have all the answers. Nobody does. Perhaps there is no complete and adequate answer.”

– Jimmy Carter 1978

The historical record provides a lot of seemingly contradictory evidence as to what drives inflation. Soaring oil prices seemed to trigger the 1970s inflation episode but had little impact in the decade from 1998 to 2008 where the oil price increased by over 13 times and, yet, inflation averaged just 3% per annum.

Huge deficit spending was a key driver of the German hyperinflation in the early 1920s but seems to have had no impact on Japanese inflation over the past two decades.

More recently, Zimbabwean hyperinflation was associated with a rapid increase in the money supply but we have seen no impact on US or European inflation from the huge money supply growth over the past decade driven by Quantitative Easing.

At this point Jimmy Carter’s “It’s complicated” seems a better framework than that of Friedman. However, farrelly’s believes inflation is quite a bit simpler than Jimmy Carter believed. It would appear that there are three main causes of inflation that can act independently or in concert:

  • Excessive wages growth;
  • A shortage of goods and services; and/or
  • Currency debasement.

Excessive wages growth

In most developed economies, wages are the key to inflation because they make up some 60% to 70% of the cost base of the economy. Excessive wages growth causes the costs of producing goods and services to rise, and businesses are forced to pass on those increases as higher prices or go out of business. Those higher prices drive a high rate of CPI inflation which employees then demand is factored into subsequent wage increases, which in turn drives cost and price increases – and so on. Welcome to the wage-price spiral.

Wages growth is not excessive where productivity growth matches or exceeds wages growth. Then we don’t get the pressure on costs or the need for price increases and so the wage-price spiral is broken. This relationship between wages and productivity was not lost on either party to the Accord between the Hawke Labor government and the Trade Union movement in the 1980s. Linking pay increases to productivity increases played a significant part in bringing Australian inflation under control in the 1990s.

Excessive wages growth can be a result of demand and supply imbalances. If an economy grows too fast, a shortage of labour can result in rising wages as businesses bid up the price of scarce workers. Typically, this is when central banks raise interest rates to take heat out of the economy and the imbalances are corrected over time.

Excessive wages growth can also come about where well organised unions create an artificial shortage of labour leading to wage increases and a wage-price spiral. This is particularly an issue in a closed economy, where offshore outsourcing is difficult. Opening up an economy to global competition significantly weakens employees’ ability to command out-sized wage increases.

A shortage of goods and services

When goods are in short supply, their price goes up. If the shortage is structural, as in a war-torn or otherwise failed economy, then the price rises are likely to be permanent and a wage/price spiral can set in.

In most developed markets, for most goods and services, this simply has not been an issue for decades. Commodities are an exception as they continue to be subject to large medium-term fluctuations in demand and supply. Prices do fluctuate wildly as a result but these imbalances tend to correct over time.

To illustrate the potential for commodity prices to influence inflation, students of the 1970s point to the twin OPEC oil shocks as the catalyst for a prolonged period of high, world-wide inflation. Between 1972 and 1980, oil prices rose from US$1.85 to over US$40 per barrel – an increase of 2100%.

Many wonder why the 1250% increase in oil prices between 1998 and 2008 had so little effect by comparison. The answer is because the 1970s increase was much larger and impacted a much larger part of the economy.

Firstly, the 13 times increase in oil prices from 1998 was from the very bottom of the market to the very top of the market, but neither the peak nor trough prices lasted for long. If instead we compare the 12-month average prices, we find an increase of seven times between 1998 and 2008 – still substantial, but a lot less than the 22 times oil price increase during the 1970s.

The second difference is that the world has become a lot more efficient in its energy use since the 1970s. It is estimated that it now takes 60% less energy to produce a unit of GDP than it did in the early 70s.

Put the two together and we have a much lower impact on costs and prices.

With energy at around 12% of the world’s cost base in 1968, a 22 times increase would cause the cost base to increase by a total of 280%, or 17% per annum, over eight years – but only if the world continued to use energy as it did before the oil shock, which of course it did not. We became much more efficient. So much so that, by 1998, the cost base of energy was closer to 5% of the economy and the seven-fold increase over the subsequent 10 years resulted in upward pressure on costs of around 35% or 3% per annum. Very different. That higher efficiency partly explains why the CPI didn’t increase by at least 17% per annum and 3% per annum following these oil price increases. In addition, businesses were not able to pass on all the cost increases and, in the 1970s at least, profitability plummeted. Finally, the 1998-2008 commodity boom was driven by the entry of China on the world stage and the opening up of markets worldwide. The price of many manufactured goods plummeted, offsetting the increased costs of energy related inputs.

Commodity prices can still cause medium-term spikes in costs but, in a world awash with capacity, resulting inflationary pressures tend to be muted and temporary.

Currency debasement

This has definitely been a factor in many inflationary episodes. Essentially, this occurs where there is a substantial increase in the amount of money in circulation without a corresponding increase in the supply of goods and services.

Normally, currency debasement is associated with deficit spending by governments on transfer payments – payments for which the government gets little or nothing in return. Transfer payments include things such as unemployment benefits, healthcare payments, unfunded pension payments and, arguably, military spending.

However, currency debasement is not just about government spending and is not just about paper money. The Spanish Price Revolution in the 16th and 17th centuries occurred where gold and silver, the currency of the day, poured into the Spanish economy, predominantly from their New World conquests, Peru and Mexico. No new goods or services were produced and, as a result, the purchasing power of gold and silver fell substantially. The more gold that was plundered, the less it became worth.

When thinking about currency debasement, we need to be very careful about what we consider to be money. Most common definitions of money include cash in circulation, at call bank accounts and very short-term deposits. Unfortunately, these definitions can be very unhelpful when thinking about currency debasement.

When it comes to thinking about whether or not a currency is being debased, farrelly’s finds it useful to think about what is happening to balance sheets – and, in particular, what is happening to household net worth in nominal terms.

Take QE as an example. We all now know that QE has not been inflationary, but many are still confused as to why this has not been the case. Thinking about balance sheets really helps.

Consider an investor who owns $1 million worth of bonds and sells them to the Fed. The investor now has $1 million of cash and, in net terms, is no better off. The investor puts the cash on deposit with their bank who in turn gives it back to the Fed. The Fed now has an additional $1 million of assets, being its bonds and a matching liability, the $1 million it owes to the commercial bank. On day one, it too has no increase in net wealth. Finally, the commercial bank has an extra $1 million in assets, being its deposit with the Fed, and an additional $1 million of liabilities, the amount owed to the depositor. Again, on day one, the bank is no better off.

In nominal terms, no-one is any richer and so there is no debasement of the currency. In this case, government bonds should also be thought of as money – and narrow definitions of money that exclude bonds confuse rather than clarify the situation.

The role of floating exchange rates

Floating exchange rates have two major impacts on inflation. They can protect one economy from importing inflation from another country and, secondly, if large, exchange rate moves can impact costs and inflation in the home country.

In the days of fixed currencies, such as the 1970s, when one country experienced inflation, it exported it to its trading partners. In a floating exchange rate environment, when one country has high inflation, its currency falls in value with the result that its trading partners don’t feel the impact in terms of higher prices for their imported goods.

The recent Japanese experience illustrates both impacts. When Shinzo Abe was elected in Japan and promised higher inflation, the Yen fell by over 20% and importers of Japanese goods saw their prices fall by 20%. Even assuming that Abe is successful in getting inflation back to 2% per annum, it will take 10 years for importers to see their prices rise. For Japan, that rapid currency depreciation meant that the cost of imported goods rose substantially and, for a while at least, they did get a burst of inflation.

In this way, an exchange rate shock can generate an inflationary shock in the country experiencing that currency fall. Consider an economy for which imports make up 20% of GDP. A fall in the currency from $0.75 to $0.50 would have the impact of raising the cost of all those imports by 50%, for an overall increase in the nation’s cost base of 10%. This will almost certainly translate into an increase in prices, however perhaps not by the full 10%. Firstly, the impact often takes time. Importers often hedge their currency exposures and wear some of the increase by way of reduced profit margins. Further, there are substitution effects where local products takes the place of imports, or low cost substitutes are found for the same goods. Finally, manufacturers double their cost cutting efforts so as not to price themselves out of business. Nonetheless, there is a price impact and it can be significant.

The challenge is to ensure that the one-off shock does not become the catalyst for an ongoing wage-price spiral, which is where the central banks enter the picture.

The role of central banks

Most central banks today have an explicit inflation target – generally between 2% and 3% per annum. This is a relatively new phenomenon. Germany led the way in the 1970s when it successfully began using monetary policy to informally target inflation. In terms of adopting a formal inflation target, New Zealand led the world when, in 1989, the Reserve Bank of New Zealand became the first central bank in the world to adopt an explicit inflation target. The RBA followed suit in 1993.

One of the strengths of the inflation targeting approach is that it helps ward off the onset of a wage-price spiral following a one-off shock to prices such as a rapid currency depreciation or an external commodities price shock.

To date, central banks around the world have been extremely effective in using formal inflation targeting to bring inflation under control – some would argue too effective, but that is a discussion for another time.

When it all goes wrong – the Weimar Republic, 1919 – 1923

Excessive inflation is rarely a result of just one thing going wrong – like a plane crash, there needs to be a series of errors. To get to hyper-inflation, everything has to go wrong.

Germany in the early 1920s just about collected the full set. A combination of strong labour unions, large deficit spending, a complacent Central Bank and external shocks in the form of major currency devaluations all created a wage-price spiral financed by ever faster printing of money. The end result was that inflation went from 37% per annum in 1920, to 3000% per annum in 1922, to a total collapse of the currency and economy in 1923. But we are a long way from any of that today.

Where are we today?

Australian investors should be mainly interested in Australian inflation and NZ investors in NZ inflation. Domestic inflation will drive domestic interest rates and domestic real returns. It is also useful to keep an eye on the US, as monetary policy there clearly impacts markets worldwide.

Going forward, the inflation outlook in Australia, New Zealand and the US is relatively straightforward. We have minimal currency debasement and the prices of manufactured goods are generally continuing to fall as globalisation and technology drive down costs.

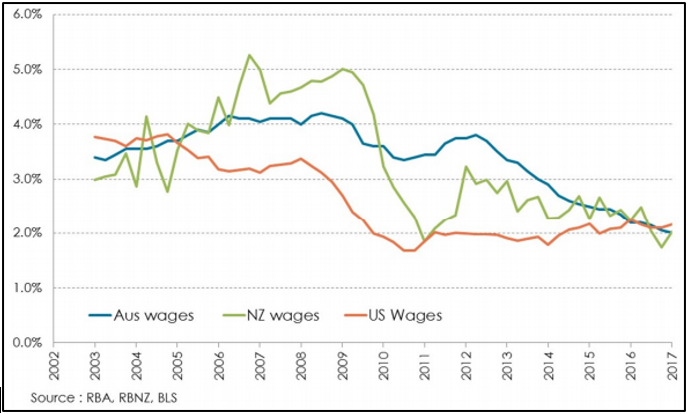
From today’s standpoint, wage inflation is the key to inflation – and it is falling. Figure 1 shows average two-year wage inflation in Australia, New Zealand and the US. We use the two-year change to take out some of the noise in the data and to show this very clear picture – wages growth is at historically very low levels in Australia and New Zealand and, in fact, in most of the developed world.


Figure 1 : Wages growth %pa (two-year average)
To see any pick-up in inflation, we will need to see faster wages growth or, perhaps, a sizable external shock. If added to complacent central banking, we could see a significant inflation surprise. But how likely is any of that?

Australian inflation outlook

Not only is wages growth low in Australia, it is falling. It seems the wage-price spiral is working in reverse – lower inflation means lower wages growth which means lower cost growth, lower price inflation, and so on.

In the near future, it is hard to see much change to this picture. The Australian economy has grown by 2.5% or less in each of the past four calendar years. This sub-par growth has largely been a result of the end of the construction phase of the resources boom where the winding down of capital expenditure has been a major headwind for the economy. Fortunately, the impact has been muted by the East Coast residential construction boom. However, as the impact of the mining capital expenditure slowdown finally starts to abate, it appears as if the residential construction boom will come to an end – another headwind for the economy.

The end result is that it looks like three of four more years of sub-par growth is in prospect for the Australian economy. In turn, that means stubbornly high unemployment and continued low real wages growth. Not much of an inflation stimulus here.

Potential for inflation shocks

The risks of high-impact one-off shocks seems low. Commodity prices are probably near their medium-term highs, so it is difficult to see much of an impact, particularly as the impact of commodity prices on general price levels is quite muted in any event.

A large, one-off fall in the Australian dollar could have an impact. As suggested earlier, a fall from US$0.75 to US$0.50, while unlikely, could potentially add around 10% to the cost base of the economy. In practice, as discussed earlier, the impact on inflation is likely to be a good deal lower. In all, such a fall would probably add 4% to 5% to prices, or around 1.5%per annum spread over two or three years.

A more likely currency scenario would be a fall to around US$0.65, which would add around 0.5% to inflation for a few years. This is not our central case, but it is one way that inflation could rise above the current level of around 1.5% to 2.0% per annum.

The RBA is anything but complacent

Our sense is that, despite all the downward pressure on inflation, the RBA would love to raise interest rates if only they could find an excuse. Currently, there appears no reason whatsoever to raise rates. However, it is very difficult to see the RBA waiting too long to respond to any increase in inflationary pressures. And, with record high household debt levels, it would not take too much by way of rate increases to dampen demand. There appears little prospect of a break out above the top of the RBA’s 2% to 3% per annum inflation range any time soon.

Australian inflation forecast of 2.1%pa for 2017-2027

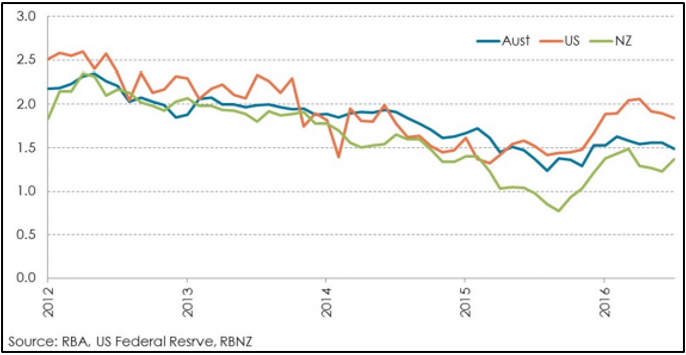
Which brings us to our forecast going ahead, which at 2.1% per annum is slightly lower than the prior forecast of 2.25% per annum, largely as a result of a slower than expected return to more normal growth. Now, this is clearly out of step with the bond market which expects 1.5% per annum inflation over the next decade, as is shown in Figure 2.


Figure 2 : Bond market 10-year inflation expectation (%pa)

While the bond market has done a better job than farrelly’s in forecasting inflation over the past three years, a forecast of just 1.5% per annum for the next decade seems overly pessimistic. Sometime in the next three to four years, the Australian economy should return to something like normal growth and full employment. In that environment, a 2.5% inflation rate is a reasonable expectation, particularly if we see some catching up in wages growth after a number of years of very low growth.

Nonetheless, if this forecast is wrong, it will be too high.

New Zealand inflation prospects

These are not dissimilar to Australia. As we see in Figure 1, wages growth is very low and has been falling since 2012 – again, the wage-price spiral in reverse. With a stronger economy than Australia and falling unemployment levels, we would have expected better wage growth outcomes than seen.

For their part, the RBNZ has been very accommodative and have cut rates in an endeavour to get inflation rates back into their target range. This should be interpreted as the RBNZ being very serious about their mandate. Kiwis should be in no doubt about how quickly the RBNZ would move to raise rates if inflationary pressures surfaced.

Again, the bond market expectations are for very low inflation going ahead – less than 1.4% per annum for the next decade. And, again, farrelly’s expectation is that this will prove a little too pessimistic. Note from Figure 2 that, in the middle of 2016, the bond market forecast average inflation for the next decade as low as 0.7% per annum after just two years of annual CPI growth below 0.5% per annum. It was surely a case of what has been described elsewhere as premature extrapolation.

We will stick with our 2.0% per annum forecast for NZ inflation – that is, a little reflation compared to the last two years inflation at 1.2% per annum, but not much.

US inflation prospects and the Fed’s response

In the US, there are some – barely perceptible – signs of a pickup in wages growth as employment gets back to full levels. However, as can be seen in Figure 1, US wages growth has been very, very low at around 2% per annum since 2011 – much lower than in Australia or in New Zealand.

As the US employment market tightens, it should result in wages growth closer to 3% per annum or perhaps higher. However, between 2000 and 2008, wages growth in the US (and Australia for that matter) grew in the 3% to 4% per annum range without triggering an inflation break-out.

Nonetheless, we should expect somewhat higher inflation than the 1% per annum inflation that the US has experienced on average over the past four years. The big question is how the US Federal Reserve will respond to rising wages and inflation. To date, the response has been quite straightforward – they have raised interest rates. farrelly’s expectation is that they will continue to raise interest rates until conditions normalize somewhat. The critical issue is, how far?

Figure 3 shows the rate increases implied by the current shape of the US yield curve. It shows a very gentle increase, with cash rates not getting above 2.0% until 2021.

Inflation to stay low But how low_chart3

There is every chance that if the labour market tightens quickly in the US, the Fed will go more quickly than this. The catalyst would probably be wages growth above 3.0% or 3.5% per annum. All markets could be expected to respond to such a move.

So, it is all eyes on wages growth for the next few years.

Some observations on the market

Some observations on the market

Global markets have recently hit new all-time highs and only last week the Australian All Ordinaries hit a post-GFC high – pretty impressive stuff. Within that though there has been an interesting switch in the underlying drivers of the Australian market in the past few months: resources had been leading the charge and have now pulled back, while yield-sensitive stocks softened for a while but have now staged a recovery.

Bonds

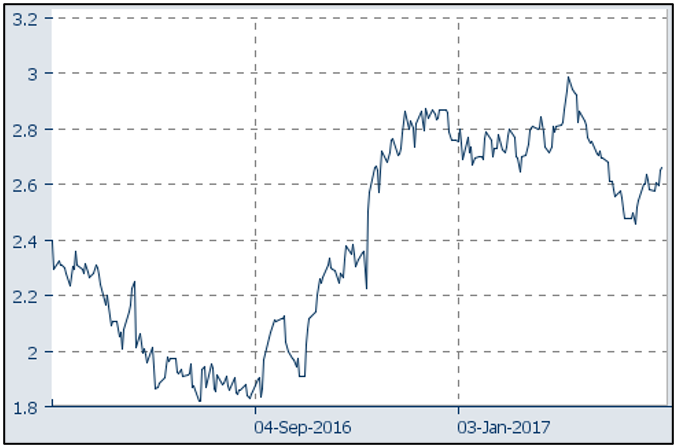
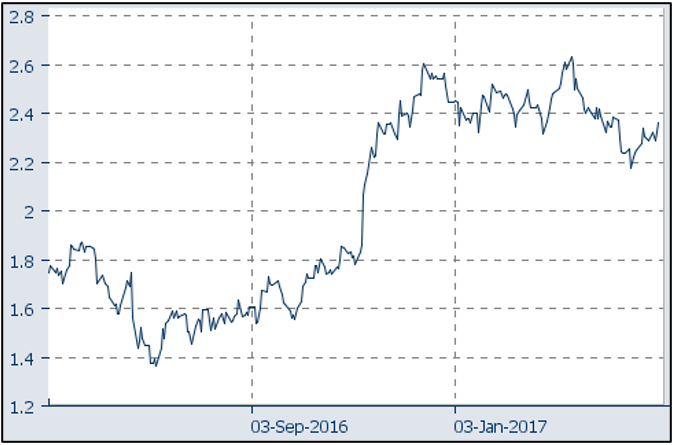
Bond yields across the world rose sharply from the beginning of September 2016 and peaked in March 2017, but have since experienced a reasonably significant retracement – see the charts below:

Australian 10 year bond yields
Some observations on the market_chart1
US 10 year bond yields
Some observations on the market_chart2

Exactly what caused that rally and reversal is, quite surprisingly, not altogether clear, but when bonds move like that there is going to be some fallout in the equities markets.

Yield stocks (bond proxies)

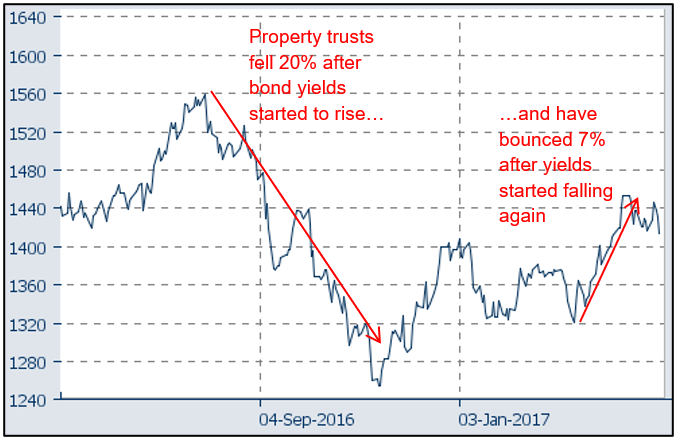
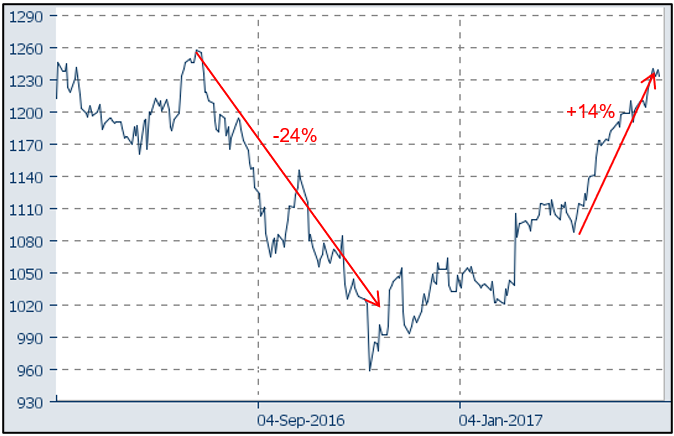
Stocks that are considered high yield plays, or bond proxies (that is, they are bought for their (usually) high and consistent yield) experienced a similar cycle to bonds: they peaked in July 2016 when US bond yields started rising and began to recover the lost ground once bond yields started falling sharply in mid-March. This can be seen in the charts below of the Australian listed property trusts (REITS) and Transurban, as a proxy for the infrastructure sector:


Australian property trust index
Some observations on the market_chart3
Transurban – as a proxy for the infrastructure sector
Transurban - as a proxy for the infrastructure sector

Commodities

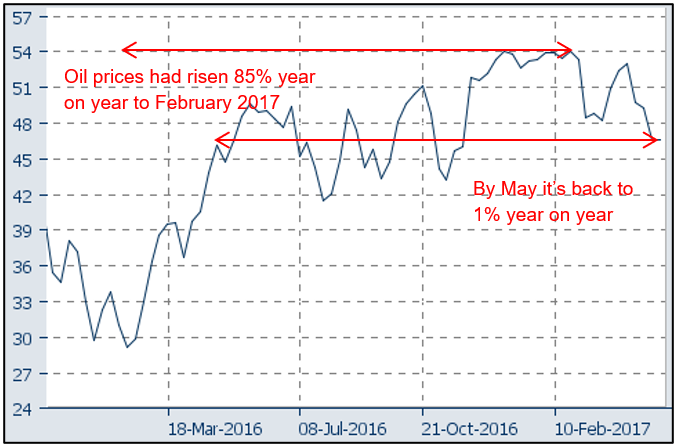
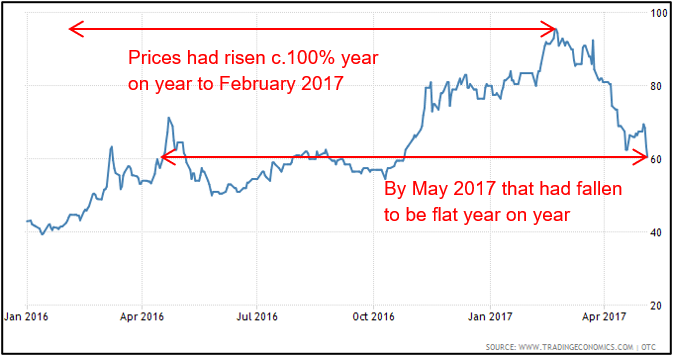
We’ve also seen a sharp fall in some of the key commodities prices recently: oil has dropped 17% in the past three weeks and iron ore is down about 35% in the past two months – see the charts below.

The oil price
The oil price
The iron ore price
The iron ore price

So whereas only three months ago we were experiencing year on year oil price rises of 85%, now it is less than 1%; similarly for iron ore, three months ago year on year prices had doubled, now it’s all but flat – as we’ve written before, that has a significant effect on inflationary pressures.

Resources stocks

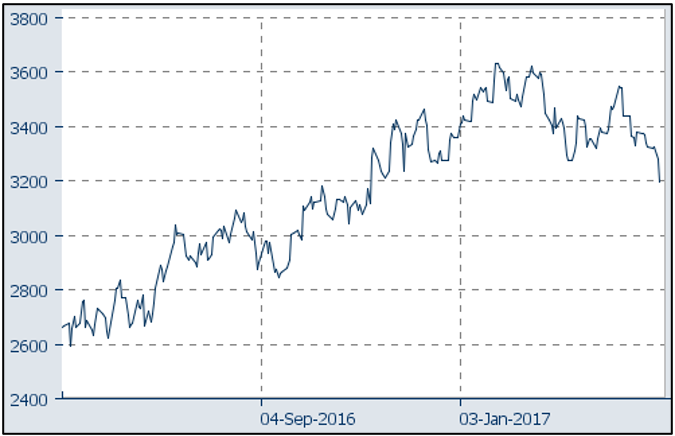
With expectations that global economic growth was on the rise last year resources stocks rose strongly as part of a global rally in the so-called cyclical stocks, whose earnings are seen as being leveraged to economic activity. Now, partly on the back of falling commodities prices and partly because of a tempering of growth expectations (the two of which could easily be linked), those resources stocks have weakened considerably, with the resources index down 12% from its recent peak – see the chart below – but within that sector BHP has fallen 19%, RIO 17% and Fortescue 33% all in the space of two to three months.

The ASX200 Resources Index
The ASX200 resources index

ASX200 unruffled

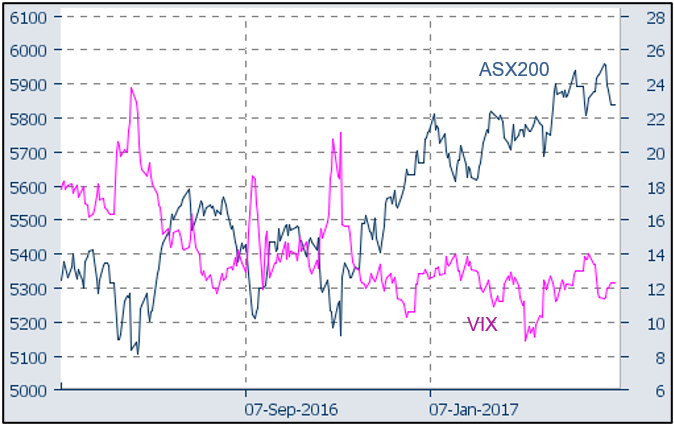
Interestingly, while this so-called ‘rotation’ from resources back to the bond proxies has been going on, the underlying sectors have seen significant moves while the volatility of the overall Australian share market has remained fairly low. The upshot has been a market that has remained in a positive trend while volatility, in the form of the Australian VIX index, has remained in a sideways trend.


ASX200 – staying positive Australian VIX – staying sideward

While these make for interesting observations, unfortunately there’s not much guidance to be gained for forward-looking tactical asset allocation. This is because the rotation described has come about from short-term changes in things like bond yields and commodity prices, which are almost impossible to reliably forecast, meaning you could easily get it wrong. Instead, we prefer to stick to our diversified, long-term model and remain alert to the underlying currents of the markets.