0399757070
The Land of the Rising Stock Market

The Land of the Rising Stock Market

The Japanese stock market holds the ignominious title of having played host to the biggest stock market bubble in history.

Over the four years leading to its peak on the last trading day of 1989, the Nikkei 225 rose by more than 30% per year, by which point it accounted for 37% of global stock market capitalization (the US was 29%), it was trading at 60x the previous 12 months’ earnings and hit a price to book value ratio of more than 8x.

Not surprisingly, the bubble reached into all aspects of the economy, especially the property market. After the big pop, Japan slumped into such a prolonged period of economic stagnation the following 20 years are referred to as the Lost Decades.

It took 34 years for the Japanese share market to hit a new all-time high, which happened in February this year, and it’s now 5.5% of the MSCI All Country World Index (which is still the second biggest but compares to the US at 62%), with a PE ratio of 15x and almost half the index trades at less than 1x book value.
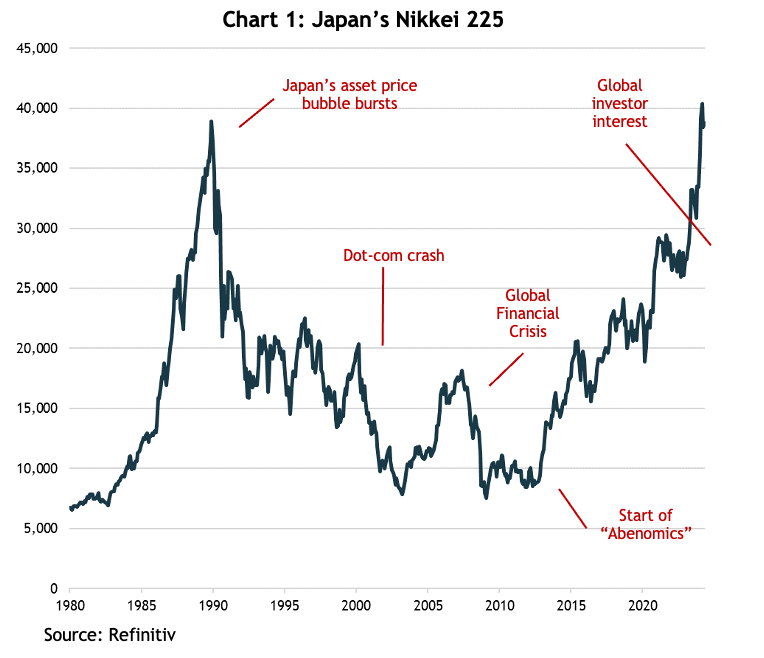
Chart 2: the S&P 500’s PE ratio with and without the MegaCap 8

The rise and rise of the Nikkei

In December 2012, Shinzo Abe was appointed as Prime Minister of Japan and introduced the “Abenomics” stimulus program designed to reignite the moribund economy. Whilst we can’t be sure the amazing share market returns since then are entirely due to those economic policies, you’d have to think they played a part.

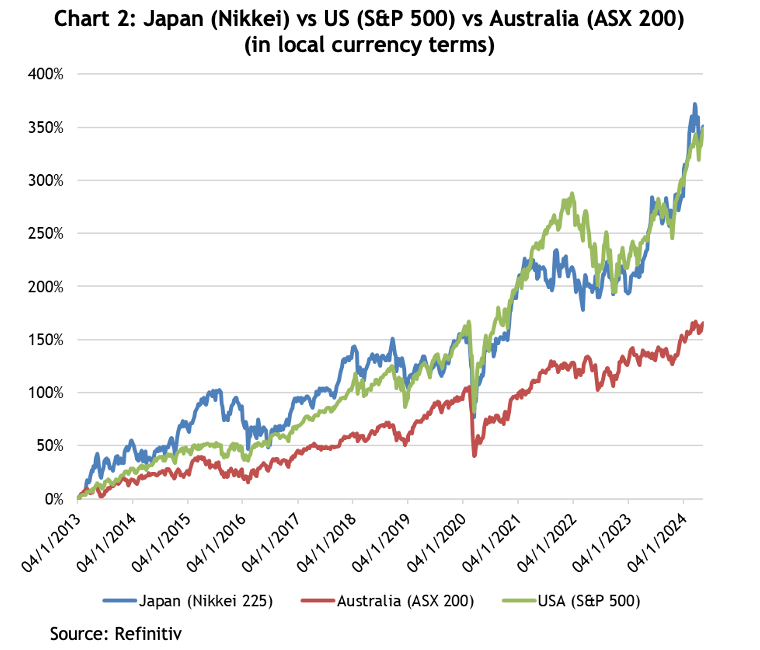
Given the incredible rise of the US share market in the post-GFC period, you’d have thought it had wiped the floor with all comers, but astonishingly, since the start of 2013, the Nikkei and the S&P 500 have increased by the same amount: 350% – see chart 2.

So why haven’t we heard more about Japan over the past 10-plus years? One reason is because we keep hearing about an economy that has struggled to generate positive real economic growth, a population that is in long-term decline and a government balance sheet whose debt is multiples of its GDP. Hardly inspiring stuff.

A second reason is that over that period since 2013 the yen has steadily weakened against the USD, so for US investors returns from the Nikkei were more than 40% less than what they got from the S&P 500. Unfortunately, that doesn’t excuse Australian investors, for whom AUD returns would still have been 80% higher than the ASX 200 over those 11 years (a total return of 300% vs 166%).
The santa claus rally

Hang on, where’s the AI?

Chart 2 shows the Nikkei has risen sharply since the start of 2023, as has the US. We all know about the US’s rally being powered by AI and the mega cap tech companies, but Japan doesn’t boast any household tech names. So what’s powered the Nikkei?

What we’re seeing is the culmination of more than 10 years of corporate reform, kicked off as part of Abenomics, which dragged what had been hidebound, stodgy Japanese companies into the modern era of disclosure and governance. That such sweeping structural reforms have been achieved is also indicative of Japan’s culture that emphasises the collective good, with the government’s Ministry of Economy, Trade and Industry working in conjunction with the Tokyo Stock Exchange (TSE) and the Keidanren (the Japan Business Federation).

Companies have been required to calculate the cost of capital and explain why returns failed to meet that cost; they’ve been urged to unwind complex cross shareholdings built up over decades; and the number of companies with at least 30% independent directors has increased from just 6% in 2014 to 97% in 2023.

The TSE emphasised the importance of companies improving returns and encouraging a more open dialogue with shareholders to improve governance, return on equity and valuations. In March last year, it announced they would be publishing a monthly list of those firms that have published written guidance on how they planned to improve their share prices, and by February this year, a staggering 54% of companies had complied or are actively considering it. Notably, the shares of companies that have published guidance have outperformed those that have not by more than 16% over that period.

The impact on overall returns has been extraordinary. Since the inception of Abenomics, earnings per share for listed Japanese companies has tripled, and return on equity has gone from negative levels in 2010 to 9% as of March 2024 – which is still half the US’s.

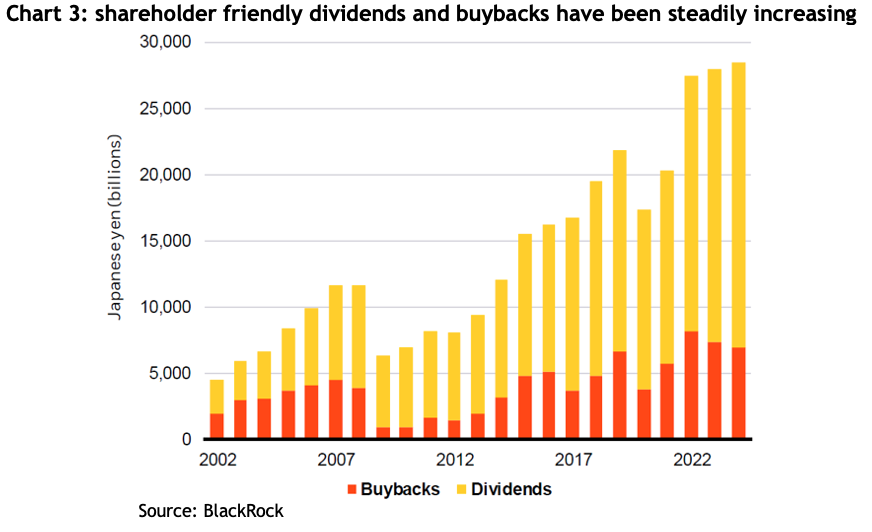
In the past, Japanese companies were notorious for sitting on piles of cash, burned by the experience of banks pulling loans in the aftermath of the asset bubble. Part of the reform has been encouraging the payment of dividends, and last year the yield hit almost 4%. In the most recent earnings reporting season, 53% of companies announced they plan to increase dividends this year, which is more than double what it was in 2012.

Part of the TSE’s push was to get companies to formulate a plan to get their shares trading at least at book value (that is, the market capitalization to be at least equal to the value of the company’s assets). When Abenomics started, 74% of listed Japanese companies were trading below book value, and by the end of 2023 that number was less 45% (compared to 4% on the S&P 500), and by February this year it was down to 33%. The current price to book multiple for the for the broader Topix index is still relatively cheap at 1.4x, which compares to the US’s 4.4x (very high due to the relatively low portion of tangible assets the megacap tech companies have) and Europe’s 2.1x.

When a company’s shares are trading on a low price to book valuation it makes sense for them to buy back their own shares. From 2017 to 2023 total share buybacks quadrupled to 4.15 trillion yen and are set to hit another record in 2024.
Aggregate weekly payrolls deflated by PCE inflation

Can it keep going?

Japan’s clearly enjoyed a fabulous run over the past 10+ years, are there reasons to think it could keep going? At the moment, it’s actually more of a challenge to find a strategist who’s bearish. One reassuring thing is there’s a variety of reasons put forward to remain bullish about the market.

Inflation

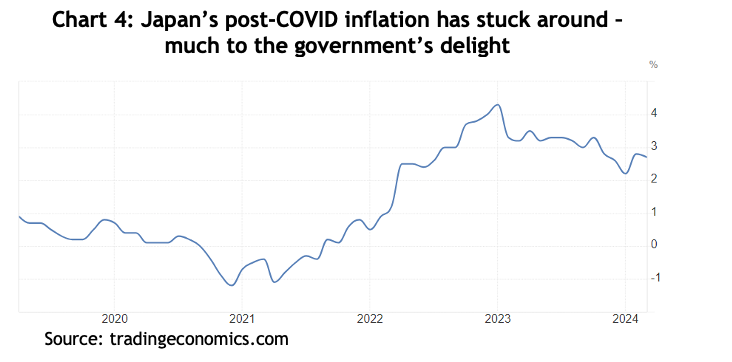
At long last, the Japanese economy appears to be showing signs of life. The government and central bank have been trying to generate positive inflation for years, running the world’s first QE program, maintaining zero bond yields and negative cash rates, but the CPI has averaged 0.5% for the past 20 years. However, the worldwide outbreak of inflation since COVID saw inflation peak above 4% and it’s proving at least a bit sticky, with the latest reading coming in at 2.7%.
Aggregate weekly payrolls deflated by PCE inflation

That glimmer of inflationary hope enabled the Bank of Japan to raise interest rates in February this year for the first time in 17 years, taking the key rate from -0.1% all the way to 0%.

Nominal GDP growth

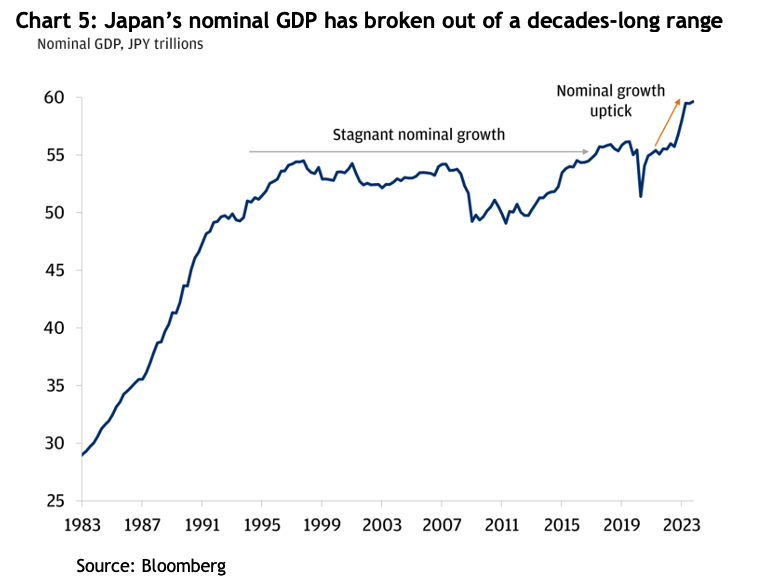
It seems the return of inflation has pushed Japan’s nominal GDP (that is, before accounting for inflation) into a new all-time high, which, if nothing else, may help confidence in the economy – see chart 5.
Aggregate weekly payrolls deflated by PCE inflation
Wages

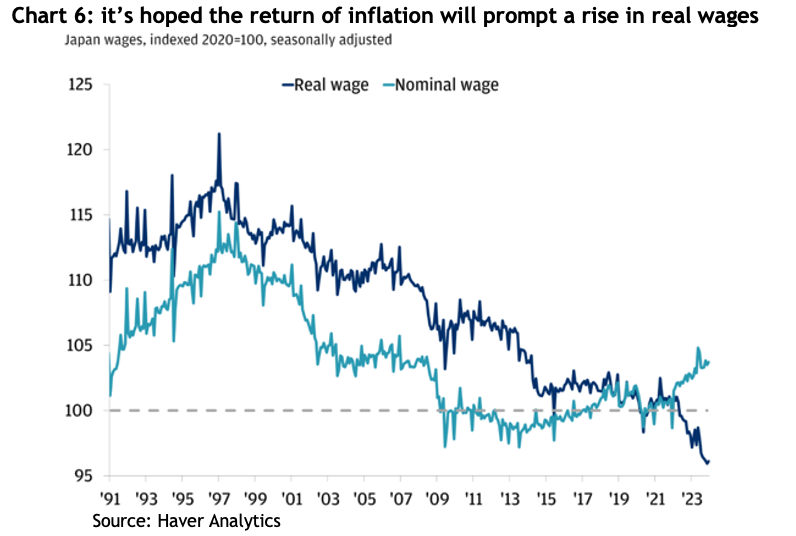
Economists are hoping the return of inflation may prompt an increase in real wages, which have been declining since 1996 – see chart 6. They figure if that happens consumers may spend a bit more.
Aggregate weekly payrolls deflated by PCE inflation
The Return of Mrs Watanabe

Mrs Watanabe was a term coined some 20 years to describe enthusiastic Japanese retail investors, more specifically in the currency markets. The government is trying to encourage their return.

The Nippon Individual Savings Account (NISA) is a program introduced by the Japanese government to encourage households to invest through an account that can hold domestic and foreign securities, ETFs, REITs and mutual funds. In January 2024 the government gave the program a major overhaul by doubling the annual limit people could invest to 2.4 million yen (about AUD23,000) per year and making the investments totally tax-free.

Apparently the combination of resurgent inflation, tax-free investment incentives and the rising share market has nudged Japanese households back to the share market. In 2023, more than half of the 2.1 quadrillion yen (about AUD2 trillion) of Japan’s household assets were held in cash and deposits, and while shares have risen by more than 50% as a proportion over just a few years, they are still only 18%, compared to 51% in the US.

The revamped NISA and a strong share market saw the total traded value on the TSE hit 60 trillion yen (about AUD55 billion) in a single week of February this year, which is more than twice what it averaged between 2015-2020.

Currency: tailwind or headwind?

The yen has been on a steady decline against most major currencies for decades, mostly because of the zero-interest rate policy causing a huge differential, especially over the course of the current global interest rate cycle. The upshot is the real effective exchange rate for the yen, which is an index that measures the strength of a currency relative to a basket of other currencies and adjusted for inflation, is at levels last seen 50 years ago – see chart 7.
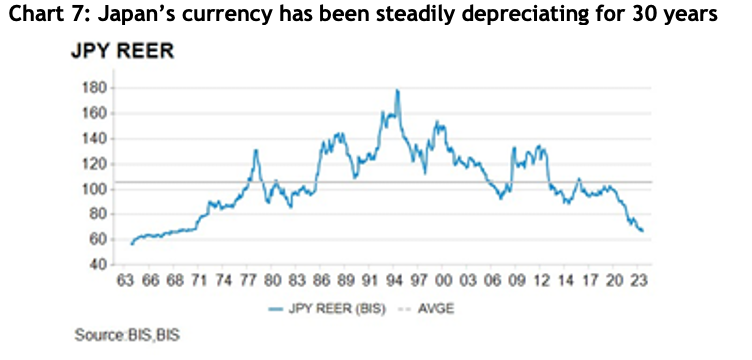
Aggregate weekly payrolls deflated by PCE inflation

A weak currency is terrific for a country that exports a lot of products, as Japan does, because it makes those exports cheaper for the buyers. However, it also makes imported goods more expensive, and Japan imports almost all its energy and much of its food, so there is concern the sticky inflation they’re experiencing now could get out of hand.

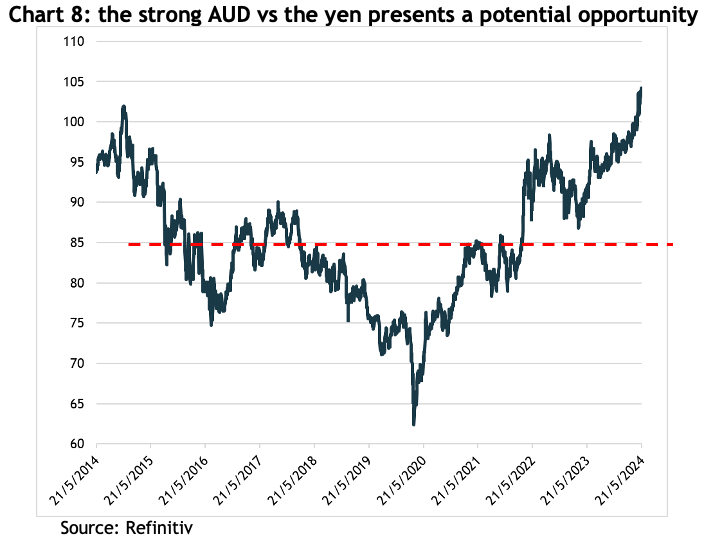
For Australian investors, the relative strength of the AUD against the yen at the moment presents a potential opportunity. Chart 8 shows the AUD is at the top of the past 10 years’ trading range, with a current value of 104 yen to one AUD, whereas the average over those 10 years is 85.
Aggregate weekly payrolls deflated by PCE inflation

If you were to buy the Japanese index and it did absolutely nothing for two years, but over that time the currency returned to its long-term average, you would make 18% just on the currency.

The big rediscovery

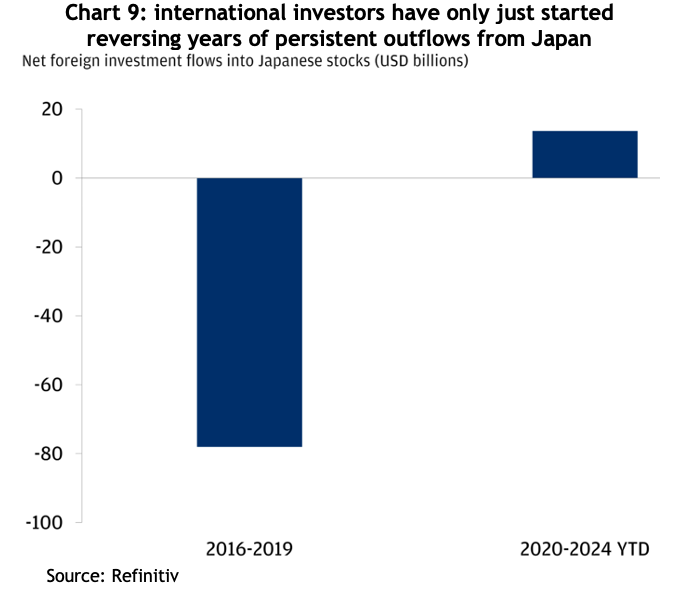
Japan has had the second largest stock market in the world for decades, but international investors steadily pulled their money out for years. Chart 9 shows the strong returns posted over the past 10 years have finally reversed that outflow. Who knows, with so many bullish reports on Japan, it’s possible that inflow of money is very much in its early days.
Aggregate weekly payrolls deflated by PCE inflation

Conclusion

The reasons for Japan’s strong share market returns over the past 12 years appear to be structural, thanks to coordinated efforts between the government, the stock exchange and companies themselves. What’s more, those structural changes appear to have at least a bit more to run.

Forecast earnings growth for Japanese companies in 2024 is 13% (compared to -6% for Australia) and 9% for 2025 (vs 4%), though they are renowned for being conservative with their guidance, preferring to under-promise and over-deliver.

The broader TOPIX index is on a forward PE ratio of 15.2x with a forecast yield of 2.1%, compared to the ASX 200 with a forward PE of 17.1x. Whilst Australia’s yield is a world leading 5%, the forecast fundamental total return (EPS growth + dividends), is -1% vs 15.1%.

Lots of strategists take an economically orthodox view, arguing if inflation falls again, preventing the BOJ from ‘normalising’ interest rates, i.e. increasing them, then things may not work out so well. The thing is, the index returned 14% compound per annum for more than 11 years when inflation was mostly negative. Who’s to say it couldn’t continue?


Are Australian shares expensive?

Are Australian shares expensive?

There’s something innately comfortable about investing in companies you know and a market you’re familiar with, so it’s hardly surprising Australian investors, like their peers all over the world, have a bias to investing in their home market.

And Australia has some great world class companies, like the mining giants BHP and RIO, CSL, Cochlear, Goodman Group and James Hardie, to name a few. Plus, there’s a host of terrific domestically focussed companies that are household names too, like JB Hi-Fi, Commonwealth Bank and Woolworths.

Throw in the benefits of Australia’s famously high dividends and the bonus of imputation credits, and it’s little wonder Australian investors will typically have a weighting to ASX listed companies way in excess of the 2.5% they account for in total global share markets.

But it does pay to keep a careful eye on whether Australian shares represent good value compared to investing into international shares.

Over the long run, share markets tend to follow the growth in company earnings, but in the short run, sentiment can be extremely influential. Changes in sentiment are captured in the price to earnings (PE) ratio.

If earnings for the overall share market grow by 10 per cent in a year, and the market has risen by 10 per cent, then the PE won’t have changed (ignoring dividends for the moment). That means sentiment hasn’t played any part in the returns enjoyed by investors.

However, if earnings growth was 10 per cent and the market went up by 20 per cent, then the PE ratio has doubled, meaning sentiment has played a big role in returns.

In 2023, PE ratios went up strongly across the world, in part bouncing back from being whacked in 2022. But for Australia, it was particularly important. Of the 12 per cent return from the ASX 200, a positive change in sentiment contributed about 16 per cent and dividends about 4 per cent. That means earnings growth was minus 8 per cent; not real flash when you compare it to the US’s 6 per cent, Japan’s 9 per cent, and even Europe managed 2 per cent – see chart 1.

Chart 2: the S&P 500’s PE ratio with and without the MegaCap 8

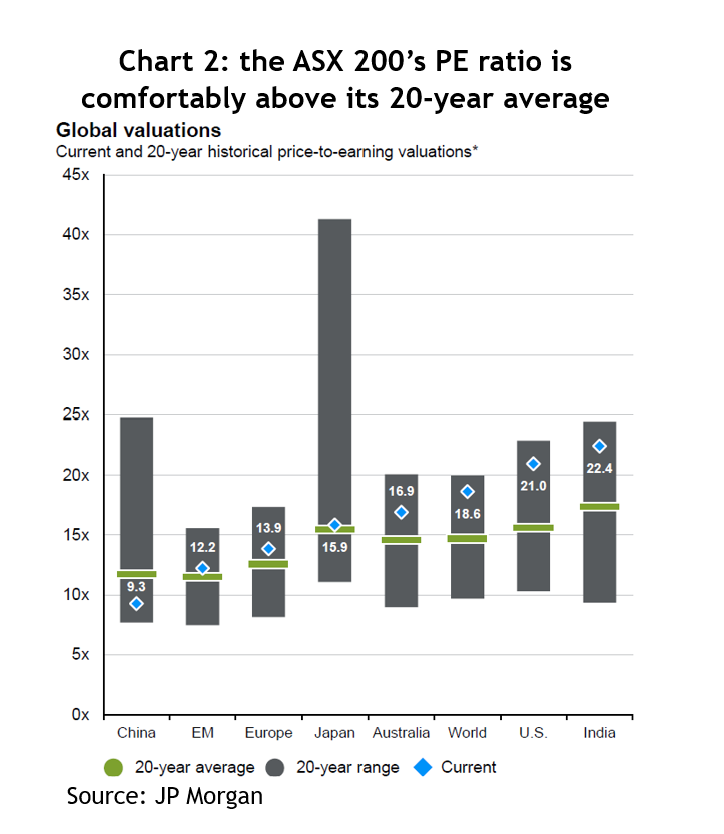
At the end of March this year, the ASX 200 was trading on 16.9 times forecast earnings, which makes it pretty pricey compared to its 20-year average of 14.9 – see chart 2. But that optimistic outlook isn’t matched by what analysts are forecasting earnings growth will be, which for the calendar year of 2024 is barely above zero and for 2025 is about 2 per cent.

The santa claus rally

Meanwhile, other international markets have much more favourable metrics. While the US is trading on a higher PE of 21x, its forecast earnings growth for 2024 is 11 per cent and for 2025 it’s 13 per cent. Europe is trading on 13.9x, with earnings growth forecasts of 3 per cent and 10 per cent. For Japan, it’s 15.9x, 11 per cent and 8 per cent – see chart 3.

Aggregate weekly payrolls deflated by PCE inflation

Even if you add the 1.4% average extra return from imputation credits, it still leaves Australia looking expensive compared to other international markets.

How much to allocate to international markets and how to do it are the obvious questions. The amount, or weighting, depends on a bunch of different considerations, like how any change would be funded. Does it mean selling holdings that would crystallize a capital gain? Do you have an income target for the portfolio? If yes, how much comes from fixed income versus dividends? If you have to make regular withdrawals from the portfolio, such as a pension, would you be comfortable funding that through a combination of income and harvesting capital gains?

As for the how, there’s an enormous range of exchange traded funds (ETFs) available on the ASX that enable a smart investor to lift their international allocation. If you’re happy just to follow an index, Vanguard gives you a one-stop solution with its Global Shares ETF (VGS), or you can get US exposure to the S&P 500 or NASDAQ.

Alternatively, there are ETFs that use an algorithm to work out what holdings it will buy. A very popular one is VanEck’s International Quality ETF (QUAL), which holds 300 of the world’s highest quality companies and includes the likes of Microsoft, Apple, Nvidia, Nike, Johnson & Johnson and Unilever.

There’s no shortage of ways to help break free from the home country bias, it just takes a bit of digging, or, if you don’t feel confident to do that, ask an adviser.

China – time to buy?

China – time to buy?

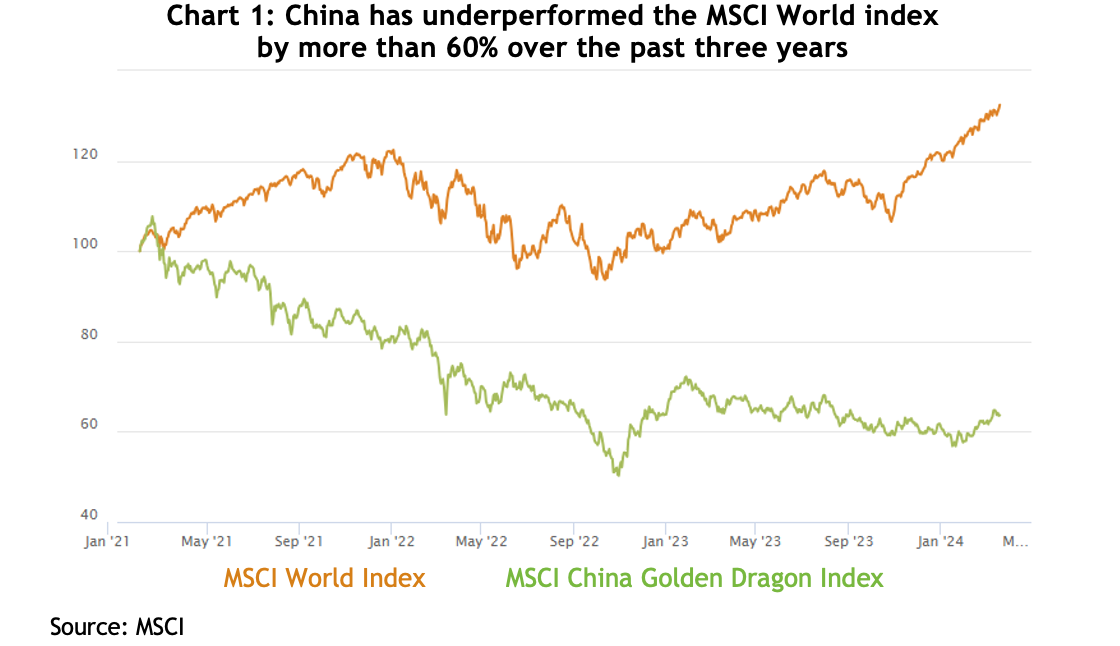
From its peak in early February 2021, China’s share market went through a grinding three-year decline of 40 per cent, while over the same period the MSCI World index was up 20 per cent. When one of the world’s largest stock markets underperforms by 60 per cent it makes sense to see if there’s a bargain to be had.

Chart 1: there’s real money going into IT spending in the US

What’s happened to China?

The fabled China growth miracle hit a couple of huge speed bumps in the form of COVID and a serious shakeout in the property sector.

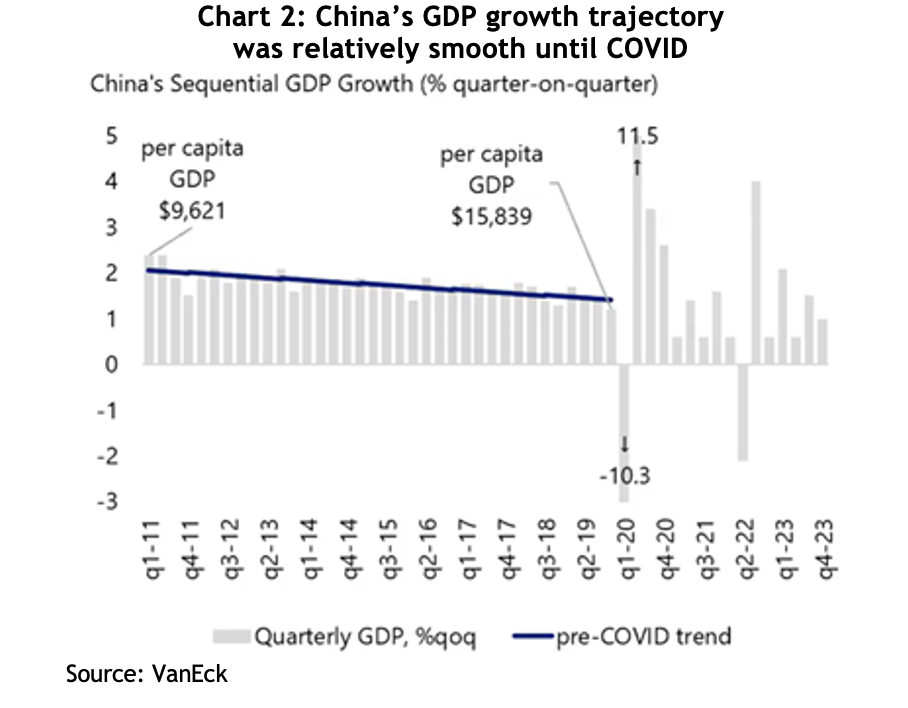
In the six years to the end of 2019, China’s annualised GDP growth rate declined in a very smooth, if not controlled, path from a ridiculously high 7.5 per cent to a still astonishing 5.8 per cent. Then COVID wreaked havoc. Between stringent lockdowns and the government’s refusal to make similar fiscal injections as western governments, the Chinese economy didn’t bounce out of COVID in the same way Australia and the US.

Chart 2: the S&P 500’s PE ratio with and without the MegaCap 8

The COVID slowdown triggered an almighty reckoning in the property market, which accounted for a whopping 30 per cent of China’s GDP in 2022. The government finally tried to deflate a classic speculative property bubble, which led to two of the biggest property developers in China, Evergrande and Country Gardens, which between them had more than USD520 billion of debt, spiralling toward oblivion.

Recent data showed housing starts in China fell 30 per cent year on year and completions were down 20 per cent, while sales dropped 21 per cent and property values got crunched by 29 per cent.

While those numbers are very messy, the government was determined to avoid the banking catastrophe the US experienced in 2008. Dr Joseph Lai, of Ox Capital, reckons that although there will be significant bad debts, they appear to have already peaked and the banking system has proven to be resilient.

Positive signs?

There was general surprise when China’s 2023 GDP growth came in a bit better than expected at 5.2 per cent, and Citibank notes the February data contained some positive signals, with industrial production rising 7 per cent year on year, in stark contrast to the US where it was slightly negative over 12 months.

Investment was also “way higher than consensus”, with manufacturing investment up an impressive 9 per cent for the first two months of the year and infrastructure 6 per cent, much of it actively encouraged by Beijing as a way of reducing the economy’s dependence on property.

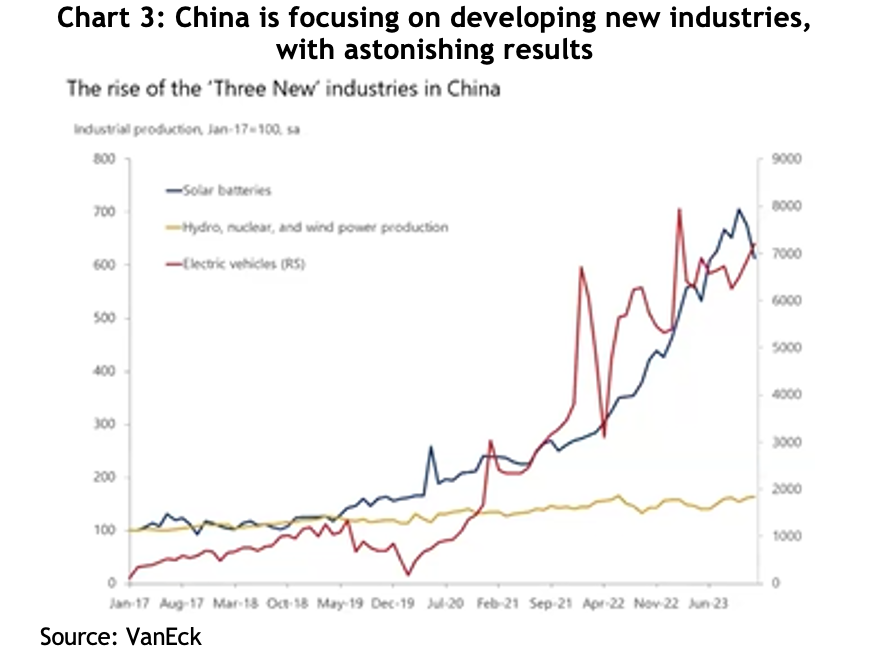
The government is actively promoting decarbonisation industries, with the usual head spinning results you get when China puts its mind to something. For example, electric vehicle production has risen about seven-fold from pre-COVID levels, and now China produces about one-quarter of the world’s EVs and accounts for more than half of registered EVs worldwide. Similarly, solar battery production has risen more than three-fold and it accounts for more than 80 per cent of global solar cell exports and 50 per cent of lithium batteries.

The santa claus rally

Although the critical consumer sector is still not as optimistic as it was pre-COVID, retail sales rose a healthy 5.5 per cent compared to a year ago.

The share market

If share markets directly reflected economic growth, the Chinese share market would have been the world’s biggest a long time ago. The fact is, economic growth can be generated by government spending that doesn’t necessarily benefit private companies, or come from sectors that aren’t represented in the index.

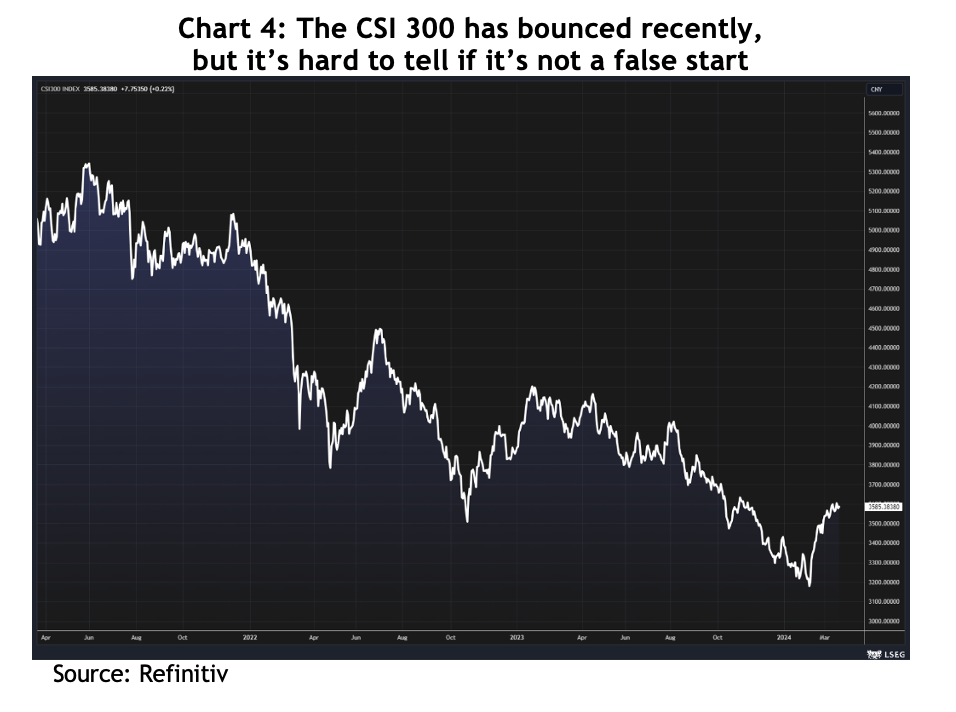
Having said that, the Chinese market does look cheap. After that 40 per cent crash and bottoming in early February, the CSI 300 bounced more than 13 per cent in seven weeks, but at a time when markets across the world are hitting new all-time highs, China is still 38 per cent away from theirs. That bounce caught the attention of a lot of technical analysts, but consensus is that it’s still early days given there have been false starts over the past couple of years.

Aggregate weekly payrolls deflated by PCE inflation

China’s price to earnings ratio for the next year snuck below 10x and is still about half the US’s and way below Australia’s 17x, while earnings growth over the next year is forecast to be about 14 per cent, compared to Australia’s very pedestrian 0-3 per cent.

All eyes will be watching for signs the Chinese government will increase its support for either the economy, or the share market, or both. There had been hopes the government would repeat the massive spending package of 2008 that helped drag the world out of the GFC, but it never came. There has been some easing of borrowing rates and ham-fisted restrictions on selling Chinese stocks by local financial institutions, but no killer package.

There is no telling if the Chinese stock market crash is over, but smart investors know that in carnage can lie opportunity. For those looking to access China, VanEck has two ETFs listed on the ASX: CETF invests in the 50 largest mainland companies, and CNEW uses an algorithm to invest in 120 quality companies across IT, healthcare, consumer staples and consumer discretionary.

Is the US share market uninvestable?

Is the US share market uninvestable?

Last week I was at a conference about alternative investments, and I cannot tell you how many people I spoke to who had decided the US share market is nuts. They were piling all kinds of arguments behind that view:

  • The S&P 500 has jumped 24% in just four months, but without the top tech stocks that return would be closer to 8%
  • Nvidia alone has gone up 95% over the same time, but it’s risen 420% since Chat GPT was announced in November 2022
  • Market concentration has never been greater with the MegaCap 8 stocks (Apple, Amazon, Alphabet, Meta, Microsoft, Netflix, Nvidia and Tesla) now accounting for 28% of the S&P 500
  • The MegaCap 8’s combined market cap would make it the second largest country stock exchange in the world
  • The S&P 500’s PE ratio is 28x, compared to a 30-year average of 17x
  • The Goldilocks US economy could crack any moment

Without digging any deeper, that’s a bunch of statistics that would be enough to have anyone wondering if the market’s gone a little mad.

So, let’s dig a little deeper.

Bears always sound smarter

First, before you go believing the people arguing everything’s turning to custard, just remember, the lizard part of your brain that’s hard wired to make sure you survived the thrills and spills of the savannah biases you to thinking what those people are saying is smarter and more trustworthy. It’s the survival instinct, designed to make us think twice and stop us from being reckless.

Then there’s what behavioural economists call second level thinking, where you take a breath and think for a moment, that can prevent you from just swallowing what people say without giving it some thought.

It’s the fundamentals

There have been lots of calls that the current AI boom is reminiscent of the dotcom bubble that popped in 2000, and it took the S&P 500 seven years to get back to that level.

But is it? The dotcom bubble was largely hypes and dreams, with almost no actual earnings to back it all up.

Compare that to Nvidia, which recently reported its fourth quarter results that smashed analysts’ forecasts:

  • Revenue up 265.3% to US$22.1 billion, 8.2% ahead of consensus
  • Data centre revenue up 408.8% to US$18.4 billion, 6.9% ahead of consensus
  • Gross margin up 1,064 bps to 76.7%, 128 bps ahead of consensus
  • Earnings per share up 486.4% to $5.16, 3.6% ahead of consensus

From the start of 2022 to 21 February this year, Nvidia’s earnings have grown 231%, but the stock price had risen only 130%, because the PE multiple, which is a measure of how much sentiment is driving the share price, actually detracted by 102%. In other words, there’s less hype in the share price over that time.

AI has certainly captured the market’s imagination, but it’s no fairytale, there’s real money behind it. Of course, we don’t know if the earnings and revenue growth are going to keep going, but check chart 1: spending by US companies on computers and electronic stuff had already got a big boost from Biden’s CHIPS Act and the Inflation Reduction Act, both passed in August 2022. But you can see the huge jump after Chat GPT was launched in November 2022 – US companies are clearly spending up in a race to incorporate AI into their businesses.

Chart 1: there’s real money going into IT spending in the US

Anyone who’s witnessed the magic of AI through Chat GPT or Google’s Gemini has to admit it’s a mind-bending experience, and those consumer-oriented models are the proverbial tip of the iceberg. There’s a website called Hugging Face, which calls itself “The AI community building the future” that has more than 520,000 AI models available.

AI is definitely here to stay. It’s definitely going to have far reaching impacts. And it’s only going to get bigger and better (and possibly scarier).

Market concentration ain’t all it’s cracked up to be

There’s been a lot of talk about the fact that the top 10 stocks in the S&P 500 have never represented such a high proportion of the overall index, usually followed by dark warnings about concentration risk.

Here’s a bit of context: the top 10 stocks in the US account for 34% of the S&P 500; in Australia, it’s 47% of the ASX 200; in the UK it’s 49%; Germany and France it’s 58% and in Italy it’s 66%.

In other words, it’s not a big deal. Yes, if the bigger companies fall hard it will impact the index by more, but clearly that’s not unique to the US.

There are two other important indicators for the broader US market. First, the industrials index, which represents old fashioned companies that manufacture stuff, has hit an all-time high, and the S&P 500 equal weighted index, which ignores market caps so all companies carry the same weight and influence (so it neutralises the MegaCap 8), is also close to an all-time high. They are both indicators telling us the rally is gradually becoming broad based.

How representative is the PE ratio?

Yardeni Research says the S&P 500’s PE ratio for the next 12 months was 20.4x on 15 February. For the MegaCap 8 it was 28.0x and for the other 492 stocks in the index it was 18.2x – see chart 2.

Chart 2: the S&P 500’s PE ratio with and without the MegaCap 8

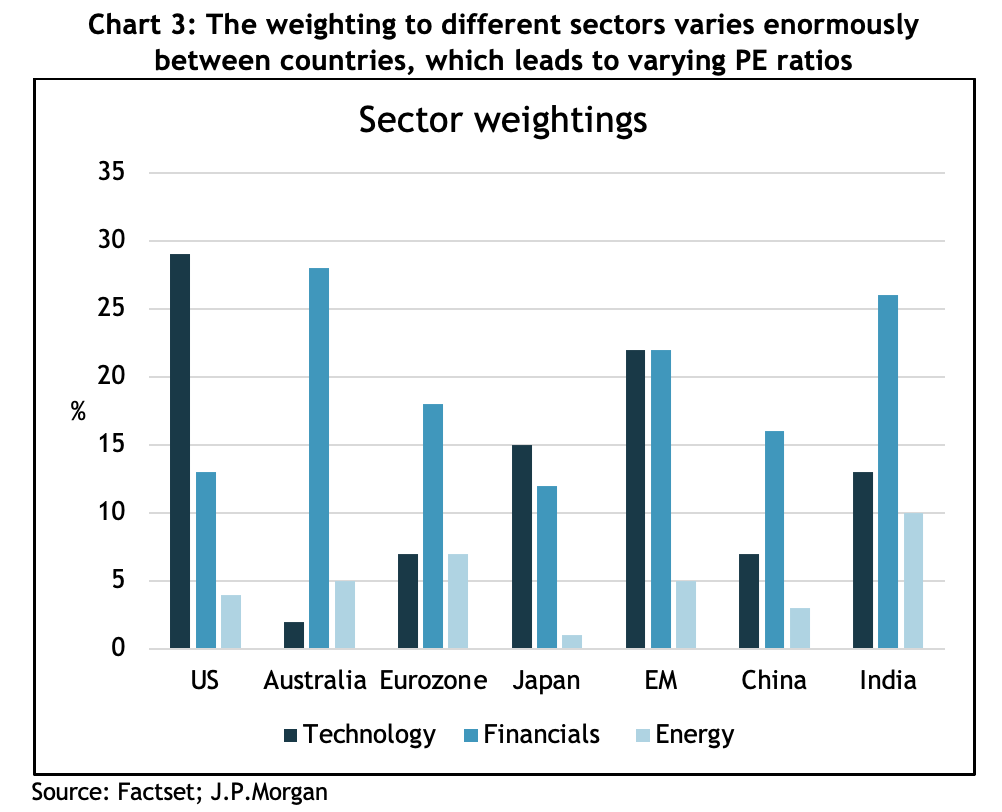
First, I wrote an article for the AFR about this a few weeks ago, explaining how the US index has a much higher proportion of high growth tech companies than any other index in the world, so comparing the PE for the US to, say, Australia, where more than half our market is taken up by low growth banks and resources companies, is like comparing the proverbial apples and oranges.

For a bit more context, a company’s PE ratio is determined by a combination of how much the earnings are expected to grow and how positive or negative sentiment toward the company is. Forecasting earnings growth is hard enough, but forecasting sentiment is, well, impossible.

Suffice to say though, Yardeni reckons the 3-5 year earnings growth for the MegaCap 8 is forecast to be 38.9%. That’s really high, and if they can pull it off (admittedly a big if), maybe a 28x PE ain’t so bad after all.

The second part to this argument is that paying 18x for the rest of the US market might not be so bad either. It’s a smidge over the 20-year average PE of 17x, but, again, the US index has changed enormously over those 20 years. In 2003 financials was the biggest sector in the US at 20% and technology was 17%, but now financials is only 13% and tech is 30%. So, to suggest that the index should be trading on the same PE as it was when the composition was very different doesn’t make sense.

Looking into the almanac

There’s a group in the US called Carson Investment Research, and they trawl through data about the US share markets to spot trends and patterns, something I call almanac investing. I’ve highlighted two out of the many positive points they’ve raised about the S&P 500.

The santa claus rally
Zweig Breadth Thrust (ZBT)

You could understandably dismiss both of these observations as not much more than coincidences and say precedents like these are just made to be broken.

However, the reason I highlighted them is that I think they reflect a pattern of investor behaviour, which in large part is the all important swing factor of sentiment.

The US economy is still strong

The US economy defied a hugely overwhelming consensus that there was going to be a nasty recession last year. Whilst now consensus is that there will be a “soft-landing” (a soft way of saying they were wrong), there are still some bears holding out for a downturn.

Look, they may turn out to be right, if there’s one lesson we all should have learned by now it’s that forecasting the macro economy (things like inflation, unemployment, etc) is really difficult, but there are a few indicators of what’s happening in the real economy that I find persuasive.

First, real wages have grown steadily since COVID, and people having more money to spend is an unequivocal positive.

Aggregate weekly payrolls deflated by PCE inflation

Importantly, most of the growth in wages is going to the lowest paid workers, who are far more likely to spend it.

Graph: Average hourly earnings delated by PCE price index

Inflation in the US looks like it’s now well within the Fed’s target range of 2-3%, especially if you exclude housing (which they call shelter).

CPI Changes

Why would you do that? Because the Bureau of Labour Statistics, which calculates the CPI, uses a reading for shelter which every man and his dog knows is about 12 months behind the real market. The Fed knows it too, so why they persist remains a mystery.

The chart below shows the Zillow (the US equivalent of realestate.com) rental index advanced by 12 months. In other words, the Zillow index peaked in the middle of 2022 and has been declining ever since. Price increases on apartment rentals have fallen so much they’ve gone negative, meaning rents are dropping. Overall, real world evidence suggests housing costs are way below where the Fed is presuming they are, and they’re still going down.

Graph: rent measures year over year % change

And why is it important? Because shelter accounts for about 30% of the CPI number, and 40% of the so-called “Core CPI”, which excludes food and energy costs and which the Fed says it watches more closely.

In turn, the critical follow on from that is interest rates do not need to stay so high if inflation is back in the target zone. The prospect of the Fed eventually lowering interest rates is a big part of what’s got the share market excited.

Finally, another bit of real-world evidence that the economy is pretty strong is shown in the incredible rise of manufacturing construction spending, which has taken off in response to the Biden administration’s Inflation Reduction Act, which throws a bunch of different subsidies at anything that resembles an energy transition project.

Graph: Real manufacturing construction spending

The bottom line

It’s true the US share market has notched up some strong returns and has hit a new all-time high, but that doesn’t have to mean it’s on the verge of falling again. There’s plenty of anecdotal, technical and fundamental evidence to back the move.

Nor does it mean the index can’t go through a serious correction. On average, the US market experiences a 14% intra-year decline every year.

At the end of the day, trying to time a market by selling and buying back again is really, really difficult. Take comfort that the bears have been wrong since the market bottomed in October 2022, why should they necessarily start being right now?

Private credit is redefining fixed income

Private credit is redefining fixed income

Private credit is redefining fixed income as an asset class, with returns as high as 10 per cent plus attracting an explosion of interest. But all that attention has drawn the usual cowboy operators, so smart investors need to be careful.

What is private credit?

Private credit is investing in loans made by non-bank lenders that can cover a broad range of purposes and borrowers.

Normally a private credit lender raises money from investors and doesn’t use debt, so zero gearing. That makes these companies very different to a normal bank, where the loan book will be dozens of times bigger than the bank’s equity.

Taking out a private credit loan is almost invariably much more expensive than borrowing from a commercial bank, with interest rates currently as high as 12 to 13 per cent. So why are borrowers flocking to private credit lenders?

Why the boom in private credit?

After the GFC, banking regulators around the world forced commercial banks to beef up their balance sheets, requiring them to back their loans with more equity to absorb potential losses, especially loans to sectors that had a history of high default rates, like commercial building and property development. That same regulatory crackdown caught up with the Australian banks in 2016, when their regulator, APRA, declared it wanted them to be the best capitalised banks in the world.

After that, it became far more profitable for Australian banks to lend for residential property, because they didn’t have to set aside as much equity on their balance sheets. Consequently, they all but abandoned some parts of the commercial lending market.

Spotting a huge, and growing, opportunity, private credit groups sprang up to fill the gap. Often staffed by the same experienced credit teams from the big banks who were now twiddling their thumbs, they got backing from investors with the prospect of outsized returns relative to the risk.

The result: EY estimates the Australian private credit market grew from $35 billion in 2016 to $109 billion by the end of 2022, a 21 per cent compounded annual growth rate. The global private credit market was estimated to have grown at 15 per cent per year between 2000 to 2022, reaching more than $1 trillion.

As often happens, Australia is a bit behind the US, where Foresight Analytics estimates non-bank lenders control about 50 per cent of the market for commercial real estate loans, and in Europe it’s about 25 per cent, while in Australia it’s around 10 per cent, but growing strongly.

What’s the attraction for investors?

Fixed income plays two roles in a portfolio: first, to provide some income, and second, to have little, if any, correlation to growth assets like shares, in other words, be a defensive asset.

Income-wise, over 2023 there were a number of private credit funds that returned well above 10 per cent, even as high as 12 per cent. For context, the Australian 10-year bond yield peaked at 4.95 per cent.

In terms of low correlation to shares, the word “private” is the critical part. Unlike corporate or government bonds, private loans are not normally traded on public markets, which makes them far less volatile because there is no day-to-day repricing, the fancy name for which is “mark-to-market risk”. In 2022, when bonds and shares both fell heavily, well-managed private credit funds continued to pay their interest and the unit price never changed.

The other attraction is security. For example, a private credit fund that lends to property developers will take a mortgage over the project, including the land, just the same as when a bank lends to a homeowner. Usually, the lenders require a loan to valuation ratio between 60-65 per cent. That means if the deal goes pear-shaped and the private credit manager repossesses the property, it has a 35-40 per cent buffer before investors lose any money.

In addition, the lender will also normally take a charge over other company assets as well as get a directors’ guarantee, meaning their personal assets are on the line as well. Plus, Australian lending rules are tilted very much in favour of the lender, enabling them to impose onerous covenants on the borrower.

There’s a lot to like about investing in private credit, but its popularity has drawn a lot of new operators, not all of which are experienced in credit analysis and some of which are under pressure to get investors’ money to work so are not as fussy about who they lend to. On top of that, some private credit deals will tie up your capital for up to 18 months, or even “semi-liquid” funds will take 2-3 months to get your money back. It pays to do your homework carefully.

Maybe the US share market isn’t as expensive as you think

Maybe the US share market isn’t as expensive as you think

The US share market has just hit a new all-time high and its returns have smashed the rest of the world for the past 15 years. But US shares also trade on valuation multiples that are much higher than the rest of the world, leaving investors who already own US companies wondering if they should lighten off, and those who don’t wondering if they should wait for prices to fall before buying in. But maybe the US market isn’t as outrageously expensive as most commentators would have us think.

America: home of the best companies, land of innovation

America is uniquely positioned, making it very difficult to bet against in the long run. Goldman Sachs points out that not only is it the biggest economy in the world, accounting for 26 per cent of global GDP, it is bestowed with an abundance of natural resources. It has the most arable land of any country and is now the world’s largest exporter of agricultural commodities, and, at 20 million barrels per day, it is also the world’s biggest oil and gas producer and exporter, with daylight to Saudi Arabia at number two with 12 million.

It also has the most favourable demographics of any developed country, the most productive labour force, and boasts the deepest capital markets, more than seven times the next biggest.

Since the late nineteenth century, the US has been at the forefront of technical innovation, boosted by some of the best universities in the world. In 2022, it was the global leader in R&D, spending US$879 billion, more than the next five countries combined.

And with exports accounting for only 12 per cent of GDP, the US economy is more resilient than most large economies because it’s less affected by cyclical downturns in its trading partners. By comparison, exports are 21 per cent of China’s GDP, 26 per cent of Australia’s and 51 per cent of Germany’s.

This is not to say the US doesn’t have its problems: it practices a brutal form of capitalism that results in a more limited social safety net, its health outcomes are an embarrassment, and its sclerotic, highly partisan political system is heavily influenced by wealthy lobby groups. Ironically, all of those problems are the result of prioritising making money.

World beating returns

It’s no coincidence that most of the best companies in the past 100 years came out of the US, culminating in today’s mega cap tech monsters.

If a smart investor had sunk $100,000 into the US’s S&P 500 index at the trough of the GFC in March 2009, and reinvested the dividends, it would have grown to be worth $946,000 by the end of 2023. The same investment in the ASX 200 would have been worth $524,000, even after including franking credits. That’s a difference of more than 80 per cent.

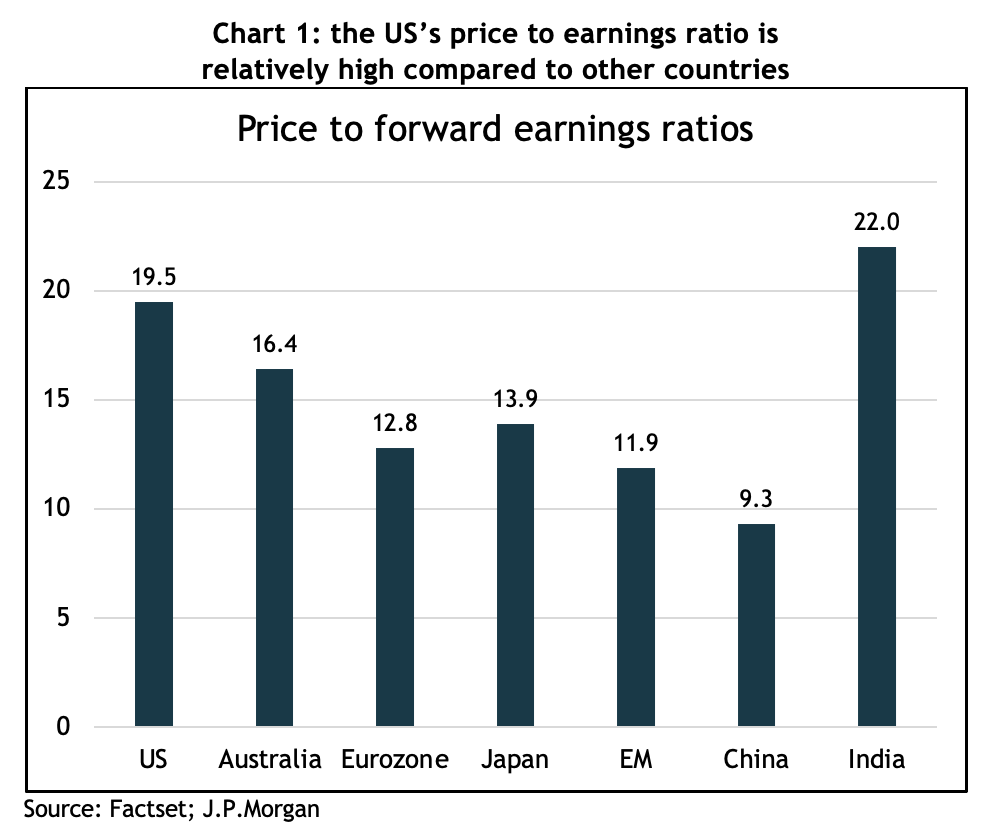
However, that incredible run has left the US share market looking expensive compared to the rest of the world. Using the most common valuation measure for shares, the price to earnings (PE) ratio, the S&P 500 trades at 19.5x 2024 forecast earnings, compared to Australia’s 16.4x, Europe’s 12.8x and the emerging markets’ 11.9x – see chart 1.

Chart showing bond yields trended down, resulting in a 40-year bull market, which went into reverse in mid-2020

Understandably, on that basis, almost every analyst and strategist recommends an underweight position in US shares.

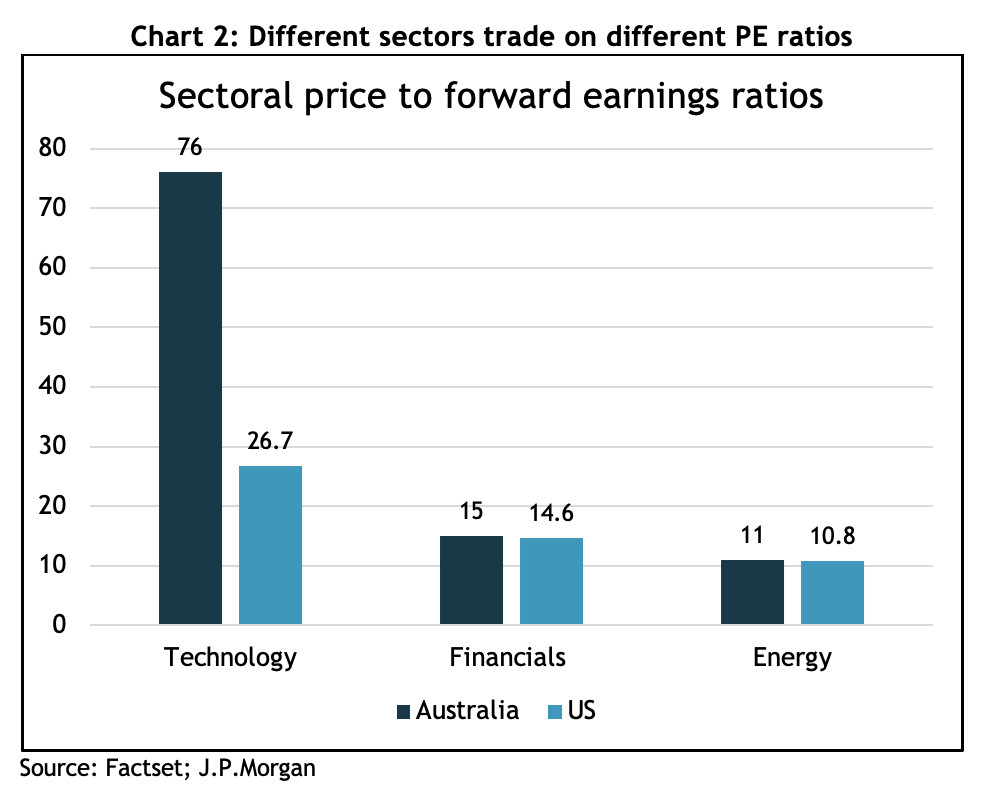
However, a simple comparison of PE ratios fails to account for the huge differences in the structure of the US market compared to others. For example, the tech sector has a 29 per cent weighting in the S&P 500, and is on a forward PE ratio of 31x, which looks very pricey, but the index has had compounded annual returns of more than 21 per cent for the past 10 years. The two biggest companies, Apple and Microsoft, have both returned 26 per cent for those 10 years, and the third biggest, Nvidia, an eye popping 63 per cent per year. It’s also worth noting that the technology index doesn’t include other mega caps such as Google, Amazon, Netflix or Meta.

Chart showing the Australian government bond, GSBG33, has experienced higher 
volatility than what many would associate with a defensive investment

By contrast, the biggest sector in the ASX 200 is the financials, at 27 per cent of the index. Its 10-year return has been 8 per cent per year, and it’s on a forward PE of 15x. So that’s 60 per cent lower returns but only a 50 per cent lower PE. If the Australian index had the same sector weightings as the S&P 500, its PE ratio would almost double.

Chart showing the Australian government bond, GSBG33, has experienced higher 
volatility than what many would associate with a defensive investment

J.P. Morgan also argues that because free cash flow margins are 30 per cent higher than they were only 10 years ago, a higher PE is justified, and fund manager, GMO, points out that since 1997, US profits, as measured by the average return on sales, have increased by 40 per cent.

It’s very difficult to mount a case that US shares are cheap, but it helps to have context around why they’ve enjoyed an outstanding 10 years of returns. There’s no way of telling if those returns will continue to be anywhere near as high over the next 10 years, but it’s hard to argue against American exceptionalism when it comes to making a buck.