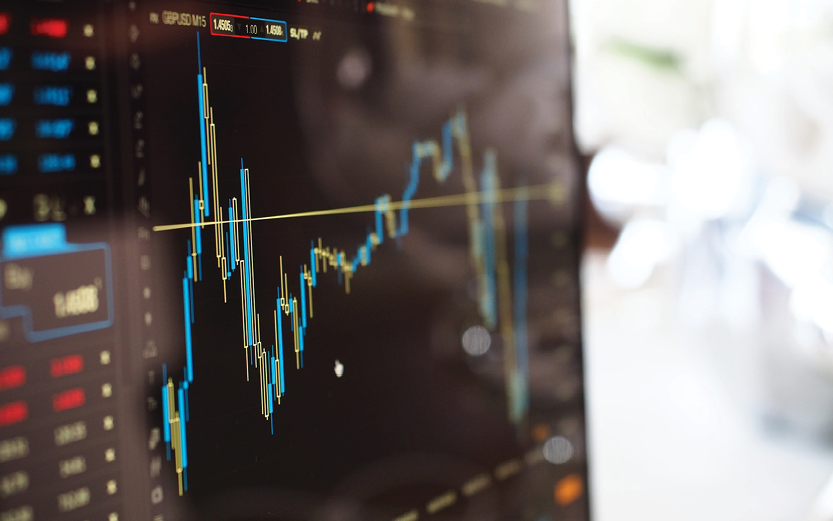
Analysts and fund managers have recently been lining up to explain why commodity markets are on the cusp of a potentially multi-year bull market. Rockstar analysts Jeff Currie, global head of commodities at Goldman Sachs, and Marko Kolanovic, macro strategist at JPMorgan, go so far as to describe it as the beginning of a ‘supercycle’.
In the last two commodities bull markets, which happened either side of the GFC, major global resources companies rose four to five-fold, far outstripping the broader share markets, though it should be remembered the fall in between was precipitous.
Analysts describe the conditions as being in place on both the demand and supply side across almost the whole commodities complex.
Multiple drivers of demand
In the near term, the almost explosive post-COVID recovery some economies are seeing, fuelled by massive government spending and access to cheap credit, has already seen commodity prices respond. Copper has doubled since its lows of March last year, and now trades at nine-year highs, iron ore has more than doubled and is at 10-year highs and, after falling spectacularly to below zero in 2020, oil is back above US$60 per barrel. The Bloomberg Commodities Index has risen 44% from its lows of 2020.
As well as expectations of an ongoing rise in commodities-intensive infrastructure spending and construction activity, Currie points out the inexorable shift toward green energy underpins huge increases in demand for energy related metals. Already, lithium, a foundation element of most modern batteries, has risen 45% since the start of this year, and cobalt is up 58%.
The European Commission has estimated its Green Deal will require more than €1 trillion (A$1.5 trillion) to be spent over the next decade, and both China and the new US administration have endorsed a move to being carbon neutral by mid-century. With the three largest economic blocs in the world moving in the same direction, the implications for commodities demand are enormous.
Supply will struggle
COVID has also impacted the supply side of the equation, with production out of South America, which accounts for one third of global copper and iron ore production, suffering significant falls. James Stewart, co-lead portfolio manager of the Ausbil Global Resources Fund, argues in addition there has been the typical underinvestment in bringing on new mine production that you see in the aftermath of a commodities boom.
“In 2012 total mining capex was about US$75 billion, and then it fell like a stone to hit US$20 billion in 2016. While it’s picked up since, in many areas the mining industry is nowhere near where it needs to be just to replace annual consumption, let alone expand production,” he said.
For example, copper requires around 300,000 tonnes of new production per year for supply to remain constant, which translates to around $10 billion of capex, and there are no new large mines slated to come into production for at least the next year.
Currie describes most commodities as facing structural deficits, and Stewart agrees, “The process of getting even a small mine up and running, from finding the resource, to defining reserves and then building the infrastructure, can easily take four or five years, and for a big mine it can be 10.”
Stewart’s fund has been investing heavily in mining companies that supply the battery industry, where Bloomberg forecasts demand for nickel and aluminium will rise 13-fold to 2030 and lithium carbonate by nine times.
Longview Economics argues commodities, relative to equities, are as cheap as they have been in more than 50 years, lower than before the start of previous supercycles in 1969, 1987 and 1998.
A hedge against inflation
A further argument in favour of investing in resources stocks is as a hedge against the frequently cited possibility of a rise in inflation, driven again by the sharp rise in post-COVID demand. Commodity prices tend to rise with inflation, driving earnings for mining companies, which could offset concerns about the effects of rising bond yields on a portfolio’s growth stocks.
It’s not often there is such strong consensus among analysts and fund managers. Obviously a smart investor should always consider the counterfactual, but the fundamentals of demand and supply are stacking up to suggest resources stocks could be entering a multi-year uptrend.
iversification has been called the last free lunch in investing. By spreading your exposure you reduce your risk – if one part of your portfolio is zigging hopefully another part will be zagging. But there’s a lot more to a diversified portfolio than just buying bank shares as well as resources.
We met with a new client recently who was confident his portfolio was diversified because he had a sizeable chunk invested in the big four Australian banks for good dividends, as well as the big resources companies if there was a growth cycle that lifts commodities prices, plus there were various other holdings. He also described himself as a conservative investor, because he didn’t trade very much.
In fact, his portfolio was far from conservative because he had very high concentration risk. For a start all his eggs were in the Australian equities basket. There is a natural bias to invest in your local share market, because it’s full of companies you’re familiar with, from supermarkets, to banks, to retailers and, hey, the Australian economy’s done super well not having experienced a recession for a record 25 years.
But there are several risks in this strategy. First, familiarity with a brand doesn’t mean you know how the underlying business is going. On the face of it a few years ago Woolworths seemed to be doing fine with the share price at an all time high, yet it dropped 45% over the next couple of years. Similarly with Telstra, whose brand has been ranked as the most valuable in Australia, has almost halved over the past couple of years.
Secondly, the Australian share market is not a good reflection of the domestic economy. The finance sector accounts for 35% of the share market but only around 10% of the economy. Likewise, resources are 18% of the ASX 200 but even at its peak in 2010 was only 8% of the economy.
Probably the most obvious argument to not be entirely invested in Australian equities is that the ASX 200 is about 2% of global market capitalisation and what drives our market can be entirely different to what drives overseas markets. For example, information technology companies make up 24% of the US’s S&P 500 index and have more than tripled over the past five years, whereas IT is 2% of the Australian market.
Chart 1 compares the performance of the big four Australian banks (including dividends and franking), the big two resources companies (ditto) and the MSCI All Country Index ex-Australia over the past five years, and shows how different sectors and markets can give very different returns over the same period. In fact, you can see the average return from the international markets was 2.5 times the resources and 50% more than the banks.
Chart 1: Australian banks and resources returns over 5 years vs MSCI All Countries ex-Australia
Chart 2 is another way of looking at the same thing and shows the returns you would have seen from investing $10,000 in Australian shares, compared with US and international shares, over the past five years to the end of 2017.
If you’re a brilliant stock picker then you should be able to do well whatever market you’re investing in, just look at Warren Buffett’s record. The unfortunate truth though is the 87-year-old Sage of Omaha has obsessed about investing since he was 10 years old. Realistically there are very few of us who are anywhere near good enough to make a living off share investing, let alone become a billionaire.
If you’re prepared to admit your fallibility, then the safest way to build in both protection and performance to a portfolio is through genuine diversification, across asset classes and geographies.
ere are gold bugs who would have you believe you are out of your mind if you don’t have a portion of your portfolio invested in gold at all times. I’m not one of them. But I do believe every investable asset has its day and there are good arguments to take out some portfolio insurance at the moment.
My long-term view of gold is more in the Buffet camp: it’s very pretty to look at but, like all commodities, it doesn’t pay you a dividend or yield. That leaves two obvious reasons to buy it: for a capital return or as a hedge or insurance policy.
Buying gold for a capital return
You would only buy gold for a capital return if you believe (a) it’s cheap and (b) the price is going to go up.
Is gold cheap?
This is a difficult question to answer because, like any commodity, it’s really hard to pin a valuation on gold. It doesn’t pay any dividend or interest so you can’t value it based on the present value of future cash flows. While gold has some limited industrial applications most of the demand comes from investment and jewelry, both of which are hard to forecast because sentiment plays a large part. And in terms of supply, theoretically, every ounce of gold that’s ever been plucked from the earth is still out there and there’s more being produced every year.
Many have tried to come up with models for valuing gold but at the end of the day they’re all based on comparing the current price to where it’s traded against different metrics in the past. To make those comparisons you can use what’s called fundamental analysis, which is measuring one metric against another, or technical analysis, which is using charts to gain an indication of where prices are going. Indeed, there are many good analysts who will only use a combination of the two.
Fundamental indicators
1. Gold vs. other forms of money
Gold is an internationally recognised store of value, that is, a kind of money. So it makes sense that you can analyze gold’s relationship to ‘fiat currencies’, which is the money issued by countries that they declare to be legal tender even though it’s not actually backed by anything tangible, just a promise that it will be honored.
Since 2001, the G-20’s monetary base has grown by 13% per annum, whereas the above ground supply of gold has only grown at 1.6% per annum – see chart 1.
Chart 1: Growth in the G-20 Monetary base (M0) dwarfs the growth in above ground gold supply
If the supply of paper money has grown eight times faster than the supply of gold, surely the price of gold denominated in that paper money should reflect that. Chart 2 shows this relationship has broken down and in fact gold is at historically undervalued levels relative to the monetary base.
Chart 2: Gold is historically undervalued relative to the G-20 monetary base (M0)
2. Gold vs. stocks
Another measure is comparing the value of shares to gold; since they are both real assets, it’s reasonable to argue that over time there should be an observable relationship in their relative value. The black line in chart 3 below (by Jesse Felder) simply divides the gold price by the S&P500 and is currently indicating that gold is cheap relative to stocks. (The gold line overlays a repeat of what happened between 2001-11 as a possible future path – with all respect to Mr Felder, you can ignore that line).
Chart 3: The gold price divided by the S&P500 indicates gold is currently good value on a relative basis
Chart 4 is a similar comparison, only this time looking at the value of commodities in general as represented by the Goldman Sachs Commodities Index compared with stocks, and once again, it indicates commodities are relatively cheap (it’s worth noting gold is the second most traded commodity behind oil). What’s also interesting is that peaks in the chart usually coincide with some kind of crisis.
Chart 4: The Goldman Sachs Commodities Index to S&P500 ratio also suggests commodities are cheap relative to stocks
3. Gold vs. stocks and bonds
Chart 5 compares the relative value of financial assets, as represented by US stocks and bonds, to real assets, in this case commodities, real estate and collectibles. What makes this analysis more interesting is the time frame: real assets are the cheapest they’ve been relative to financial assets stretching back more than 90 years.
Chart 5: Real asset values are at all-time lows compared with financial assets
Technical indicators
1. Downtrend broken
Gold recently broke through a downtrend that has been in place since it hit an all-time high of $1,922 an ounce in September 2011, as shown in chart 6.
Chart 6: Gold has broken its downtrend
For technical analysts this is a really big deal. Per stockcharts.com: “A break above the downtrend line indicates net supply is decreasing and a change of trend could be imminent.” An uptrend will be confirmed once gold trades above its previous high of $1,377 an ounce from last year – it’s currently at $1,315.
2. Resume long-term uptrend?
Finally, Ross Norman of Sharps Pixley bullion broking in London points out the gold price is arguably returning to a long-term trend line that had been established prior to the ‘melt up’ caused by the GFC – see chart 7.
Chart 7: gold may be returning to its long-term upward price trend
Will the gold price go up?
Of course nobody, but nobody, can give you a definitive answer to this question, but we can once again look at some indicators and evidence.
Demand
Annual total global gold demand is about 4,000 tonnes. About 70% of that is for jewelry, but the biggest swing factor is investment demand, which has been growing at 18% per annum since 2000.
As with so many things, China has had a huge influence on gold with demand growing at 14% per annum demand over the past 10 years – as shown in chart 8. It is estimated total Chinese gold holdings are just over 20,000 tonnes, of which 80% is in private hands.
Chart 8: Estimated total Chinese gold reserves
Interestingly, it appears Chinese demand shot up 56% over the year to July, with speculation that more investors are buying gold as a way of reducing their exposure to the Renminbi, which makes sense given the risks with the level of Chinese debt. That surge in demand has seen the premium Chinese investors are willing to pay over the market price for gold rise strongly late last year – see chart 9.
Chart 9: The premium over market prices Chinese investors are willing to pay to buy gold has risen sharply
Supply
The supply of gold is also tricky, since theoretically every ounce that’s ever been produced is still out there. While mine supply is fairly consistent at 2,500-3,000 tonnes per annum, the big swing factor is central banks, which have combined estimated holdings of more than 33,000 tonnes. So if the banks decide to sell the price would fall significantly, but since the GFC central banks have actually been strong net buyers of gold – see chart 10. In fact, emerging market central banks’ gold holdings have tripled in the last 10 years.
Chart 10: Central banks have been net buyers of gold since the GFC
Holding gold as a hedge
Another reason to buy gold is as a form of insurance for a portfolio. In the past gold has had a low correlation to financial assets, which means it tends to zig when shares and property zag. Chart 11 shows gold’s correlation to a bunch of asset classes ranges from about 0.3 to -0.17 (bearing in mind a correlation of 1 means it moves in perfect unison, and -1 in perfect opposite).
Chart 11: Gold has low correlation to almost all other asset classes
More importantly for investors who have a sizeable proportion of their portfolio exposed to shares, according to research done by the World Gold Council (the official cheerleader for the gold industry), gold is (slightly) positively correlated to a rising US stock market (when shares go up gold goes up but by less), but is negatively correlated to a falling stock market (when shares go down gold goes up) – see chart 12. Interestingly, other commodities usually fall when stocks fall, which supports the view that investors tend to buy gold as a safe haven.
Chart 12: Correlation of US stocks versus gold and commodities
Is there a need to hedge at the moment?
There are always people claiming the stock market is about to fall and vice versa. It’s the nature of financial markets that two people can look at the same thing and have completely different views. I am not saying I think markets are about to crash – I have absolutely no idea. What I am saying though, is there are reasonable arguments to suggest that taking out some protection might well be prudent if your portfolio can accommodate it.
The greatest concern for global share markets is the US, which has enjoyed a phenomenal rise since 2009, having gone up some 280% over 101 months, making it the second longest bull market in history (for context, the longest was a rise of 484% over 113 months between 1990-2000). Of itself, how much a market has risen and over how long has no bearing at all on whether or when it will fall. It rests entirely on questions of valuation and risks.
Positives
Very low (real) interest rates, which make shares look attractive.
We’ve never been in circumstances quite like this, so arguably we don’t really know what the ‘right’ valuations are. And while there is a disturbing buildup of corporate debt in China, elsewhere it is not as bad.
Earnings growth is reasonable.
Economic growth, while low compared with the 1990s, is still positive and Europe particularly is showing signs of recovery.
Negatives
The S&P500 ‘CAPE Shiller ratio’, which looks at valuations based on rolling 10 year earnings, is trading at its third highest point ever – see chart 13.
Chart 13: S&P500 CAPE Shiller ratio
The current Price to Earnings (PE) ratio for the S&P500 (based on 12 months trailing earnings) is also historically high at 24.4 times the last year’s earnings (versus the 100 year average of 15.7) – see chart 14.
Chart 14: S&P500 current PE ratio
In the five years to July 2017 US ‘adjusted’ earnings rose 12% yet the market has increased by 80%; the differential is due to the rising PE ratio, which is essentially a measure of sentiment (the counter argument to this is as above: what is the right PE when real interest rates are almost zero?).
Long-term US real GDP growth is close to 60 year lows – see chart 15.
Chart 15: US 10 year average real GDP growth is at 60 year lows
The total US stock market capitalization as a percentage of GDP, Warren Buffett’s favorite yardstick, recently hit an all-time high of 145.5, compared with an average of 60 between 1970-95 and 100 between 1995-2017 – see chart 16.
Chart 16: US stock market capitalization to GDP
Chart 17 shows the ‘breadth’ of the market’s rally is narrowing: in other words, there are fewer and fewer stocks still trading at elevated levels to hold the market up. This is a popular technical indicator for the stock market.
Chart 17: percentage of stocks trading above their 200 day moving average and S&P500
Volatility in the US, as measured by the ‘VIX’, is at an all-time low, while the PE is high, meaning the so-called ‘complacency index’ is as high as it’s ever been – see chart 18.
Chart 18: the US ‘complacency index’ is as high as it’s ever been
Credit markets are showing a disregard for risk as well: the difference in return between European High Yield bonds (the higher the yield the riskier the bond) and US government bonds is all but zero (that makes almost no sense) – see chart 19.
Chart 19: the spread between European High Yield bonds and US Treasuries is approaching zero
Can gold deliver a reasonable return?
Yes. Between 1968-1980 the gold price rose at 30% compound per annum! By comparison, the best 10 year period for US stocks was 19.5% from 1918, and for Australian stocks was about 23% from 1989.
Like everything though, timing has a lot to do with it. Since 1980 the returns from the Dow Jones Index were 17 times higher than that of gold, and if you had reinvested dividends it was 79 times! Then since 2000, gold has delivered an annualised return three times higher than US stocks and double London property (thanks to the GFC). But going from the peak of the gold price in 2011 to now, US stocks have returned 15.5% per annum with dividends reinvested and Australian stocks 10.7% while gold lost 6.1% per annum.
So, yes gold can deliver strong returns, but timing is important and trying to pick timing on any investment is notoriously difficult. The best you can do is weigh the evidence.
Conclusion
There are arguments to suggest that gold is relatively cheap compared with financial assets, that there are reasonable prospects for demand for gold to hold up, and that portfolios may benefit from taking out a bit of insurance, be it gold or something else. The key to remember is it’s never all or nothing: like any insurance, you never completely sell out of the asset you’re holding.
These days most parents worry about whether their kids spend too much time on screens. In this 60 Minutes (US) interview with former Google product manager, Tristan Harris, he reveals tech companies are deliberately aiming to capture your attention and not let it go.
It may come as no surprise that by using neuroscience to tap into the brain’s most basic drivers tech companies keep you staring at the screen for longer so they make more money. And it’s not just kids that are susceptible to these tricks, which are called “brain hacking”.
It’s a relatively brief interview and (being 60 Minutes) focuses on the more dramatic aspects rather than building a solid case based on research and facts, nor does it offer any solutions. Nevertheless it is thought provoking. (You can watch the video of it here.)
What is “brain hacking”?
Tech insiders on why you should care
Silicon Valley is engineering your phone, apps and social media to get you hooked, says a former Google product manager. Anderson Cooper reports
The following script is from “Brain Hacking,” which aired on April 9, 2017. Anderson Cooper is the correspondent. Guy Campanile, producer.
Have you ever wondered if all those people you see staring intently at their smartphones — nearly everywhere, and at all times — are addicted to them? According to a former Google product manager you are about to hear from, Silicon Valley is engineering your phone, apps and social media to get you hooked. He is one of the few tech insiders to publicly acknowledge that the companies responsible for programming your phones are working hard to get you and your family to feel the need to check in constantly. Some programmers call it “brain hacking” and the tech world would probably prefer you didn’t hear about it. But Tristan Harris openly questions the long-term consequences of it all and we think it’s worth putting down your phone to listen.
Tristan Harris, a former Google product manager
Tristan Harris: This thing is a slot machine.
Anderson Cooper: How is that a slot machine?
Tristan Harris: Well every time I check my phone, I’m playing the slot machine to see, “What did I get?” This is one way to hijack people’s minds and create a habit, to form a habit. What you do is you make it so when someone pulls a lever, sometimes they get a reward, an exciting reward. And it turns out that this design technique can be embedded inside of all these products.
The rewards Harris is talking about are a big part of what makes smartphones so appealing. The chance of getting likes on Facebook and Instagram. Cute emojis in text messages. And new followers on Twitter.
Tristan Harris: There’s a whole playbook of techniques that get used to get you using the product for as long as possible.
Anderson Cooper: What kind of techniques are used?
“…every time I check my phone, I’m playing the slot machine to see, ‘What did I get?’ This is one way to hijack people’s minds and create a habit, to form a habit.” Tristan Harris
Tristan Harris: So Snapchat’s the most popular messaging service for teenagers. And they invented this feature called “streaks,” which shows the number of days in a row that you’ve sent a message back and forth with someone. So now you could say, “Well, what’s the big deal here?” Well, the problem is that kids feel like, “Well, now I don’t want to lose my streak.” But it turns out that kids actually when they go on vacation are so stressed about their streak that they actually give their password to, like, five other kids to keep their streaks going on their behalf. And so you could ask when these features are being designed, are they designed to most help people live their life? Or are they being designed because they’re best at hooking people into using the product?
Anderson Cooper: Is Silicon Valley programming apps or are they programming people?
Tristan Harris: Inadvertently, whether they want to or not, they are shaping the thoughts and feelings and actions of people. They are programming people. There’s always this narrative that technology’s neutral. And it’s up to us to choose how we use it. This is just not true.
Anderson Cooper: Technology’s not neutral?
Tristan Harris: It’s not neutral. They want you to use it in particular ways and for long periods of time. Because that’s how they make their money.
It’s rare for a tech insider to be so blunt, but Tristan Harris believes someone needs to be. A few years ago he was living the Silicon Valley dream. He dropped out of a master’s program at Stanford University to start a software company. Four years later Google bought him out and hired him as a product manager. It was while working there he started to feel overwhelmed.
Tristan Harris: Honestly, I was just bombarded in email and calendar invitations and just the overload of what it’s like to work at a place like Google. And I was asking, “When is all of this adding up to, like, an actual benefit to my life?” And I ended up making this presentation. It was kind of a manifesto. And it basically said, you know, “Look, never before in history have a handful of people at a handful of technology companies shaped how a billion people think and feel every day with the choices they make about these screens.”
“Inadvertently, whether they want to or not, they are shaping the thoughts and feelings and actions of people. They are programming people.” Tristan Harris
His 144-page presentation argued that the constant distractions of apps and emails are “weakening our relationships to each other,” and “destroying our kids ability to focus.” It was widely read inside Google, and caught the eye of one of the founders Larry Page. But Harris told us it didn’t lead to any changes and after three years he quit.
Tristan Harris: And it’s not because anyone is evil or has bad intentions. It’s because the game is getting attention at all costs. And the problem is it becomes this race to the bottom of the brainstem, where if I go lower on the brainstem to get you, you know, using my product, I win. But it doesn’t end up in the world we want to live in. We don’t end up feeling good about how we’re using all this stuff.
Anderson Cooper: You call this a “race to the bottom of the brain stem.” It’s a race to the most primitive emotions we have? Fear, anxiety, loneliness, all these things?
Tristan Harris: Absolutely. And that’s again because in the race for attention I have to do whatever works.
Tristan Harris: It absolutely wants one thing, which is your attention.
Now he travels the country trying to convince programmers and anyone else who will listen that the business model of tech companies needs to change. He wants products designed to make the best use of our time not just grab our attention.
Anderson Cooper: Do you think parents understand the complexities of what their kids are dealing with, when they’re dealing with their phone, dealing with apps and social media?
Tristan Harris: No. And I think this is really important. Because there’s a narrative that, “Oh, I guess they’re just doing this like we used to gossip on the phone, but what this misses is that your telephone in the 1970s didn’t have a thousand engineers on the other side of the telephone who were redesigning it to work with other telephones and then updating the way your telephone worked every day to be more and more persuasive. That was not true in the 1970s.
Anderson Cooper: How many Silicon Valley insiders are there speaking out like you are?
Tristan Harris: Not that many.
We reached out to the biggest tech firms but none would speak on the record and some didn’t even return our phone call. Most tech companies say their priority is improving user experience, something they call “engagement.” But they remain secretive about what they do to keep people glued to their screens. So we went to Venice, California, where the body builders on the beach are being muscled out by small companies that specialize in what Ramsay Brown calls “brain hacking.”
Anderson Cooper speaks with Ramsay Brown, the cofounder of Dopamine Labs
Ramsay Brown: A computer programmer who now understands how the brain works knows how to write code that will get the brain to do certain things.
Ramsay Brown studied neuroscience before co-founding Dopamine Labs, a start-up crammed into a garage. The company is named after the dopamine molecule in our brains that aids in the creation of desire and pleasure. Brown and his colleagues write computer code for apps used by fitness companies and financial firms. The programs are designed to provoke a neurological response.
“A computer programmer who now understands how the brain works knows how to write code that will get the brain to do certain things.” Ramsay Brown
Anderson Cooper: You’re trying to figure out how to get people coming back to use the screen?
Ramsay Brown: When should I make you feel a little extra awesome to get you to come back into the app longer?
Ramsay Brown
The computer code he creates finds the best moment to give you one of those rewards, which have no actual value, but Brown says trigger your brain to make you want more. For example, on Instagram, he told us sometimes those likes come in a sudden rush.
Ramsay Brown: They’re holding some of them back for you to let you know later in a big burst. Like, hey, here’s the 30 likes we didn’t mention from a little while ago. Why that moment–
Anderson Cooper: So all of a sudden you get a big burst of likes?
Ramsay Brown: Yeah, but why that moment? There’s some algorithm somewhere that predicted, hey, for this user right now who is experimental subject 79B3 in experiment 231, we think we can see an improvement in his behavior if you give it to him in this burst instead of that burst.
When Brown says “experiments,” he’s talking generally about the millions of computer calculations being used every moment by his company and others use to constantly tweak your online experience and make you come back for more.
Ramsay Brown: You’re part of a controlled set of experiments that are happening in real time across you and millions of other people.
Anderson Cooper: We’re guinea pigs?
Ramsay Brown: You’re guinea pigs. You are guinea pigs in the box pushing the button and sometimes getting the likes. And they’re doing this to keep you in there.
The longer we look at our screens, the more data companies collect about us, and the more ads we see. Ad spending on social media has doubled in just two years to more than $31 billion.
Ramsay Brown: You don’t pay for Facebook. Advertisers pay for Facebook. You get to use it for free because your eyeballs are what’s being sold there.
Anderson Cooper: That’s an interesting way to look at it, that you’re not the customer for Facebook.
“You don’t pay for Facebook. Advertisers pay for Facebook. You get to use it for free because your eyeballs are what’s being sold there.” Ramsay Brown
Ramsay Brown: You’re not the customer. You don’t sign a check to Facebook. But Coca-Cola does.
Brown says there’s a reason texts and Facebook use a continuous scroll, because it’s a proven way to keep you searching longer.
Ramsay Brown: You spend half your time on Facebook just scrolling to find one good piece worth looking at. It’s happening because they are engineered to become addictive.
Anderson Cooper: You’re almost saying it like there’s an addiction code.
Ramsay Brown: Yeah, that is the case. That since we’ve figured out, to some extent, how these pieces of the brain that handle addiction are working, people have figured out how to juice them further and how to bake that information into apps.
Larry Rosen: Dinner table could be a technology-free zone.
While Brown is tapping into the power of dopamine, psychologist Larry Rosen and his team at California State University Dominguez Hills are researching the effect technology has on our anxiety levels.
Larry Rosen: We’re looking at the impact of technology through the brain.
Rosen told us when you put your phone down – your brain signals your adrenal gland to produce a burst of a hormone called, cortisol, which has an evolutionary purpose. Cortisol triggers a fight-or-flight response to danger.
Anderson Cooper: How does cortisol relate to a mobile device, a phone?
Larry Rosen: What we find is the typical person checks their phone every 15 minutes or less and half of the time they check their phone there is no alert, no notification. It’s coming from inside their head telling them, “Gee, I haven’t checked in Facebook in a while. I haven’t checked on this Twitter feed for a while. I wonder if somebody commented on my Instagram post.” That then generates cortisol and it starts to make you anxious. And eventually your goal is to get rid of that anxiety so you check in.
So the same hormone that made primitive man anxious and hyperaware of his surroundings to keep him from being eaten by lions is today compelling Rosen’s students and all of us to continually peek at our phones to relieve our anxiety.
Larry Rosen: When you put the phone down you don’t shut off your brain, you just put the phone down.
Anderson Cooper: Can I be honest with you right now? I haven’t paid attention to what you’re saying because I just realized my phone is right down by my right foot and I haven’t checked it in, like 10 minutes.
Larry Rosen: And it makes you anxious.
Anderson Cooper: I’m a little anxious.
A computer tracks minute changes in Anderson Cooper’s heart rate and perspiration
Larry Rosen: Yes.
We found out just how anxious in this experiment conducted by Rosen’s research colleague Nancy Cheever.
Nancy Cheever: So the first thing I’m going to do is apply these electrodes to your fingers.
While I watched a video, a computer tracked minute changes in my heart rate and perspiration. What I didn’t know was that Cheever was sending text messages to my phone which was just out of reach. Every time my text notification went off, the blue line spiked – indicating anxiety caused in part by the release of cortisol.
Nancy Cheever: Oh, that one is…that’s a huge spike right there. And if you can imagine what that’s doing to your body. Every time you get a text message you probably can’t even feel it right? Because it’s such a um, it’s a small amount of arousal.
Anderson Cooper: That’s fascinating.
Their research suggests our phones are keeping us in a continual state of anxiety in which the only antidote – is the phone.
Anderson Cooper: Is it known what the impact of all this technology use is?
Larry Rosen: Absolutely not.
Anderson Cooper: It’s too soon.
Larry Rosen: We’re all part of this big experiment.
Anderson Cooper: What is this doing to a young mind or a teenager?
Larry Rosen: Well there’s some projects going on where they’re actually scanning teenager’s brains over a 20-year period and looking to see what kind of changes they’re finding.
Gabe Zichermann
Gabe Zichermann: Here’s the reality. Corporations and creators of content have, since the beginning of time, wanted to make their content as engaging as possible.
Gabe Zichermann has worked with dozens of companies – including Apple and CBS – to make their online products more irresistible. He’s best known in Silicon Valley for his expertise in something called “gamification,” using techniques from video games to insert fun and competition into almost everything on your smartphone.
Gabe Zichermann: So one of the interesting things about gamification and other engaging technologies, is at the same time as we can argue that the neuroscience is being used to create dependent behavior those same techniques are being used to get people to work out, you know, using their Fitbit. So all of these technologies, all the techniques for engagement can be used for good, or can be used for bad.
“Asking technology companies, asking content creators to be less good at what they do feels like a ridiculous ask.” Gabe Zichermann
Zichermann is now working on software called ‘Onward’ designed to break user’s bad habits. It will track a person’s activity and can recommend they do something else when they’re spending too much time online.
Gabe Zichermann: I think creators have to be liberated to make their content as good as possible.
Anderson Cooper: The idea that a tech company is not going to try to make their product as persuasive, as engaging as possible, you’re just saying that’s not gonna happen?
Gabe Zichermann: Asking technology companies, asking content creators to be less good at what they do feels like a ridiculous ask. It feels impossible. And also it’s very anti-capitalistic, this isn’t the system that we live in.
Ramsay Brown and his garage start-up Dopamine Labs made a habit-breaking app as well. It’s called “Space” and it creates a 12-second delay — what Brown calls a “moment of Zen” before any social media app launches. In January, he tried to convince Apple to sell it in their App Store.
Ramsay Brown: And they rejected it from the App Store because they told us any app that would encourage people to use other apps or their iPhone less was unacceptable for distribution in the App Store.
Anderson Cooper: They actually said that to you?
Ramsay Brown: They said that to us. They did not want us to give out this thing that was gonna make people less stuck on their phones.
This YouTube clip of a fascinating presentation by academic and energy entrepreneur Tony Seba called “Clean disruption – why energy & transportation will be obsolete by 2030”, is an engaging and thought provoking glimpse into the not very distant future of battery storage and autonomous vehicles that will almost certainly be genuinely disruptive and therefor transformative for our day to day lives.
Saba references the well-known Moores Law to put forward a case that ongoing technological improvements will see energy costs converge towards zero – music to the ears of battered Australian power consumers. In a cost reduction battle between technology (renewable energy sources, particularly solar PV and battery storage) and commodities, it’s blindingly obvious who’s going to win.
He also dissects the arguments about electric and autonomous vehicles to analyse if they can be considered truly disruptive. With the costs of EV production falling in line with the costs of energy storage, plus the almost zero marginal costs that come from running a car with 18 moving parts vs. more than 2,000, he sees a one way battle. And autonomous cars will liberate people from owning an asset that typically has more than 90% downtime, saving an estimated $11,000 a year. Altogether disruptive enough that he forecasts all new cars will be electric by 2025.
We’ve written recently that US share markets have been remarkably un-volatile, which is normally interpreted as investors feeling perhaps a bit too comfortable. This has been confirmed by the Wall Street Journal which writes that the average daily move on the Dow Jones index over the past quarter was the lowest in 55 years, at 0.3185%, and for the S&P500 it was the lowest in 50 years, at 0.3172%.
Investors also seem to think the outlook for volatility is low as well, given the VIX index, which attempts to measure the expectations of future turbulence, has posted its second lowest quarterly average ever – see the chart below.
As we’ve written before, periods of complacency inevitably end with a break out of volatility. The unfortunate thing is, nobody can tell you when.


 dwarfs the growth in above ground gold supply")
")