
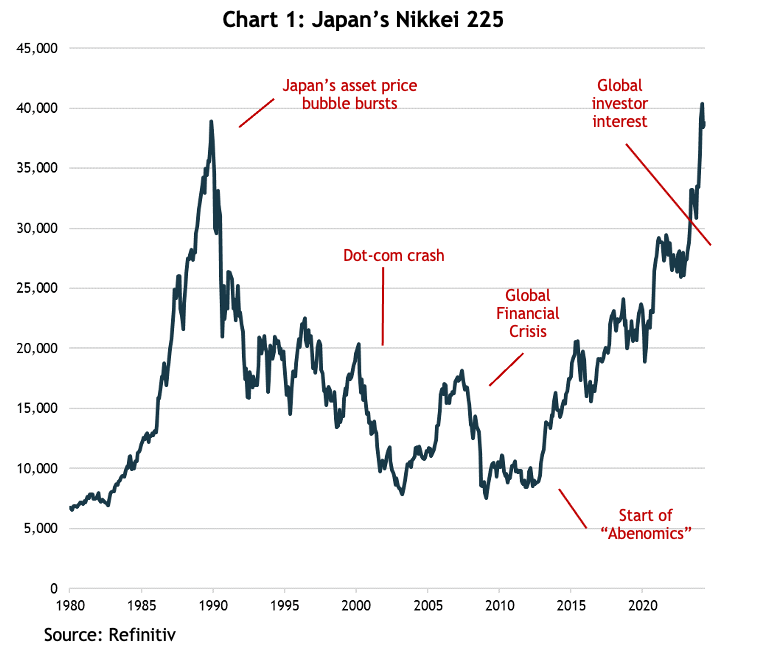
The Japanese stock market holds the ignominious title of having played host to the biggest stock market bubble in history.
Over the four years leading to its peak on the last trading day of 1989, the Nikkei 225 rose by more than 30% per year, by which point it accounted for 37% of global stock market capitalization (the US was 29%), it was trading at 60x the previous 12 months’ earnings and hit a price to book value ratio of more than 8x.
Not surprisingly, the bubble reached into all aspects of the economy, especially the property market. After the big pop, Japan slumped into such a prolonged period of economic stagnation the following 20 years are referred to as the Lost Decades.
It took 34 years for the Japanese share market to hit a new all-time high, which happened in February this year, and it’s now 5.5% of the MSCI All Country World Index (which is still the second biggest but compares to the US at 62%), with a PE ratio of 15x and almost half the index trades at less than 1x book value.
The rise and rise of the Nikkei
In December 2012, Shinzo Abe was appointed as Prime Minister of Japan and introduced the “Abenomics” stimulus program designed to reignite the moribund economy. Whilst we can’t be sure the amazing share market returns since then are entirely due to those economic policies, you’d have to think they played a part.
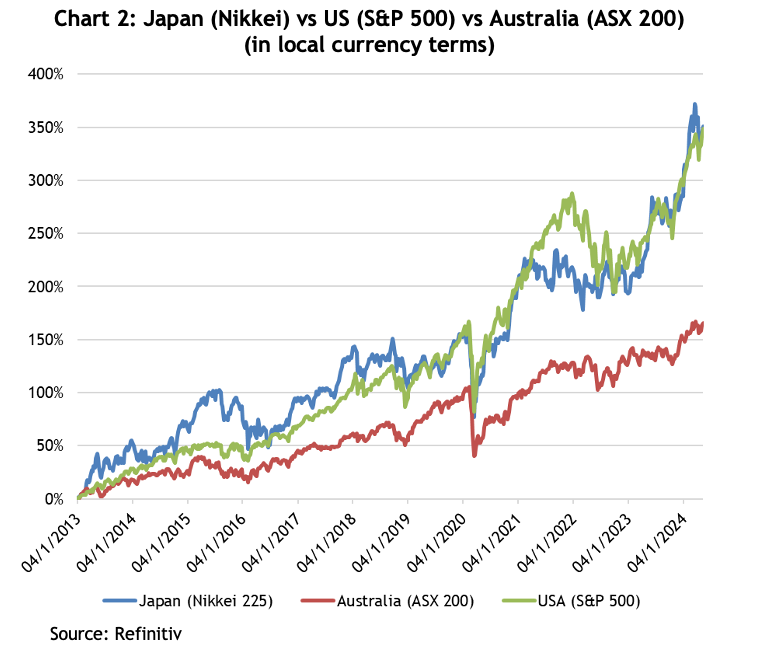
Given the incredible rise of the US share market in the post-GFC period, you’d have thought it had wiped the floor with all comers, but astonishingly, since the start of 2013, the Nikkei and the S&P 500 have increased by the same amount: 350% – see chart 2.
So why haven’t we heard more about Japan over the past 10-plus years? One reason is because we keep hearing about an economy that has struggled to generate positive real economic growth, a population that is in long-term decline and a government balance sheet whose debt is multiples of its GDP. Hardly inspiring stuff.
A second reason is that over that period since 2013 the yen has steadily weakened against the USD, so for US investors returns from the Nikkei were more than 40% less than what they got from the S&P 500. Unfortunately, that doesn’t excuse Australian investors, for whom AUD returns would still have been 80% higher than the ASX 200 over those 11 years (a total return of 300% vs 166%).
Hang on, where’s the AI?
Chart 2 shows the Nikkei has risen sharply since the start of 2023, as has the US. We all know about the US’s rally being powered by AI and the mega cap tech companies, but Japan doesn’t boast any household tech names. So what’s powered the Nikkei?
What we’re seeing is the culmination of more than 10 years of corporate reform, kicked off as part of Abenomics, which dragged what had been hidebound, stodgy Japanese companies into the modern era of disclosure and governance. That such sweeping structural reforms have been achieved is also indicative of Japan’s culture that emphasises the collective good, with the government’s Ministry of Economy, Trade and Industry working in conjunction with the Tokyo Stock Exchange (TSE) and the Keidanren (the Japan Business Federation).
Companies have been required to calculate the cost of capital and explain why returns failed to meet that cost; they’ve been urged to unwind complex cross shareholdings built up over decades; and the number of companies with at least 30% independent directors has increased from just 6% in 2014 to 97% in 2023.
The TSE emphasised the importance of companies improving returns and encouraging a more open dialogue with shareholders to improve governance, return on equity and valuations. In March last year, it announced they would be publishing a monthly list of those firms that have published written guidance on how they planned to improve their share prices, and by February this year, a staggering 54% of companies had complied or are actively considering it. Notably, the shares of companies that have published guidance have outperformed those that have not by more than 16% over that period.
The impact on overall returns has been extraordinary. Since the inception of Abenomics, earnings per share for listed Japanese companies has tripled, and return on equity has gone from negative levels in 2010 to 9% as of March 2024 – which is still half the US’s.
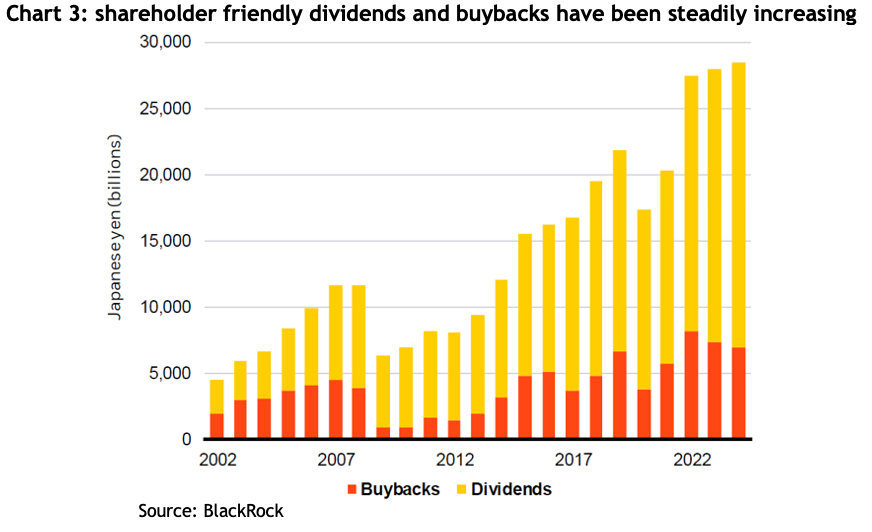
In the past, Japanese companies were notorious for sitting on piles of cash, burned by the experience of banks pulling loans in the aftermath of the asset bubble. Part of the reform has been encouraging the payment of dividends, and last year the yield hit almost 4%. In the most recent earnings reporting season, 53% of companies announced they plan to increase dividends this year, which is more than double what it was in 2012.
Part of the TSE’s push was to get companies to formulate a plan to get their shares trading at least at book value (that is, the market capitalization to be at least equal to the value of the company’s assets). When Abenomics started, 74% of listed Japanese companies were trading below book value, and by the end of 2023 that number was less 45% (compared to 4% on the S&P 500), and by February this year it was down to 33%. The current price to book multiple for the for the broader Topix index is still relatively cheap at 1.4x, which compares to the US’s 4.4x (very high due to the relatively low portion of tangible assets the megacap tech companies have) and Europe’s 2.1x.
When a company’s shares are trading on a low price to book valuation it makes sense for them to buy back their own shares. From 2017 to 2023 total share buybacks quadrupled to 4.15 trillion yen and are set to hit another record in 2024.
Can it keep going?
Japan’s clearly enjoyed a fabulous run over the past 10+ years, are there reasons to think it could keep going? At the moment, it’s actually more of a challenge to find a strategist who’s bearish. One reassuring thing is there’s a variety of reasons put forward to remain bullish about the market.
Inflation
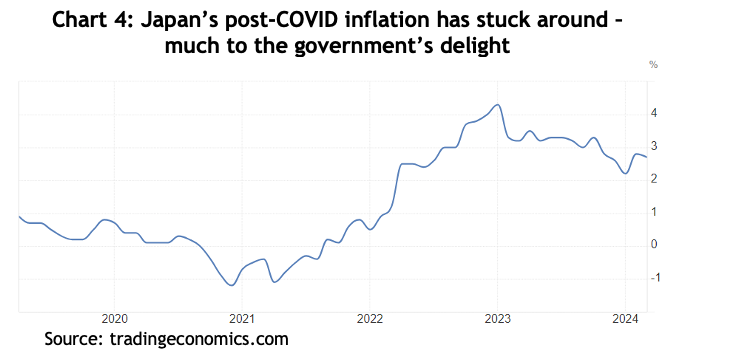
At long last, the Japanese economy appears to be showing signs of life. The government and central bank have been trying to generate positive inflation for years, running the world’s first QE program, maintaining zero bond yields and negative cash rates, but the CPI has averaged 0.5% for the past 20 years. However, the worldwide outbreak of inflation since COVID saw inflation peak above 4% and it’s proving at least a bit sticky, with the latest reading coming in at 2.7%.
That glimmer of inflationary hope enabled the Bank of Japan to raise interest rates in February this year for the first time in 17 years, taking the key rate from -0.1% all the way to 0%.
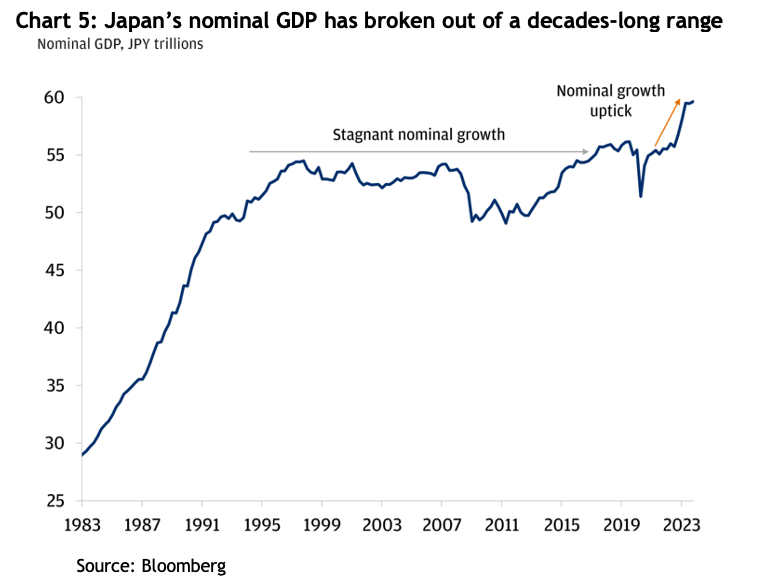
Nominal GDP growth
It seems the return of inflation has pushed Japan’s nominal GDP (that is, before accounting for inflation) into a new all-time high, which, if nothing else, may help confidence in the economy – see chart 5.
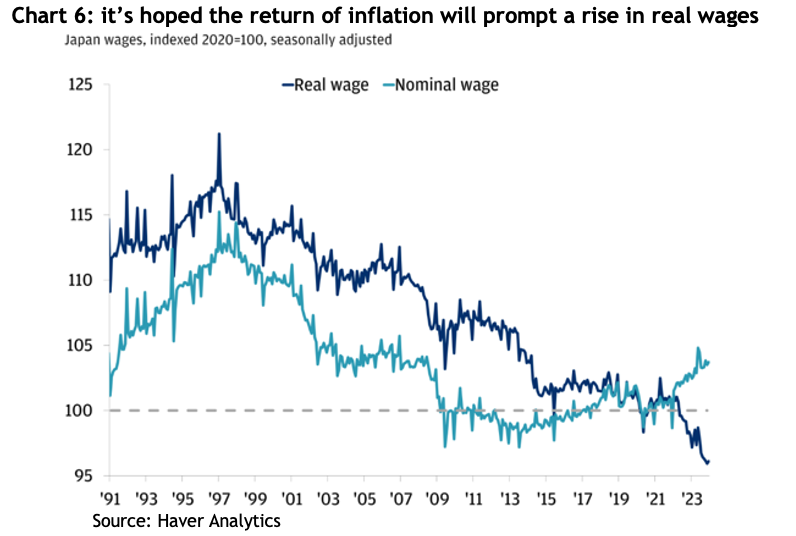
Wages
Economists are hoping the return of inflation may prompt an increase in real wages, which have been declining since 1996 – see chart 6. They figure if that happens consumers may spend a bit more.
The Return of Mrs Watanabe
Mrs Watanabe was a term coined some 20 years to describe enthusiastic Japanese retail investors, more specifically in the currency markets. The government is trying to encourage their return.
The Nippon Individual Savings Account (NISA) is a program introduced by the Japanese government to encourage households to invest through an account that can hold domestic and foreign securities, ETFs, REITs and mutual funds. In January 2024 the government gave the program a major overhaul by doubling the annual limit people could invest to 2.4 million yen (about AUD23,000) per year and making the investments totally tax-free.
Apparently the combination of resurgent inflation, tax-free investment incentives and the rising share market has nudged Japanese households back to the share market. In 2023, more than half of the 2.1 quadrillion yen (about AUD2 trillion) of Japan’s household assets were held in cash and deposits, and while shares have risen by more than 50% as a proportion over just a few years, they are still only 18%, compared to 51% in the US.
The revamped NISA and a strong share market saw the total traded value on the TSE hit 60 trillion yen (about AUD55 billion) in a single week of February this year, which is more than twice what it averaged between 2015-2020.
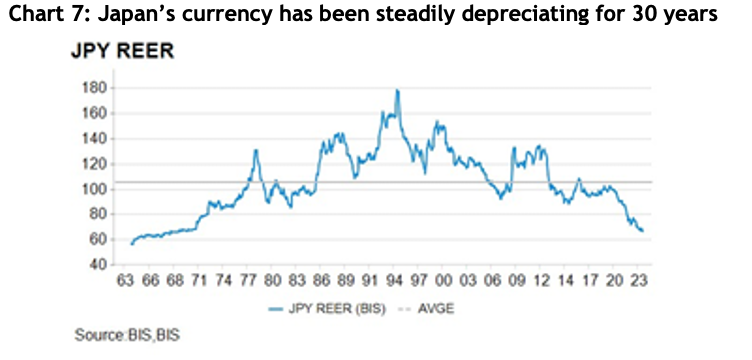
Currency: tailwind or headwind?
The yen has been on a steady decline against most major currencies for decades, mostly because of the zero-interest rate policy causing a huge differential, especially over the course of the current global interest rate cycle. The upshot is the real effective exchange rate for the yen, which is an index that measures the strength of a currency relative to a basket of other currencies and adjusted for inflation, is at levels last seen 50 years ago – see chart 7.
A weak currency is terrific for a country that exports a lot of products, as Japan does, because it makes those exports cheaper for the buyers. However, it also makes imported goods more expensive, and Japan imports almost all its energy and much of its food, so there is concern the sticky inflation they’re experiencing now could get out of hand.
For Australian investors, the relative strength of the AUD against the yen at the moment presents a potential opportunity. Chart 8 shows the AUD is at the top of the past 10 years’ trading range, with a current value of 104 yen to one AUD, whereas the average over those 10 years is 85.
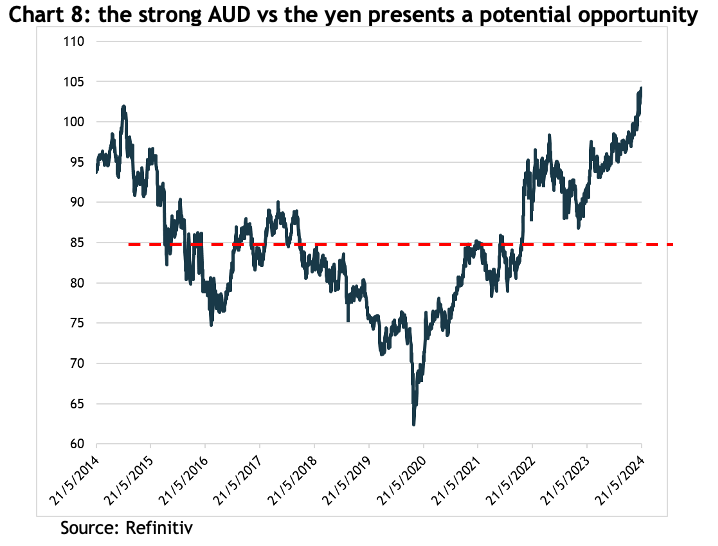
If you were to buy the Japanese index and it did absolutely nothing for two years, but over that time the currency returned to its long-term average, you would make 18% just on the currency.
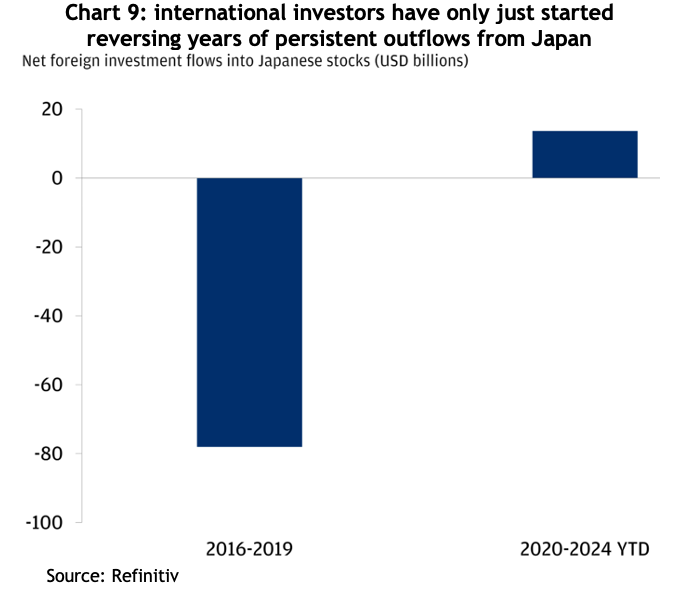
The big rediscovery
Japan has had the second largest stock market in the world for decades, but international investors steadily pulled their money out for years. Chart 9 shows the strong returns posted over the past 10 years have finally reversed that outflow. Who knows, with so many bullish reports on Japan, it’s possible that inflow of money is very much in its early days.
Conclusion
The reasons for Japan’s strong share market returns over the past 12 years appear to be structural, thanks to coordinated efforts between the government, the stock exchange and companies themselves. What’s more, those structural changes appear to have at least a bit more to run.
Forecast earnings growth for Japanese companies in 2024 is 13% (compared to -6% for Australia) and 9% for 2025 (vs 4%), though they are renowned for being conservative with their guidance, preferring to under-promise and over-deliver.
The broader TOPIX index is on a forward PE ratio of 15.2x with a forecast yield of 2.1%, compared to the ASX 200 with a forward PE of 17.1x. Whilst Australia’s yield is a world leading 5%, the forecast fundamental total return (EPS growth + dividends), is -1% vs 15.1%.