Last week I was at a conference about alternative investments, and I cannot tell you how many people I spoke to who had decided the US share market is nuts.
They were piling all kinds of arguments behind that view:
- The S&P 500 has jumped 24% in just four months, but without the top tech stocks that return would be closer to 8%
- Nvidia alone has gone up 95% over the same time, but it’s risen 420% since Chat GPT was announced in November 2022
- Market concentration has never been greater with the MegaCap 8 stocks (Apple, Amazon, Alphabet, Meta, Microsoft, Netflix, Nvidia and Tesla) now accounting for 28% of the S&P 500
- The MegaCap 8’s combined market cap would make it the second largest country stock exchange in the world
- The S&P 500’s PE ratio is 28x, compared to a 30-year average of 17x
- The Goldilocks US economy could crack any moment
Without digging any deeper, that’s a bunch of statistics that would be enough to have anyone wondering if the market’s gone a little mad.
So, let’s dig a little deeper.
Bears always sound smarter
First, before you go believing the people arguing everything’s turning to custard, just remember, the lizard part of your brain that’s hard wired to make sure you survived the thrills and spills of the savannah biases you to thinking what those people are saying is smarter and more trustworthy. It’s the survival instinct, designed to make us think twice and stop us from being reckless.
Then there’s what behavioural economists call second level thinking, where you take a breath and think for a moment, that can prevent you from just swallowing what people say without giving it some thought.
It’s the fundamentals
There have been lots of calls that the current AI boom is reminiscent of the dotcom bubble that popped in 2000, and it took the S&P 500 seven years to get back to that level.
But is it? The dotcom bubble was largely hypes and dreams, with almost no actual earnings to back it all up.
Compare that to Nvidia, which recently reported its fourth quarter results that smashed analysts’ forecasts:
- Revenue up 265.3% to US$22.1 billion, 8.2% ahead of consensus
- Data centre revenue up 408.8% to US$18.4 billion, 6.9% ahead of consensus
- Gross margin up 1,064 bps to 76.7%, 128 bps ahead of consensus
- Earnings per share up 486.4% to $5.16, 3.6% ahead of consensus
From the start of 2022 to 21 February this year, Nvidia’s earnings have grown 231%, but the stock price had risen only 130%, because the PE multiple, which is a measure of how much sentiment is driving the share price, actually detracted by 102%. In other words, there’s less hype in the share price over that time.
AI has certainly captured the market’s imagination, but it’s no fairytale, there’s real money behind it. Of course, we don’t know if the earnings and revenue growth are going to keep going, but check chart 1: spending by US companies on computers and electronic stuff had already got a big boost from Biden’s CHIPS Act and the Inflation Reduction Act, both passed in August 2022. But you can see the huge jump after Chat GPT was launched in November 2022 – US companies are clearly spending up in a race to incorporate AI into their businesses.

Anyone who’s witnessed the magic of AI through Chat GPT or Google’s Gemini has to admit it’s a mind-bending experience, and those consumer-oriented models are the proverbial tip of the iceberg. There’s a website called Hugging Face, which calls itself “The AI community building the future” that has more than 520,000 AI models available.
AI is definitely here to stay. It’s definitely going to have far reaching impacts. And it’s only going to get bigger and better (and possibly scarier).
Market concentration ain’t all it’s cracked up to be
There’s been a lot of talk about the fact that the top 10 stocks in the S&P 500 have never represented such a high proportion of the overall index, usually followed by dark warnings about concentration risk.
Here’s a bit of context: the top 10 stocks in the US account for 34% of the S&P 500; in Australia, it’s 47% of the ASX 200; in the UK it’s 49%; Germany and France it’s 58% and in Italy it’s 66%.
In other words, it’s not a big deal. Yes, if the bigger companies fall hard it will impact the index by more, but clearly that’s not unique to the US.
There are two other important indicators for the broader US market. First, the industrials index, which represents old fashioned companies that manufacture stuff, has hit an all-time high, and the S&P 500 equal weighted index, which ignores market caps so all companies carry the same weight and influence (so it neutralises the MegaCap 8), is also close to an all-time high. They are both indicators telling us the rally is gradually becoming broad based.
How representative is the PE ratio?
Yardeni Research says the S&P 500’s PE ratio for the next 12 months was 20.4x on 15 February. For the MegaCap 8 it was 28.0x and for the other 492 stocks in the index it was 18.2x – see chart 2.

First, I wrote an article for the AFR about this a few weeks ago, explaining how the US index has a much higher proportion of high growth tech companies than any other index in the world, so comparing the PE for the US to, say, Australia, where more than half our market is taken up by low growth banks and resources companies, is like comparing the proverbial apples and oranges.
For a bit more context, a company’s PE ratio is determined by a combination of how much the earnings are expected to grow and how positive or negative sentiment toward the company is. Forecasting earnings growth is hard enough, but forecasting sentiment is, well, impossible.
Suffice to say though, Yardeni reckons the 3-5 year earnings growth for the MegaCap 8 is forecast to be 38.9%. That’s really high, and if they can pull it off (admittedly a big if), maybe a 28x PE ain’t so bad after all.
The second part to this argument is that paying 18x for the rest of the US market might not be so bad either. It’s a smidge over the 20-year average PE of 17x, but, again, the US index has changed enormously over those 20 years. In 2003 financials was the biggest sector in the US at 20% and technology was 17%, but now financials is only 13% and tech is 30%. So, to suggest that the index should be trading on the same PE as it was when the composition was very different doesn’t make sense.
Looking into the almanac
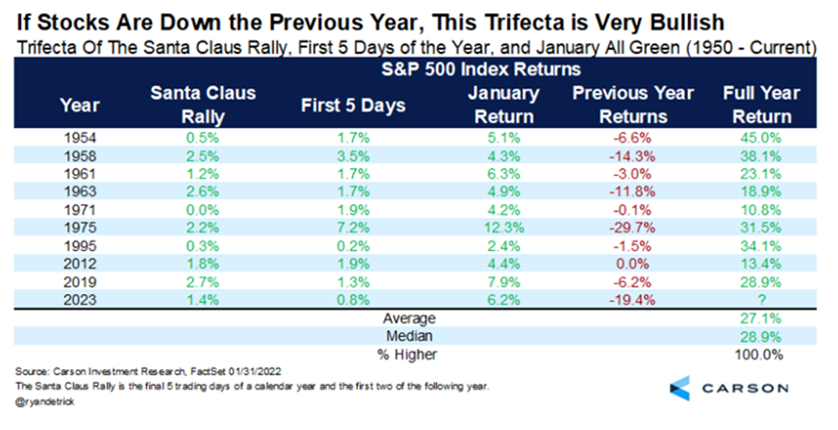
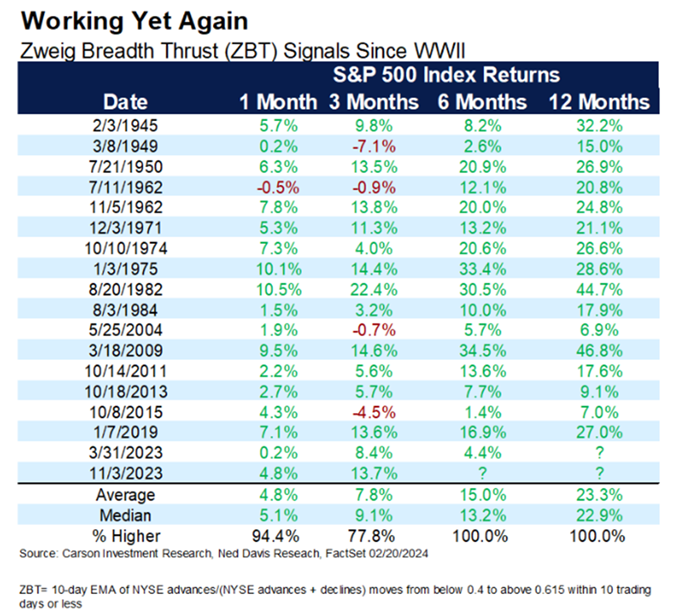
There’s a group in the US called Carson Investment Research, and they trawl through data about the US share markets to spot trends and patterns, something I call almanac investing. I’ve highlighted two out of the many positive points they’ve raised about the S&P 500.


You could understandably dismiss both of these observations as not much more than coincidences and say precedents like these are just made to be broken.
However, the reason I highlighted them is that I think they reflect a pattern of investor behaviour, which in large part is the all important swing factor of sentiment.
The US economy is still strong
The US economy defied a hugely overwhelming consensus that there was going to be a nasty recession last year. Whilst now consensus is that there will be a “soft-landing” (a soft way of saying they were wrong), there are still some bears holding out for a downturn.
Look, they may turn out to be right, if there’s one lesson we all should have learned by now it’s that forecasting the macro economy (things like inflation, unemployment, etc) is really difficult, but there are a few indicators of what’s happening in the real economy that I find persuasive.
First, real wages have grown steadily since COVID, and people having more money to spend is an unequivocal positive.

Importantly, most of the growth in wages is going to the lowest paid workers, who are far more likely to spend it.

Inflation in the US looks like it’s now well within the Fed’s target range of 2-3%, especially if you exclude housing (which they call shelter).

Why would you do that? Because the Bureau of Labour Statistics, which calculates the CPI, uses a reading for shelter which every man and his dog knows is about 12 months behind the real market. The Fed knows it too, so why they persist remains a mystery.
The chart below shows the Zillow (the US equivalent of realestate.com) rental index advanced by 12 months. In other words, the Zillow index peaked in the middle of 2022 and has been declining ever since. Price increases on apartment rentals have fallen so much they’ve gone negative, meaning rents are dropping. Overall, real world evidence suggests housing costs are way below where the Fed is presuming they are, and they’re still going down.

And why is it important? Because shelter accounts for about 30% of the CPI number, and 40% of the so-called “Core CPI”, which excludes food and energy costs and which the Fed says it watches more closely.
In turn, the critical follow on from that is interest rates do not need to stay so high if inflation is back in the target zone. The prospect of the Fed eventually lowering interest rates is a big part of what’s got the share market excited.
Finally, another bit of real-world evidence that the economy is pretty strong is shown in the incredible rise of manufacturing construction spending, which has taken off in response to the Biden administration’s Inflation Reduction Act, which throws a bunch of different subsidies at anything that resembles an energy transition project.

The bottom line
It’s true the US share market has notched up some strong returns and has hit a new all-time high, but that doesn’t have to mean it’s on the verge of falling again. There’s plenty of anecdotal, technical and fundamental evidence to back the move.
Nor does it mean the index can’t go through a serious correction. On average, the US market experiences a 14% intra-year decline every year.
At the end of the day, trying to time a market by selling and buying back again is really, really difficult. Take comfort that the bears have been wrong since the market bottomed in October 2022, why should they necessarily start being right now?
