Getting your head around what’s happening in China is really hard. Not only is it a complex economy, but it’s also a country that deals in very big numbers and has a government capable of pulling strings that almost no other country can. So trying to work out if the breathtaking rate of growth in China’s corporate debt as a proportion of GDP is something to worry about is complicated by arguments on both sides, but there’s also the fact that China has what’s called an ‘inverted yield curve’, which in most other countries would have alarm bells ringing as a precursor to recession.
The back story: how do you boost GDP growth? Easy, lots of credit
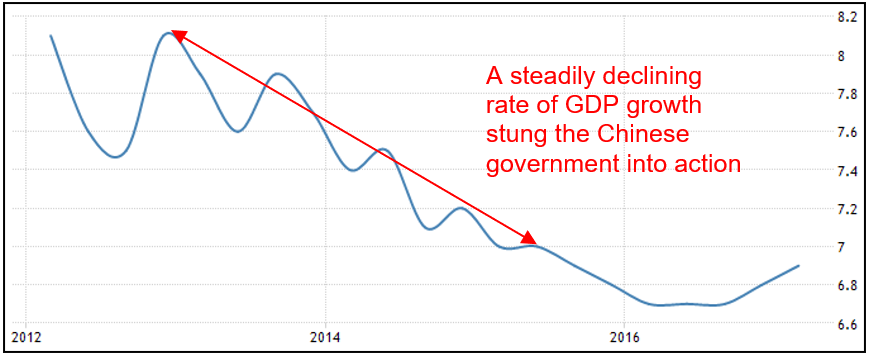
China’s GDP growth rate had slowed from a heady 8.1% in 2013 to a still extraordinary 7.0% midway through 2015 – see chart 1 below – and at the same time disinflation had taken hold with price growth at less than 1% per annum. Industrial production growth also fell from 19% per annum in 2009 to less than 6% by 2015. This was all a bit much for the government to bear: they have stated GDP targets that underpin their social ‘bargain’, where they keep growth high enough to maintain full employment and rising living standards and in return the people behave.
Chart 1: China’s GDP growth rate fell for three straight years
Source: tradingeconomics.com
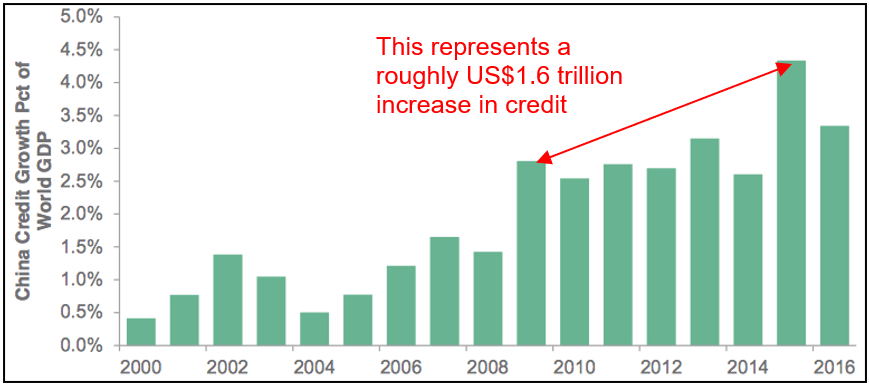
At the same time global growth was struggling to stay positive, so it wasn’t like China could rely on the pre-GFC formula of exporting its way to stronger growth. Instead, to boost growth the Chinese government pulled the same lever as they did in the wake of the GFC: a huge increase in domestic credit – a good old fashioned debt binge. Chart 2 illustrates just how dramatic that increase in credit was: China already had a history of high rates of credit growth, but 2015 and 2016 were a step change on that.
Chart 2: Chinese credit growth rose sharply in 2015 and 2016.
Source: Bloomberg
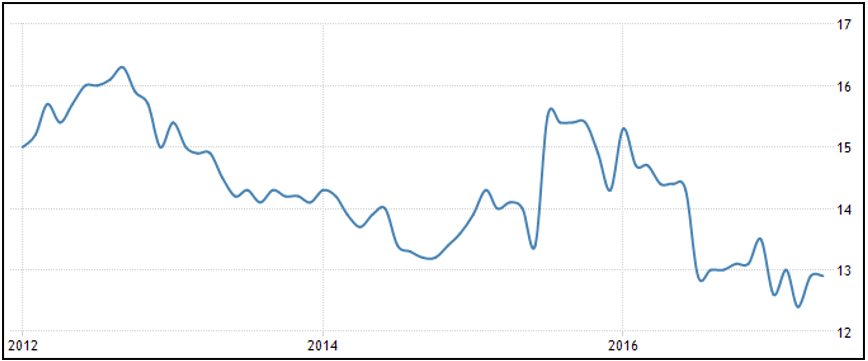
Bear in mind, chart 2 shows Chinese credit growth as a proportion of global GDP, which itself grew from US$60.1 trillion in 2009 to US$74.6 by 2015, so China’s credit had to increase from about US$1.6 trillion to US$3.3 trillion. Bloomberg estimates China’s total debt grew 465% in the 10 years to the end of 2016, and chart 3 shows credit growth peaked in 2015 at more than 15% per annum, which was more than double the rate of GDP growth.
Chart 3: Chinese credit growth peaked in 2015 at more than double the GDP growth rate
Source: tradingeconomics.com
Where did all that credit go?
Some of the credit was sunk into residential property investment, where growth rates in prices went from -3% in 2015 to 12% by the end of 2016. But a huge portion was taken up by Chinese companies, many of them State Owned Enterprises (SOE’s). The Bank of International Settlements estimated corporate debt in China was equivalent to 168% of GDP, or US$18 trillion, at the end of 2016. To put that into some perspective, US business debt is currently about US$13.7 trillion or 73% of GDP, Australian business credit is 51% of GDP.
And what did those Chinese companies do with that debt? Certainly there was some investment in capex, but already the Chinese economy faces problems with overcapacity, especially in the heavy industries like coal, steel, cement and plate glass. In fact, the IMF estimates capacity utilization across those four sectors fell by an average of about 20% between 2008-15. Some of those businesses tried to grow their way out of trouble: invest in more plant and equipment to be able to lift production and hopefully revenue, but they became increasingly unprofitable and unable to service their debts.
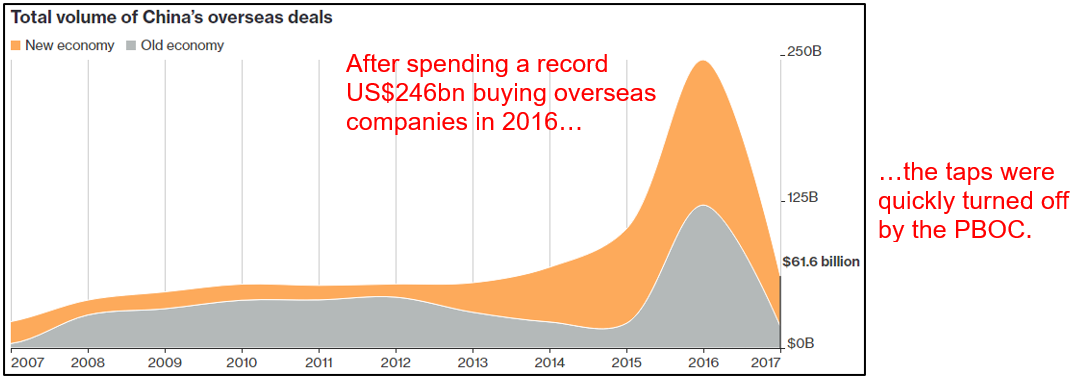
Other Chinese companies went on an overseas shopping spree, buying up a range of ‘new world’ businesses and brands ranging from the likes of software and tech companies to Volvo, Pirelli, the Inter Milan and AC Milan soccer teams, New York’s Waldorf Astoria and US film studios, as well as ‘old world’ businesses like resources and infrastructure (such as the Port of Darwin). In fact, corporate China announced a record US$246bn worth of overseas deals in 2016 – see chart 4 – more than double the previous record amount. At one point they were buying a German company on average every second week!
Chart 4: Chinese companies went on a credit-fueled overseas spending spree
Source: Bloomberg
But chart 4 also shows that even the Chinese central bank must have done a double take when they saw deals like a little known property developer buying the Chicago Stock Exchange and a loss-making iron ore producer buying a UK computer game developer. Indeed the government has made reining in corporate debt levels a priority, after the Governor of the People’s Bank of China said “non-financial corporate leverage [i.e. businesses outside the banking sector] is too high”.
Subsequently credit conditions have tightened up considerably, but that raises a new problem.
How do you unscramble the omelet?
It’s one thing to declare credit growth has to be brought under control, it’s another thing to do that without crashing the system: there are companies taking out new borrowings to finance the existing ones. This is where the Chinese government’s range of tools at their disposal is going to be critical. They can simply direct banks to stop lending to particular sectors or use their considerable financial reserves to prop companies up.
The catch is there is a certain portion of total loans outstanding that will realistically never be repaid, but the government can’t let a state owned company go bankrupt. In its annual report last year S&P estimated non-performing loans at about 6% (others have it at more than double that) of its sample of 200 companies, but tellingly 70% of companies in the sample were SOE’s and they accounted for 90% of the debt. In May Moody’s cut the Chinese credit rating for the first time since 1989.
One way the government is trying to deal with the non-performing loans is setting up ‘credit committees’, where the borrower and lender each appoint people to the committee and it tries to manage the debt. According to the Chinese Banking Regulatory Commission (CBRC) by the end of 2016 there were more than 12,800 such committees managing more than US$2.15 trillion worth of borrowings, which equated to 17% of total commercial bank loans. In one province alone the CBRC set up more than 1,300 committees covering 55% of corporate loans in the region.
Another method is to swap debt for equity, so the lender ends up holding a stake in the borrower. It’s estimated between RMB500 billion–1 trillion of such deals have been done, which have stopped about RMB3.5 trillion in loans from failing.
On the face of it that sounds like a good thing, save a company from failing and prevent job losses and the associated fall out. However, it creates risks of its own, with ‘zombie’ companies surviving only due to government protection rather than going out of business and enabling other, stronger companies to get a better market position and grow stronger. It’s what economists refer to as ‘creative destruction’.
Turning off the tap
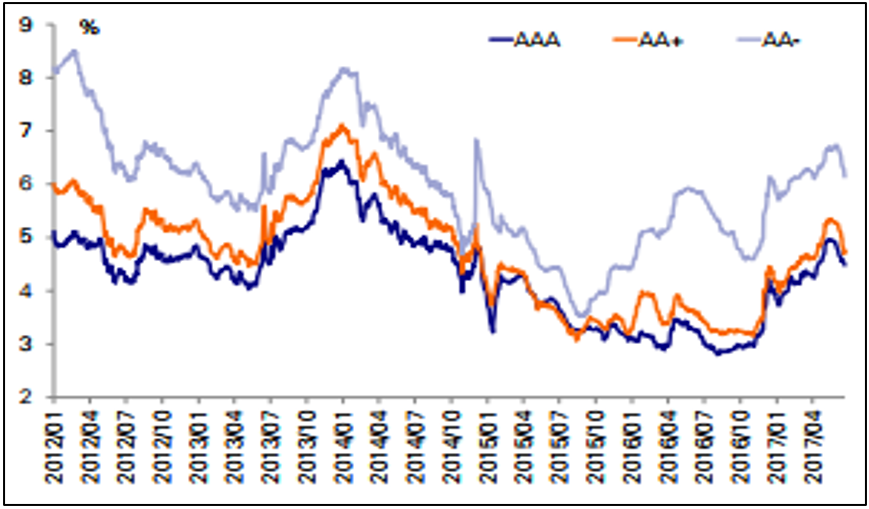
The final method used by the government to cap the growth of credit is through controlling the amount of liquidity by lifting interest rates or restricting who can borrow, which is a blunter instrument that can affect the entire market. An upshot of this has been a steep rise in Chinese corporate bond yields, as shown in chart 5. What that means is when companies want to raise money by selling bonds they have to pay higher and higher rates on them, which obviously makes life even more difficult for those that are struggling to service existing debt already.
Chart 5: Chinese corporate bond yields have seen a steep rise since late 2016
Source: Deutsche Bank
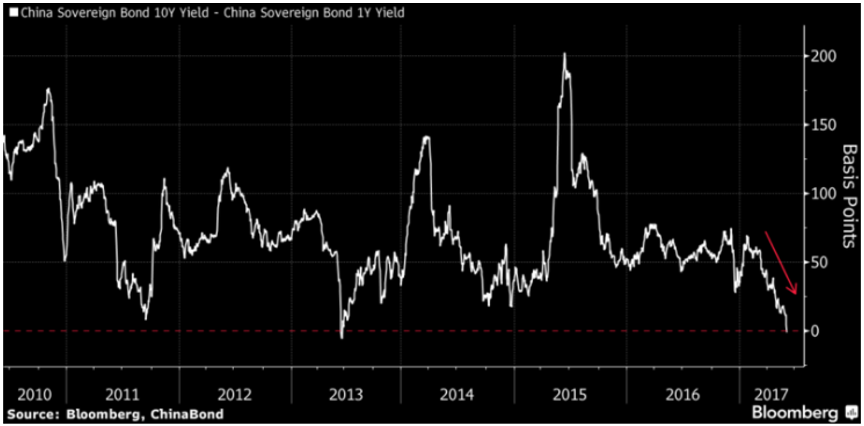
Something of real note is that recently the Chinese yield curve ‘inverted’, which means short-term yields on government bonds went higher than longer-term yields – see chart 6. That is an entirely abnormal situation given usually the buyer of a bond will require more compensation the longer they are exposed to the risk of the issuer defaulting. It’s only the second time this has ever happened in China and would normally suggest the market expects the economy to slow sharply in the medium-term.
Chart 6: the Chinese government bond yield curve has ‘inverted’
Source: Bloomberg
In the US, the yield curve has inverted seven times since the 1960’s and every time it preceded a recession. The last time the Chinese yield curve inverted the economy did not recess, which may well happen again this time, but it certainly indicates the market is under stress. Indeed, the idiosyncrasies of the Chinese bond market may make comparisons with the US meaningless: it’s nowhere near as deep and there are a lot more short-term bonds issued than long-term, and it is nowhere near as unregulated.
What does it mean?
As I said at the beginning, China is an incredibly complex beast. Some parts of the Chinese story beggar belief, like since 2009 China has increased its money supply by more than the entire US money supply; China has 260% of its economy in cash compared with 75% in the US; the Chinese banking system is now the biggest in the world at US$34 trillion, meaning Chinese banks are nearly three times the size of the economy while the US$7 trillion US banking system is equivalent to 40% of its economy; the amount the Chinese banking system has increased its assets since 2009 took the US banks 150 years to accumulate.
These are all staggering facts and prompt many questions and arguments. How can the Chinese money supply go up more than three-fold yet the currency over that period hasn’t changed in value? While a strong currency can be a matter of political pride, an overvalued currency makes for ridiculously cheap foreign purchases, be they companies, resources or houses.
The doomsayers point to the heydays of a rampant Japanese economy when Japanese companies were buying assets all over the world funded by more and more debt and every one of the top ten global banks were all Japanese. Their asset/debt bubble deflated by 85%, leaving the economy moribund for decades and battling deflation ever since. Perhaps it’s a case of history rhyming?
You can also draw on other lessons from the past. For instance, since 1990 every emerging market economy that saw the ratio of private sector debt to GDP increase by more than 30% in a decade experienced a banking crisis: China’s ratio increased by 93% in the nine years since 2007 to be 211% of GDP.
An obvious question is: what could be the catalyst? I have no idea, but bear in mind the Asian Financial Crisis of 1998, characterized by artificially high exchange rates and excessive debt build up, was triggered by Thailand floating its currency. Not many people would have connected those dots.
On the other hand, China bulls point out the government has done a remarkably good job managing what has been the greatest social transformation in history. It has tools at its disposal that western central banks can only dream about and government reserves that would be capable of recapitalizing the banking system. Plus, the gloom crew has been calling a Chinese debt bubble for years.
The issues touched on here could easily take up a whole book, if not two or three. Unfortunately when you’re talking an excess of debt bad things tend to happen, but while this is another example of a situation that warrants careful attention, it could easily go on for a lot longer than anyone might expect. Meanwhile the Chinese stock market is more than 20% cheaper than the US and China single handedly accounts for one third of global GDP growth. We need to hope it keeps going.

