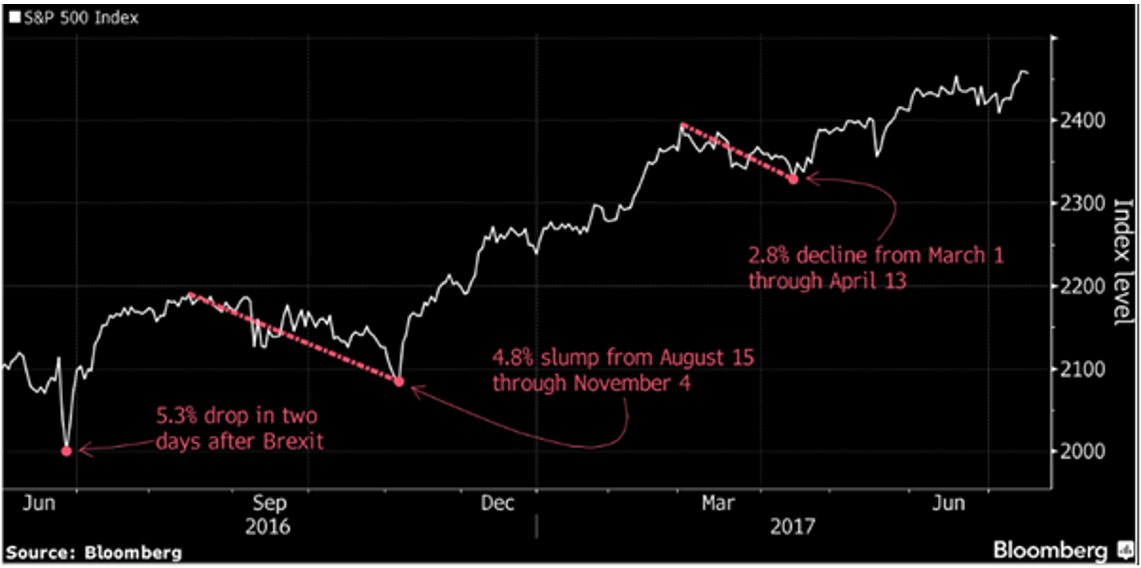
Bloomberg is reporting the US’s S&P500 has gone the longest in 20 years without a 5% pull back (see Chart 1) – the last one was after the Brexit vote, and even that was over in a flash.
Chart 1: The S&P500 has gone the longest in 20 years without a 5% pullback
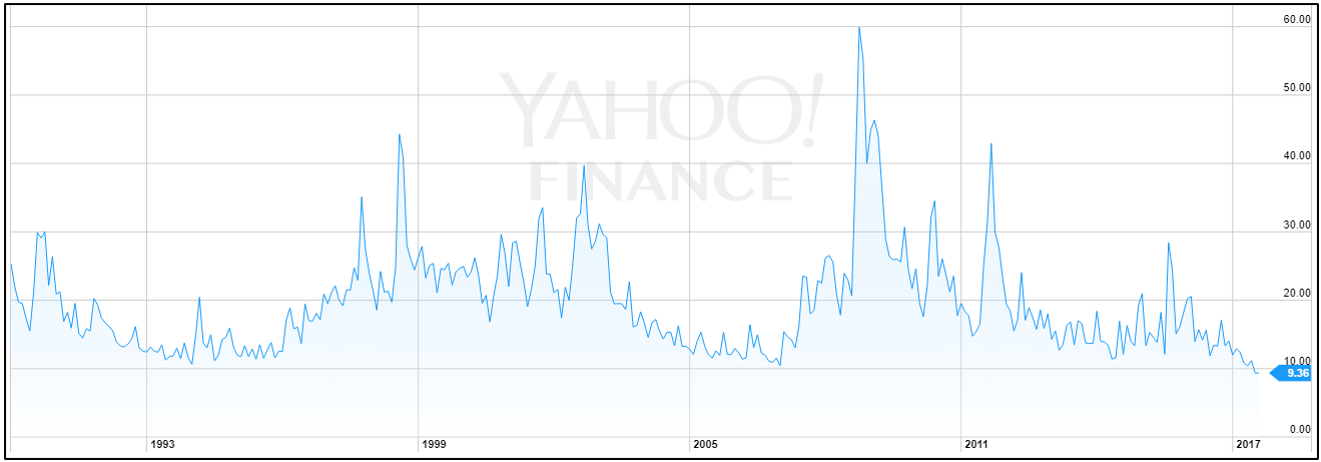
We’ve been talking for a while about the very low share market volatility as measured by the ‘VIX indicator’, which shows that, in volatility terms, equities markets are in the lowest 3% of trading days on record (see Chart 2).
Chart 2: The ‘VIX’ indicator shows equity markets are in the lowest 3% of historical volatility
Source: Yahoo Finance
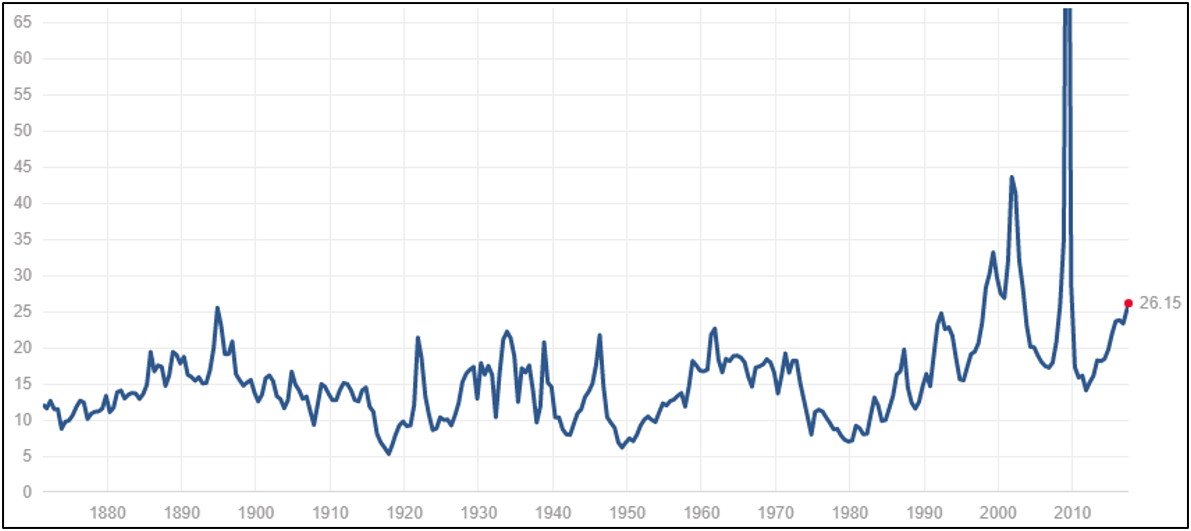
Meanwhile, the S&P500’s Price to Earnings ratio (PE) is in the top quintile of trading days historically (see Chart 3).
Chart 3: The S&P500 price to earnings ratio is historically high
Source: multpl.com
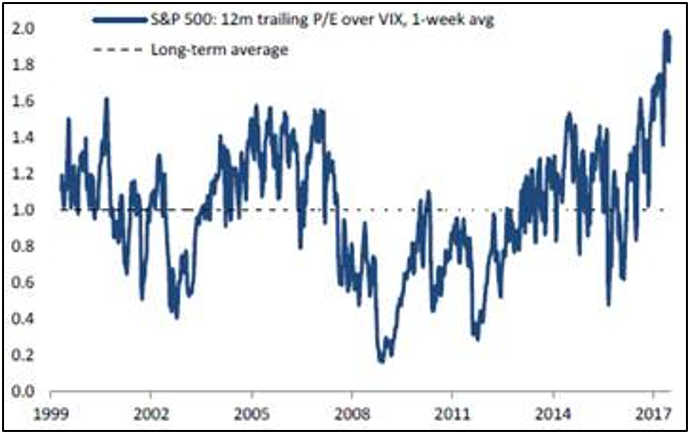
Put them together and the so-called ‘US Complacency Indicator’, which simply divides the S&P500’s PE ratio by the VIX indicator, is at a 20 year high.
Chart 4: The US ‘Complacency Indicator’ is at a 20 year high
Source: Deutsche Bank
Why is this?
There has been plenty written about this, with various reasons put forward: as interest rates remain low more money moves into equities; there hasn’t been a full blown economic crisis for ages; central banks are so pro-active in warning markets about their next moves that there’s no surprises.
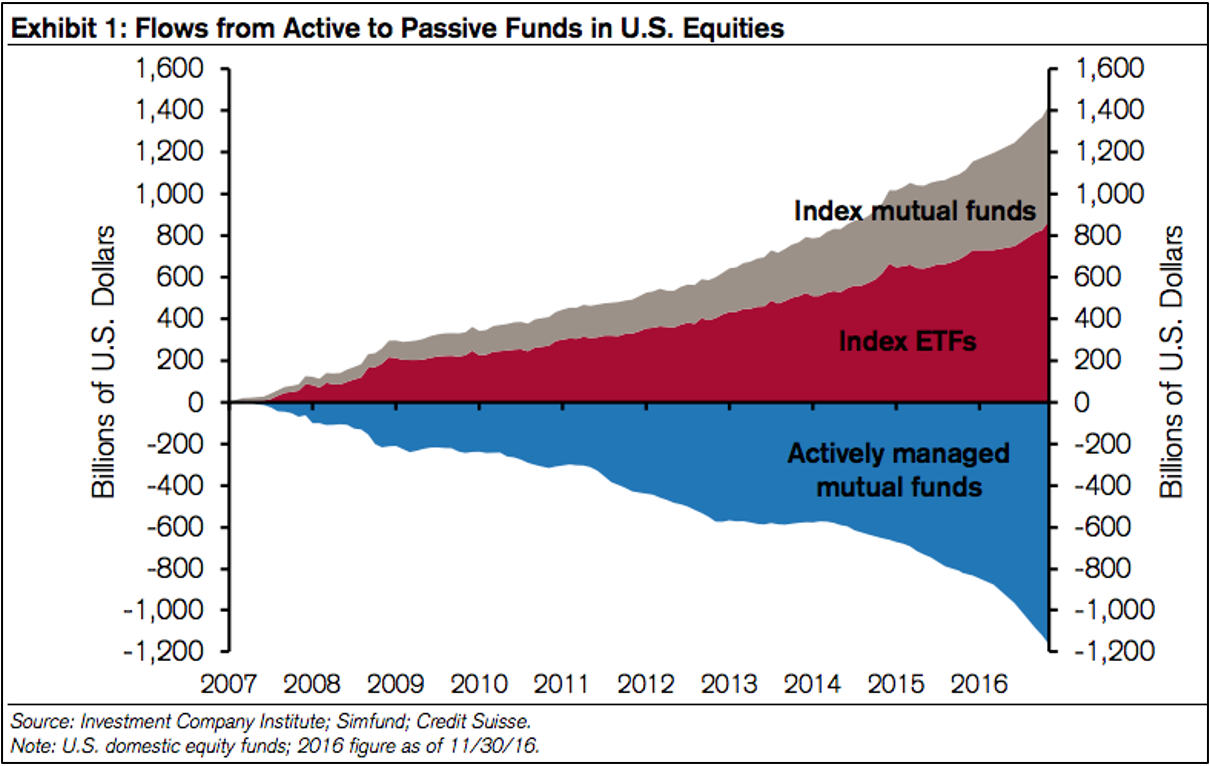
One reason that appeals to me is the weight of money going in to what is referred to as ‘passive funds’, that is, index funds and ETF’s. This is money that automatically gets invested in a prescribed way: they put the most money into the biggest stocks and so on down the line. Over the past 10 years there has been about US$2 trillion move from actively managed funds to these passive funds (see Chart 5). There’s a good argument to say there is an almost ‘permanent bid’ for stocks, that is, the sheer amount of money going in to index funds provides ongoing support for share prices.
Chart 5: Flows from Active to Passive Funds in U.S. Equities
The question is, when does that support evaporate? The realistic, though perhaps uncomfortable, answer is no one knows.
As we’ve also written many times in the past, markets can keep going higher for a lot longer than you expect. Things are rarely ever so different as to justify a whole new paradigm: volatility hasn’t disappeared, it’s just hibernating.


