A plain English guide to the financial market effects of the ‘Virus Crisis’

A plain English guide to the financial market effects of the ‘Virus Crisis’

With the inundation of COVID-19 news coverage we’re all having to live through, I thought I’d jot down a few thoughts on a bunch of different topics related to financial markets. Short and sweet(ish).

How does this bear market compare?

While every bear market’s different in terms of the cause, depth and duration, this one stands out because it’s a rare occasion where it started in the real economy and transmitted to the financial markets, rather than the other way around. You could argue the 1970’s OPEC-related slump was similar, but even there, the macro picture was very different with high inflation. That makes it harder to get a grasp of how things might play out and how effective the rescue measures from governments and central banks will be.

Over the last 50 years we’ve seen seven bear markets in Australia (that is, falls of more than 20%), including the current one, with an average decline of 35%. The US has also seen six with an average fall of 42%. The current ‘virus-crisis’ has seen our market drop 34% to the close on 19 March and 29% for the US.

One of the things that makes this different is because the crunch is coming from both the supply side and the demand side. When China shut down, those companies that rely on Chinese manufactured goods for their own business were struggling to fill the gap. And now that more and more of the world is going into quarantining and isolation, consumers aren’t spending. So the proverbial double-whammy.

Where are we up to with this one?

What level of economic slowdown is being priced in by share markets right now is tough to say with any accuracy.

Asset allocation consultant, Heuristic Investment Systems, reckons for the US, in an ‘average recession’ where GDP drops by 2%, a bear market tends to see the S&P 500 fall by 25-30%, and in a deeper recession, like the GFC, the average fall is 40-50%. On that basis, the markets are currently pricing in an average recession.

By contrast, the Bloomberg Chief Equity Strategist, Gina Martin Adams, says the S&P 500’s ‘trailing price to earnings (PE) ratio’, which refers to the earnings that were reported by companies over the past year, which at least has some certainty, is now about 15. Compared that to her ‘fair’ multiple, it implies a worse than average recession with earnings declining 22% over the next year.

What happens after bear markets?

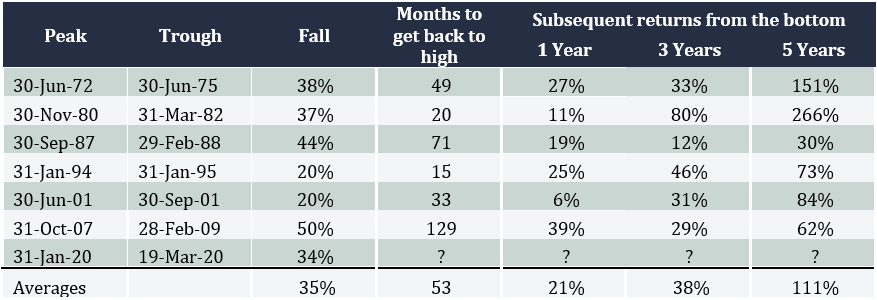
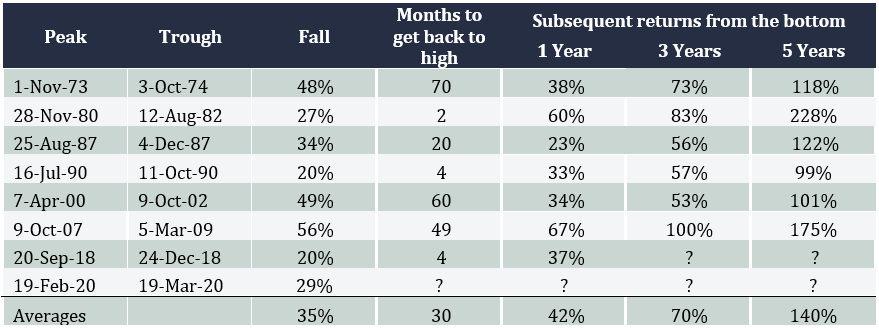
The tables below show how far Australian and US share markets have fallen during each bear market over the past 50 years, how long they took to get back to where the index started, and then what returns were like 1, 3 and 5 years after.

For Australia, the average three year compounded annual return works out to be more than 11%, and in the US it’s an amazing 19%. Given it appears interest rates are likely to stay very low for a long time, that represents an attractive return, and is one of the arguments in favour of a sharp rebound in shares.

Australia bear markets since 1970: extent of falls and subsequent returns
A plain English guide to the financial market effects of the Virus Crisis image1
US bear markets since 1970: extent of falls and subsequent returns
A plain English guide to the financial market effects of the Virus Crisis image2

Why has this bear market been so volatile?

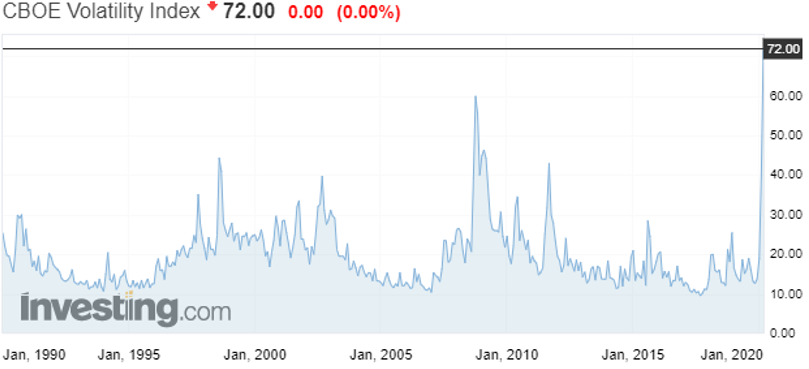
The VIX index in the US measures share market volatility, and the chart below shows it’s hit eye-popping levels in the past couple of weeks, every bit as stomach-churning as the GFC.

Share market volatility has spike to all-time highs
A plain English guide to the financial market effects of the Virus Crisis image3

While it’s almost impossible to get definitive numbers, it appears much of the volatility is coming from so-called ‘systematic strategies’, essentially computer-driven funds that trade automatically depending on all kinds of different variables, like momentum or volatility or depending on what’s happening in other markets like bonds or commodities, and then there are the ‘high frequency trading’ funds that aim to jump in ahead of any trades at all. The chart below shows how sharply some funds have dumped their equity positions.

Computer-driven funds have been very active
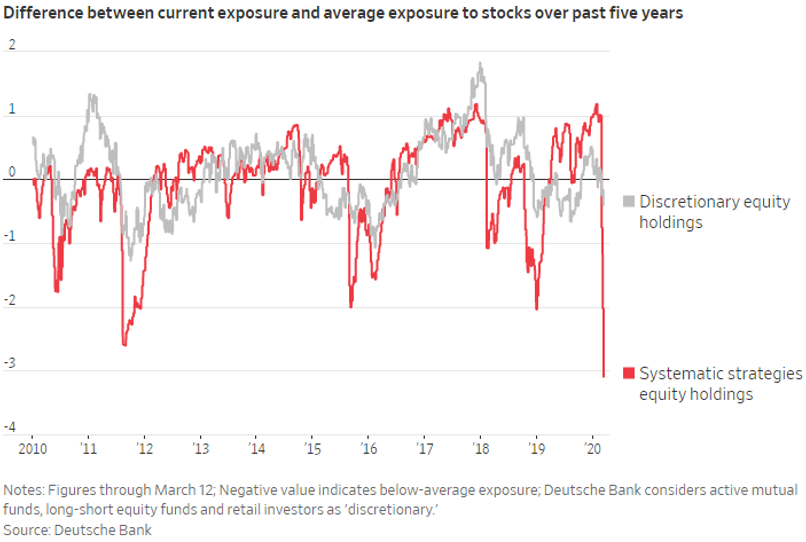
A plain English guide to the financial market effects of the Virus Crisis image4

What’s happening in bond markets?

Bond markets have been every bit as crazy as share markets, but in a scarier way. Credit markets facilitate the flow of money around the financial system, with trillions of dollars’ worth of deals being done around the world on a day to day basis. It’s these markets that keep the banking system working properly.

Last week, however, the flow was getting choked off because companies were frantically trying to get their hands on cash. Large companies will typically arrange lines of credit with their banks that they can draw on when needed. If companies think there’s a risk they might need cash urgently, because, for example, their business has all but closed down during a quarantine, they’ll go to their bank and draw all that cash out. But there’s a limit to how much cash banks will have on hand, so when they started getting hit up by their customers, they had to go to the credit markets and try to raise cash by selling bonds. However, when everyone’s trying to raise cash at the same time, a market can quickly run out of buyers, so the risk premium they’re willing to trade at rockets (another way of saying the price they offer to buy at goes down), as shown in the chart below, and that’s how the financial flows were getting choked up.

Credit markets were running out of buyers, reflected by risk premia rocketing
(Chart is of the US High Yield Index Option-Adjusted Spread)
A plain English guide to the financial market effects of the Virus Crisis image5

Fortunately, the central banks were able to ride to the rescue and pump liquidity into the system to calm things down a bit, but we’ve seen similar huge jumps in what’s called ‘credit spreads’ across the whole credit market, right around the world, which is seeing a sharp repricing of corporate bonds.

What are central banks and governments doing?

In current markets, central banks and governments have quite different roles to play.

Central banks are focused on keeping credit markets operating, and between them they’ve promised to inject trillions of dollars to make sure that happens. That was a big part of the package of measures the Reserve Bank announced this week, which included cutting interest rates to 0.25% to reduce the cost of credit and basically saying the rate will stay there for as far as we can see, and it’s making some $90 billion of funding available to banks to lend out for which it will charge them only 0.25%. It also said it’s going to try to make sure the Australian 3 year bond trades at a yield of 0.25% and finally announced it’s going to join the quantitative easing brigade.

The US Fed has also cut rates to basically 0%, so has the Bank of England and the Reserve Bank of New Zealand. The ECB was already there (in fact their rates are negative) plus it said it will expand its balance sheet by €750 billion and allow qualifying banks to borrow up to €2 trillion at a rate of -0.75% – that’s right, they’ll pay banks to take the money from them!

There will be howls from free marketeers criticising the central banks for supporting asset prices, but that’s an unfair characterisation of what they’re doing, which is more like keeping the financial plumbing open to provide a bridge to governments’ fiscal spending.

And governments have certainly said they’ll spend. After years and years of central banks begging governments to open their wallets, we’ve seen what looks like massive programs being announced: $1.2 trillion in the US, £330 billion in the UK, €1 trillion from European governments to guarantee business loans, and, of course, what appears to be a relatively paltry $17 billion here in Australia. While they sound like huge numbers, rest assured, governments will need to do more if they want to backstop their economies.

This may finally be the time for governments and economists all over the world to wrap their heads around Modern Monetary Theory.

When will the market recover?

We’ve been fielding lots of inquiries from clients asking when they should buy but unfortunately there’s absolutely nobody on the planet that can give you a good answer to that question. What I think I can say is the market will start to recover once it believes the odds that we’re through the worst of it go to 50.1%, from 49.9%, but exactly how that can be judged I don’t know. It could be a slowdown in the rate of new cases, or even confirmation that current treatments are indeed working, or acceptance that governments will indeed spend enough to backstop economies.

Given the hopeless execution by the Trump administration in the US you’d have to think they have a long way to go, and here in Australia numbers are still doubling every 2-3 days.

A huge opportunity

One thing’s for certain, share markets are very cheap once again, and the further they go down the higher will be the returns on the other side. If you’re in the lucky position of being able to invest, don’t fall for just buying the most beaten up stocks, who knows, some of them may never recover. Similarly, if you already own shares, you should ask yourself if you’d buy the same ones now. Rather, my suggestion would be to think about the portfolio you wished you’d owned just before things went pear-shaped, and target that.

It’s impossible not to sound cliched, but these are genuinely extraordinary times, especially for Australia. Having endured a summer where it felt like the whole country was on fire, we now have a global pandemic wreaking economic havoc. I wish you all the best and stay safe.

The WeWork debacle shows private equity is not a one way street

The WeWork debacle shows private equity is not a one way street

The Yale Endowment Fund was an early mover toward big allocations to private equity, which accounted for 40% of the fund’s assets last year. After returning more than 11% per year for the past 20 years, it’s made David Swenson a rock star among portfolio managers and started a movement that’s seen private equity’s share of giant investment funds go from barely being on the radar 20-odd years ago to now being a meaningful and indispensable portion.

Australia’s own Future Fund has 16% of its $160 billion in private equity, most of our big industry super funds include some weighting to it, and over the past five years there’s been an increasing number of vehicles offering private equity exposure to mum and dad investors that have proved very popular. And why wouldn’t they: as an asset class, private equity’s delivered returns that have averaged about 4% per year more than global share markets over the past 10 years or so and usually without the big swings share markets can suffer from. But the recent WeWork debacle and the dismal performance of Uber since it listed have shone a light on some of the risks in the space, risks that all investors need to be mindful of.

Private equity is investing in assets that sit outside public markets, and it can range from backing businesses in the earliest stages of starting up, right through to buying and selling long-established businesses or assets. The asset can be in private hands to begin with, or a private equity firm might buy a company listed on a share market and take it private.

One huge advantage of private equity is that if they’re transacting on a private company there are no insider trading laws, which is fair enough, if you were buying an asset from your neighbour there’s no reason the general public needs to know all the details. That means when a private equity firm does due diligence on buying a company they can insist on getting access to every detail available, information that a fund manager buying shares in a listed company would go to jail for.

Returns have also been less volatile than share markets, which is because the funds are not traded on a public market. When an asset only gets valued once or twice a year, it’s unlikely you’ll see a lot of ups and downs in the price. The downside of that is private equity is usually an illiquid asset, meaning you can’t buy and sell it whenever you want. Instead you’re typically locked into a fund for anything up to five to seven years, and in return you hope to harvest what’s called the “illiquidity premium”.

Because of that illiquidity, returns from private equity can be totally unrelated to share markets, which can be very handy when markets correct and you’ve got a chunk of your portfolio that barely moves. It’s close to the holy grail of “equity-like returns with bond-like volatility” that so many investors dream about.

With the huge rise in popularity of private equity as an asset class for institutional investors over the past 10 years, there’s likewise been a huge rise in the amount of money chasing private assets. It’s estimated there’s US$5 trillion locked away in private equity funds already, and Prequin, an alternative asset analyst, found more than half the large pension funds and family offices it surveyed intended to increase their allocation.

Of that US$5 trillion, US$2 trillion is ‘dry powder’ that hasn’t been invested yet and the intense competition for assets has seen the multiples paid rise by 20% over the past eight years. After the GFC, US regulators guided private equity firms to paying no more than six times ‘EBITDA’ (a proxy measure for how much cash a business spits out), but recently almost 40% of deals have been done at more than seven times.

While that may not sound like much, it’s a 17% rise and the way a lot of firms are looking to maintain strong returns on higher priced acquisitions is by jacking up the debt, which has seen average debt multiples increase 20% over the past few years. In just the last few years, once household names like Debenhams, Toys R Us and Pizza Express, have collapsed under the weight of the debt piled on by their private equity owners.

In January of this year Japan’s Softbank, one of the biggest private equity firms in the world, put money into WeWork at a valuation of US$47 billion. In the build up to listing the company in the US, which is the way many private equity firms cash in to realise their profit, Goldman Sachs and J.P.Morgan valued it at US$50-60 billion, but after closer scrutiny by regulators and fund managers the deal was pulled and the valuation is now estimated at more like US$10 billion.

That came after another private equity darling, Uber, was valued last year as highly as US$120 billion, then listed at US$80 billion, and is now US$50 billion. Likewise, its competitor, Lyft, has seen its valuation fall by 40% since it listed six months ago.

Having an exposure to private equity in your portfolio can be great for returns and can reduce its volatility, but like anything, you really need to know what you’re buying first. There are some companies that run like a Swiss watch, others that grab headlines for what can be the wrong reasons, and others that are clearly trying to jump on the bandwagon and raise money from unsuspecting mums and dads. The low interest rate environment is a double tailwind for private equity: lower yields are encouraging investors to look elsewhere for a return boost, and debt is cheap. Just make sure you don’t get blown off course.

Low inflation explains everything

Low inflation explains everything

Low inflation is a global phenomenon that has central bankers tearing their hair out: nobody can tell you exactly what’s causing it and, so far, nothing seems to be able to stop it. And its effects on financial markets, and therefor every investor’s portfolios, are profound. In fact, this very low inflation environment can explain an awful lot of what seems to be peculiar in markets at the moment.

Just how low is inflation?

Australia’s ‘core CPI’, which excludes the more volatile prices like food and energy, averaged 3.7% since 1983, compared to the June reading of 1.6%. That’s not far off one-third of the average.

The poster child for low inflation is, of course, Japan, where, over the past 20 years, the core CPI has averaged -0.2%.

Lower bond yields

Inflation is like kryptonite for bonds: the higher inflation is, the weaker are bond prices, and vice versa. Across the world bond yields are plumbing record lows, including Australia where our 10-year bond yield is comfortably (or is that uncomfortably?) below 1%.

You might read how low bond yields indicate the bond markets are pricing in disastrous economic growth scenarios. In fact, what they’re pricing in is low inflation, and conventional economics dictates that you only get low inflation as a consequence of low economic growth. That may or may not happen, the truth is, nobody knows.

It can explain negative bond yields

There are experienced bond fund managers saying negative bond yields make no sense at all and pointing the finger at ‘central bank manipulation’. Bond markets are massive, reflecting the wisdom of a very big crowd, and they’re driven by a combination of human sentiment and some pretty funky mathematics.

If an investor has a view that disinflation (where inflation rates decrease over time) is here for the foreseeable future, then it’s perfectly rational to prefer the certainty of losing 0.4% of the value of their capital by buying a negative yielding bond, than sticking it under the mattress and losing 0.5%.

It can explain rising equity valuations

Investing 101 will tell you that a share price is supposed to reflect the net present value of a company’s future cash flows. To make that calculation you need to use a ‘discount rate’ that you apply to those future cash flows so you can work out what they’re worth in today’s money, the lower the discount rate the higher the valuation in today’s money.

That discount rate will normally be based on the ‘risk free rate’, which is typically the 10-year bond yield, but most analysts will add a bit extra to account for what they think might happen to bond yields going forward, or to reflect what they reckon might be added risks associated with the company they’re analysing.

In a recent interview, the well-known Magellan fund manager, Hamish Douglass, explained how small changes to your discount rate can have a magnified effect on a stock valuation: by reducing your risk free rate from 5% to 4%, the valuation of a business with 4% earnings growth increases by almost 20%, and a reduction from 4% to 3% sees a 25% increase.

Nothing else has changed, just your view on how long inflation will stay low, but now you’re prepared to pay significantly more for the same share. No wonder a talented fund manager friend of mine likens a DCF valuation to the Hubble telescope, where the tiniest shift can have you looking at a whole new galaxy.

Now imagine the pressure on fund managers across the world this year, with bond yields grinding downwards, forcing them to wrestle with whether or not they lower their discount rate and increase their valuations.

It can explain why so many fund managers have underperformed

Over the past nine years, so-called ‘value’ stocks have substantially underperformed ‘growth’ stocks, for example in the US by almost bang on 100%.

It’s probably not a coincidence that, according to Mercer, in the 2019 financial year, 87% of large cap Australian equity fund managers underperformed the ASX200, and in the 2018 calendar year it was roughly the same in the US. Not surprisingly, you’ll also read confounded fund managers, sounding like jilted lovers, complaining that markets are super expensive and being driven by a narrow cohort of sometimes defensive and sometimes growth stocks.

The problem is, if your frame of reference for valuations is the last, say, 40 years, you’re comparing a time of radically different inflation rates and bond yields – and therefor valuation metrics. It would not be surprising to find a lot of those underperforming fund managers are either resolutely (stubbornly?) sticking to their higher discount rate valuations or chasing their valuations higher as they begrudgingly accept lower and lower bond yields.

Those fund managers complaining about markets being expensive may end up being right, maybe inflation will go up and things will look like they used to once again, a process they call ‘normalisation’. Then again, maybe it won’t, and they’ll be left failing to adapt.

How long will low inflation last?

Because we can’t be sure of what’s caused inflation to be so low, nor can we be sure of how long it will stay that way. Who knows, this time next year we might look back wistfully on the days when we worried about inflation not being high enough, or in 10 years we may look back on the days when inflation was positive.

A classic mistake

A classic mistake

What would you do: you’re 67 years old and about to retire from General Electric with a company pension. You hold US$1.8 million worth of GE stock, which accounts for 90% of your investment portfolio. Do you sell some of your GE and diversify or sit on it because it’s a blue chip company?

This was a topic discussed on a recent episode of one of my favourite podcasts, called Animal Spirits, where two American financial bloggers chat about things they’ve found interesting over the past week. It was actually a thread on Reddit posted by the retiree’s son, who was asking what his dad should do having held the shares for years and being “quite stubborn”, which presumably means he wanted to hang on to them.

There were some 124 comments on the post. While I haven’t read all of them, my sense is that most were arguing he should keep the shares, with quite a few pointing out the 4% dividend yield would pay him US$72,000 per year. I’ve no idea what the guy ended up doing but, given what’s happened to GE shares in the nine months since, there’s a really good lesson to be had for anybody.

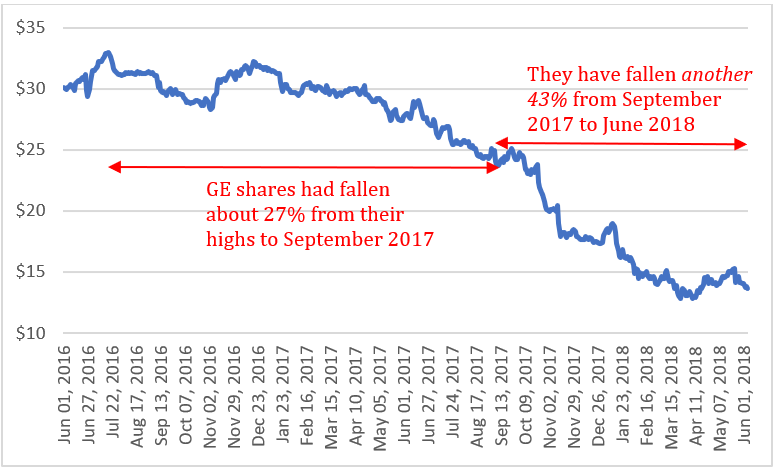
When the original question was posted in September 2017, GE shares were trading at around $24, having fallen about 20% in the previous year and compared with a peak of about $33 in July 2016. GE has been one of the great blue chips of the American market, so it’s not surprising that a lot of people expected it would rebound. Alas, today the stock is trading around US$13.60 after revealing problems with its power generation division, amongst other things, and cutting its dividend in November 2017 – see chart 1.


Chart 1: the GE share price has fallen more than 40% since September 2017
Source: investing.com

So if the retiree didn’t sell any of his shares, the holding would now be worth just over US$1 million and at the current yield of 3.5% he’d be receiving around US$35,000 in dividends.

So lesson number 1 is concentration risk. This guy had 90% of his investment portfolio tied up in a single stock, which is also the company that’s going to be paying his pension. That’s an awful lot of exposure to have to a single company, blue chip or not.

It’s often said it takes concentrated exposure to get rich, but you diversify to stay rich. While we can all name exceptions to that rule, when you’re that close to retirement the way the equation stacks up is very different to when you’ve got 20-30 years of work ahead of you.

Lesson number 2 is about what’s called ‘sequencing risk’, which is taking a big hit to your assets when you’re not going to be able to make up the lost money through work. He needed to do the sums: his total investments were worth US$2 million, plus he was going to get a pension. Could that amount of money have supported the lifestyle he wanted in retirement? If the answer is yes, then it makes sense to take steps to protect the capital, if it’s no, then how much more money do you need and what’s the best way to get there?

Just as importantly, he needed to ask himself how he would feel if the total of his investments dropped to US$1.8 million, or US$1.6. If the answer is he would have felt pretty miserable and stressed about the future, again, he needed to protect the capital.

When you’re about to retire is not the time to take the attitude of ‘those shares have fallen so far already, surely they won’t fall further’. Any share can go to zero, even those considered to be blue chips, just ask holders of Enron shares. And while of course there may be tax considerations in selling a big holding, it is risky to allow tax to be the main determinant of your investment strategy.

This scenario is yet another example of where our human biases can get in the way of making sensible decisions. It’s also another example of where it can be a good idea to get objective advice.