Pricing risk correctly is fundamental to any business; get it wrong and things can go badly pear shaped. One measure of risk in financial markets is the ‘high yield credit spread’, and right now it looks crazy.
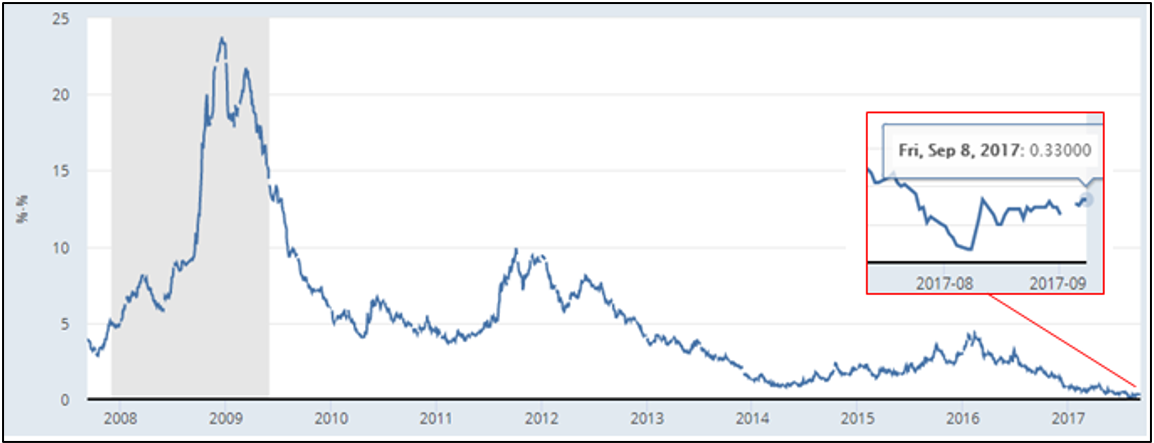
The ‘high yield credit spread’ is the difference in yield between junk bonds (also known as high yield bonds) and the US 10 year government bond. Chart 1 shows this spread closed last week at 0.33%, which is close to the lowest it’s ever been.
Chart 1: The high yield credit spread
Source: St Louis Federal Reserve
Why is this significant? A junk bond is one that the ratings agencies, like S&P and Moody’s, consider to have a higher risk of default, whereas a US 10 year bond is considered the height of security (even with an unpredictable president negotiating the debt ceiling). While the ratings agencies got a bad name during the GFC, that was on their ratings for financially engineered products that chopped up a whole lot of different bonds and put them into the same single product – they were a disaster. When it comes to individual companies, the agencies have a very good record, so it’s worth paying attention to them.
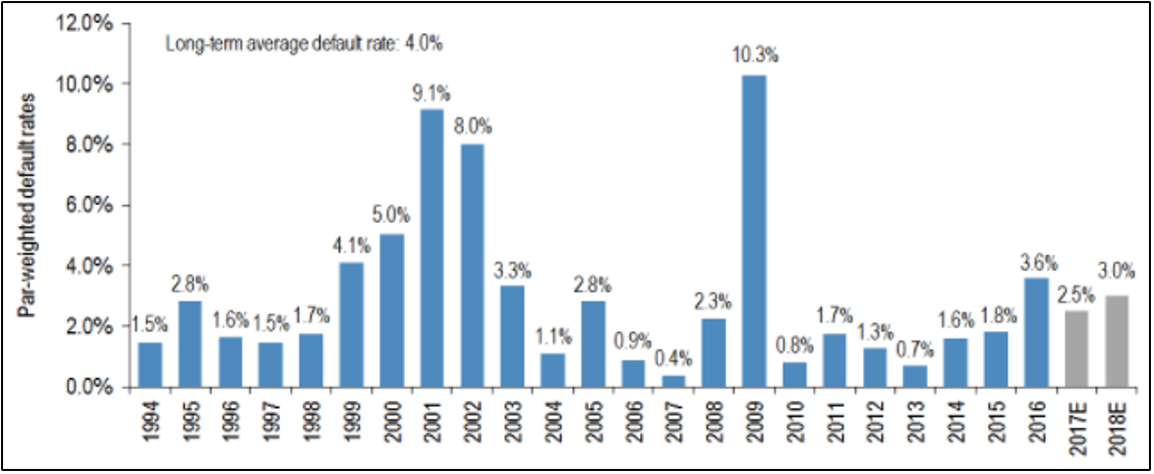
Over the long run, an average of 4% of junk bonds default each year. As usual, the average conceals the variability of the actual outcomes, which is shown in chart 2. While you can make forecasts about what the default rate will be over the next year or two, the risk always lies with those things that are simply unpredictable.
Chart 2: Default rates for high yield bonds
Source: JP Morgan
For 2017, forecast junk bond default rates range from 2.5% by JP Morgan, to S&P’s 3.9% and Moody’s 3%. While not big numbers it still means there is some risk, plus you’ve got the chance of an unforeseen event causing a blowout. At the moment, investors are being compensated a measly 0.33% for taking on that extra risk.
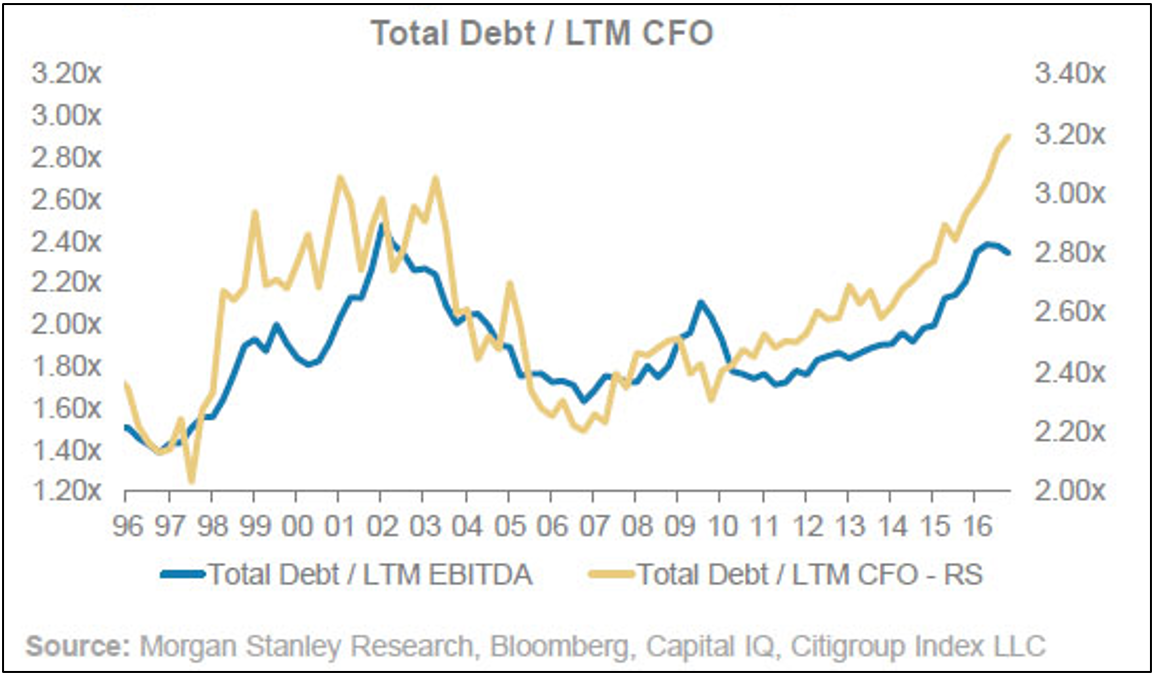
There are all kinds of justifications you can point to for such a low margin of error: interest rates are still at record lows which makes servicing debt much easier, global inflation is very low so there’s barely any upward pressure on interest rates, global growth is slowly picking up and central banks will support the market. All true, but companies have been increasing debt to record levels and chart 3 shows that leverage, as measured by companies’ ability to service their debts from operating cash flows, is back to cyclical highs.
Chart 3: Total debt compared to Last Twelve Monthsof cash flow from operations shows leverage is high
Things are currently very good for investors: financial market volatility is still close to all-time lows, debt defaults are low and economic growth is chugging along, so the ongoing reach for higher returns has paid off. The problem is, risk never dies, it just hibernates.

