The January correction explained

The January correction explained

January saw the biggest correction in financial markets since the COVID selloff in February 2020. What happened? What caused it? And what’s the outlook?

The numbers

Share markets across the world declined over the month of January. The table below shows how far different markets fell from their recent highs, which in some cases was late December and in others was early January, and how they ended up on 31 January compared to the same recent high.

The numbers_image1

It is striking the extent to which some markets have already bounced back, although it is too early to declare the correction is necessarily over.

What caused the selloff?

The selloff started because markets expect central banks to increase interest rates in response to rising inflation.

Australia’s inflation rate hit 3.5% in the December quarter of last year, after 3.8% in the September quarter, the highest in the post-GFC period.

However, it’s the US, where the CPI hit 7% in December last year, the highest since 1982, that has markets really spooked. Some of the year over year price rises include energy +29%, gasoline +50%, used cars and trucks +37%, plus food and shelter costs rose sharply as well.

Exactly what causes inflation is always tricky to work out, but this time it’s easy to point to at least one major contributor. The US government injected COVID stimulus equivalent to 25% of GDP, which saw personal incomes increase massively at a time when companies had sharply reduced forward orders in anticipation of a drop in demand. While spending initially dropped, it bounced back quickly – see chart 1.

Chart 1: US personal income increased sharply with government stimulus and spending followed soon after

Chart 1_Trillion of chained 2012 dollars

Because people were in lockdown, spending on services plummeted and has only slowly recovered, but spending on goods exploded – see chart 2.

Chart 2: Spending on goods rocketed when people were in lockdown

Chart 2_Personal Consumption Expenditures

A lot of those goods being bought had to be imported from Asia, however, at the same time, a chronic shortage of shipping containers saw prices jump from US$3,000 for a container from China to the US, to as high as US$20,000. Then there was the problem that a lot of US transport workers were either calling in sick or quitting their low-end service jobs, so supply chains quickly got clogged up, from ports to warehouses.

Semiconductors quickly became scarce and auto manufacturers, who had cancelled contracts with the semiconductor manufacturers, were left with tens of thousands of almost finished cars at a time when demand for new and used cars took off. Consequently, car prices jumped.

Then US companies reported record margins at the end of the year, so evidently they seized the opportunity to raise prices and pass them on to consumers.

The upshot, goods inflation, having been negative for the past 25 years thanks mainly to technological advances and low wages growth, has rocketed – see chart 3.

Chart 3: Goods inflation has taken off after 25 years of being negative

Chart 3_Annual PCE inflation

After initially insisting inflation was only ‘transitory’ and therefore wouldn’t require a near term response, the Federal Reserve has been forced to back down in the face of a relentless barrage of criticism from financial markets. The quantitative easing measures that were put in place at the onset of the COVID crisis are being wound back and the governor, Jerome Powell, all but confirmed the Fed will raise interest rates at their March meeting. In fact, he left the door open to multiple rate rises this year and the market is pricing in at least three.

Here in Australia the RBA has also insisted it would not be raising rates until 2024, but speculation is mounting they will reconsider that position in their meeting on February 1 and the market is pricing in four rate hikes by the end of the year.

Why has that affected the share market?

When interest rates are super low, typically so too are bond yields, which has two effects.

First, when returns from bonds are super low it’s an easier decision to invest into shares.

Second, when you value an asset, you try to work out what all its future cash flows are worth today, which is referred to as a ‘discounted cash flow’ (or DCF) valuation. To calculate a DCF, you use a ‘discount rate’, which is typically based on the 10-year bond yield. The lower the discount rate, the higher is today’s value of all those future cash flows, and vice versa. So with higher interest rates and higher bond yields, those DCF valuations will be going down.

That affects the so-called growth stocks the most because you are typically placing a much higher emphasis on earnings a long way into the future.

That’s why the NASDAQ in the US got whacked the hardest, it’s full of tech companies. In fact, there’s a bunch of the real blue-sky companies, such as Zoom, Peloton, and Zillow, that fell 60-80% from their highs of early last year.

Should we be panicking?

Definitely not. While nobody, but nobody, can tell you when this correction will end, if it hasn’t already, there are many indicators that suggest economies and companies are in good shape. After all, the fact interest rates are rising is because the economy is growing strongly. Indeed, US GDP grew at an annualised rate of 6.9% in the December 2021 quarter, the highest in more than 25 years (with the exception of the freak September 2020 quarter, which was a bounce back from the COVID lockdowns) – see chart 4.

Chart 4: US GDP growth is the highest in decades (except for the post-COVID crisis spike)

Chart 4_US GDP growth

It is entirely normal for share markets to experience a correction, with the average intra-year pullback for both the Australian and US markets being 14% – see charts 5 and 6. Last year was the exception, where the worst drawdown in the US market was only 5% and in Australia was 6%.

Chart 5: Average intra-year drawdown for the Australian market is 13.9%

Chart 5_Average intra-year drawdown

Chart 6: Average intra-year drawdown for the US market is 14%

Chart 6_Average intra-year drawdown

As inevitably happens with any correction, you may have heard or read stories quoting uber bearish market pundits forecasting the end of the world. One example is Jeremy Grantham, who was widely quoted as predicting the market will fall at least 50%. The simple fact is, Grantham has been making that call since 2013 and has been wrong the whole way.

Something we all need to be aware of is that the media loves a crisis, because they know we’re hardwired to be drawn to headlines screaming “DISASTER AHEAD”. Without doubt they turn up the noise associated with selloffs, and likewise with the recoveries. It’s best not to pay much attention to most things you read and hear in the mainstream media.

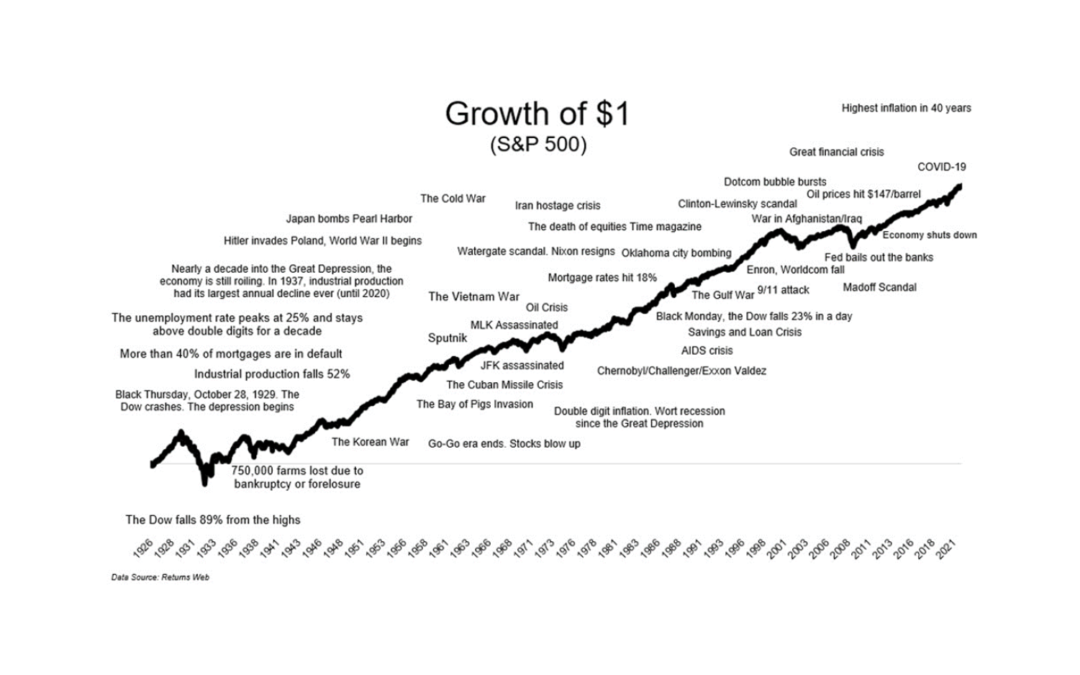
Indeed, far from panicking, it’s worth remembering corrections like the current one usually throw up interesting opportunities. Markets have a way of picking themselves up, dusting themselves off and carrying on with their journey from bottom left to top right – see chart 7. It’s interesting to look at that chart and see some of the past events that at the time seemed like we may never recover from, but we do. The current concerns about Ukraine probably fall into that bucket.

Chart 7: Markets have a way of recovering and carrying on

Chart 7_Growth of $1

In conclusion, the current correction is because of concerns that rising inflation will cause central banks to raise interest rates, which affects share valuations, especially for the more growthy stocks. Buyers already appear to be snapping up cheaper stocks, which may indicate the market has already priced in what it believes is the rate rise risk. Nobody can tell you whether this correction has run its course, but you can rest assured the market will recover.

If you have any questions about what markets are doing or how your portfolio is positioned, please call us today.

Interest rates and inflation vs reality

Interest rates and inflation vs reality

With inflation once again taking centre stage in the financial media, speculation is rife that central banks will have to respond. Conventional wisdom says the way to do that is to raise interest rates, the theory being that it moderates demand which feeds through to reduced prices. This playbook comes largely from how the US Federal Reserve dealt with the worst inflationary period of the modern era, at the end of the 1970s.

The narrative is that “Tall Paul” Volcker, the US Fed Chairman who stood 6’8”, crushed the US’s 14% inflation rate of 1980 by driving interest rates to a record high of 20%, throwing the economy into a savage recession. While he became one of the most hated men in America, by 1982 inflation averaged just 3.8% for the year. The message was clear: raising interest rates kills inflation.

Or does it? If interest rates are that powerful, how come central banks failed to increase inflation by keeping them super low for the past 10 years? There is an alternative view about inflation that begins with the premise that modern economies are incredibly complex; so complex in fact that to suggest using one single tool, the overnight cash rate, to control it is fanciful. To explore this view, it helps to have some context: a quick overview of the 1970s oil crisis.

Crude oil prices (log scale)

In the 1960s the US was largely self-sufficient for oil, and prices were kept super stable by the Texas Railroad Commission setting quotas. However, in October 1973, when the US was more dependent on foreign oil than it had ever been, especially from Saudi Arabia, OPEC declared an oil embargo against those countries that had supported Israel in the Yom Kippur War. The oil price just about tripled from US$3.60 per barrel to more than US$10 per barrel only six months later.

Oil, of course, is completely woven into modern economies, from transport, to energy production, to forming critical components of an almost endless list of manufactured products. Prices started to rise across almost all goods as producers passed on the higher input costs at each stage of production, and US inflation rates went with them, rising from an annual rate of 3.4% in 1972, to 8.7% in 1973, to 12.3% in 1974.

US annual inflation rate

By the time Jimmy Carter was elected president in 1976, oil was trading at $13.90 per barrel and  US oil imports had shot up 65% annually since 1973 to be 48% of total consumption. In 1976 the nation was consuming one-quarter of all of OPEC’s production and was woefully wasteful in its energy use, with consumption per capita 2.3 times the average for nations in the European Economic Community and 2.6 times Japan’s.

Adding to the general inflationary pressures was the US$ index (DXY, which is a weighted measure of the US$ against its major trading partners) fell from 115 in 1971 to 80 in 1977 after the US abandoned the gold standard. That meant all imports cost 30% more over that six-year period, on top of the oil price rise.

US DOLLAR INDEX 1967-2015
US dollar index 1967-2015

Then in 1978 the Iranian revolution prompted a strike at the nationalized oil refinery, reducing production from 6 million barrels per day to 1.5 million. While that only represented about 4% of global supply, the oil price jumped again to $39.50 by 1980. All told, the oil price had risen 1000% in seven years and the inflation rate hit a post-war high in 1979.

What followed, however, was a classic combination of market and regulatory responses that brought about a remarkable reversal in oil prices thanks to tectonic shifts in both supply and demand.

In 1978, Carter deregulated oil and gas prices, which prompted an increase in oil exploration and led to a huge increase in the domestic supply of energy over the following years. By the time Carter left office in 1980, foreign oil had fallen to be 40% of US consumption, a reduction equivalent to 1.8 million barrels per day, oil inventories had risen sharply and there was a surplus of gas. Then between 1980 and 1985, domestic US production increased by almost 1 million barrels a day, while imports of crude oil and petroleum products declined from 8.2 to 4.5 million barrels a day.

On the demand side, automobile fuel economy standards were introduced in 1975 that required a doubling of efficiency by 1985, and stories abounded of households yanking out their old oil burning heaters to switch to gas, which was in surplus. All in all, by 1986 the oil price had fallen more than 70% to $10.40 per barrel, aided in part by a resurgent US$ that doubled in value between 1980 to 1985.

Not surprisingly, the alternative view about how the record level of inflation in the 1970s was crushed by the mid-1980s revolves around the real world effects of a huge rise in the most critical commodity, followed by a huge decline.

While suggesting the single act of raising interest rates solved the inflation problem is an appealingly simple solution, and it may indeed have contributed, when you account for the incredible complexity of a modern economy, it shouldn’t be surprising there would be a lot more to it. Not all price increases are going to be effectively resolved by increasing the cost of money.

Professor Stephanie Kelton of Stonybrook University, a recognised advocate of MMT, puts it this way: if the Affordable Care Act (Obamacare) was to be struck down, depriving many people of health insurance and allowing insurers to price based on pre-existing conditions, it’s estimated health insurance premiums would rise by up to 30%. If that happened, it would show up in the inflation numbers. How would raising interest rates reduce that kind of inflation? Reducing people’s access to money or credit won’t drive down health costs. However, regulating the cost of health insurance would, or the cost of drugs and medical care.

In the context of our current elevated rate of inflation, much has been made of the 10-fold rise in the cost of shipping containers. Already though, there are ways that is being addressed:

  • The port of Los Angeles recently allowed containers to be stacked four high instead of two, freeing up space for ships to empty their cargo
  • Up to 70% of container space is fresh air and new software packages using AI are available to guide companies on the most efficient way to pack their goods
  • Astonishingly, container contracts are currently unenforceable, simply changing that would increase certainty for companies
  • There is a website being developed to establish a ‘secondary market’ so that companies that have spare container space can put it on the market

These are practical ways of reducing pricing pressures that simply raising interest rates, which can only change the price of money, could not achieve.

The conventional view that the way to fight inflation is by central banks increasing interest rates arguably stems from a misinterpretation of correlation and causation dating back to the 1980s. Interest rates undoubtedly have a role to play in managing a modern economy, especially with respect to house prices where a high proportion of transactions rely on borrowing money. As for the rest of this very complex economy, a better approach could be to see them as part of the solution.

Want to discuss your investment strategy with a specialist? Call us today.

Investors on tenterhooks over inflation

Investors on tenterhooks over inflation

A frustrated US President Harry Truman apparently pleaded for someone to find him a one-handed economist, so he wouldn’t constantly be told “on the other hand”. Right now, inflation is at the centre of ongoing debate among economists with opposing views that are critical for financial markets.

Why is it critical? It’s a broadly accepted tenet of financial markets that low inflation supports higher asset valuations, such as higher PE (price to earnings) ratios. Likewise, the lower inflation is, the lower long-term bond yields are, which means the discount rate used to calculate a discounted cash flow (DCF) valuation is lower, which results in higher asset valuations.

Low inflation has provided a powerful tailwind to the post-GFC bull market in global equities. The Australian ‘core’ inflation measure, which strips out the effect of the more volatile prices like food and energy, peaked at about 4.8 per cent in 2008 and trended down to 1.1 per cent in 2020. In the US, core CPI has varied around 2 per cent for most of the post-GFC period, while in Europe it’s been around 1 per cent.

Financial markets are concerned that a meaningful rise in inflation will force central banks to raise interest rates, which will flip the story to a serious headwind. The potential PE de-rating would hit the higher priced tech stocks especially hard, meaning the US share market would be particularly vulnerable. And as the old saying goes about America sneezing…

So why the concern now? Inflation measures around the world have spiked this year. Australia’s headline CPI rate jumped from 1.1 per cent in the March quarter, to 3.8 per cent in June, and in the US the CPI leaped from 1.7 per cent in February to a 13-year high of 5.4 per cent in July. While the respective core rates were lower, nevertheless they too saw a substantial jump.

What has economists divided though, is whether this spike is transitory and inflation will drop back down, as the central banks argue, or structural and so will continue to rise.

On the one hand, the transitory camp argues that because prices collapsed after multiple countries locked down between March and June last year, it was always going to look like a huge increase this year after those same prices had largely recovered.

An excellent example of this is the oil price. Over the year to Australia’s June 2021 CPI figure, the oil price increased 200 per cent, from $25 per barrel to $75. Automotive fuel prices rose 27 per cent over that same period, which, by itself, added about 1 per cent to the overall 3.8 per cent increase in the CPI. If fuel prices stay the same for the next 12 months, and nothing else changes, inflation should drop back to 2.8%.

Likewise, May saw the largest year on year increase in the US CPI since 1992, but three categories that comprise about 5 per cent of the core CPI drove 50 per cent of the monthly increase, and they were all associated with transport and mainly reflected used car prices jumping by almost 50 per cent over the year.

Proponents of the transitory view point to the 10-year government bond yield, which, at 1.25 per cent, shows the financial markets are sanguine about the prospects of higher inflation. Sceptics argue that simply reflects the heavy involvement of central banks.

On the other hand, the economists arguing inflationary pressures are likely to persist point to the sweeping changes many companies are making to supply chains as they prioritise security of supply over cost, undermining the disinflationary effects of globalisation. Also, rising wage pressures, more so in the US than Australia, will increase aggregate demand and could force companies to increase prices. Finally, some argue once the acceptance of rising prices is entrenched, it becomes a self-fulfilling prophecy.

Inflation is awesomely complex and there is no cogent, complete model for it. Research by Ulrike Malmendier, Professor of Economics at Berkeley, shows peoples’ inflationary expectations are shaped by their lifetime experiences, regardless of their level of expertise. So those economists that lived through the stagflation of the 1970s might therefore be expected to be more cautious than those who didn’t. Smart investors will be well advised to watch carefully for inflation, but as usual, it’s likely the markets will pick it up well before we do.

How to pay off your mortgage sooner and accelerate building your wealth

How to pay off your mortgage sooner and accelerate building your wealth

For most people, their mortgage will be the largest debt they will have in their lifetime. Because there are no tax benefits on this type of debt, it’s worth considering paying it off (or at least partially down) quickly so can make the most of the opportunity to accumulate wealth outside the home.

So, here are a few tips which can help you get that mortgage down.

1. Get the right loan from the start

There are so many factors to consider when deciding which is the most appropriate loan. And the loan your friend has may not be the best loan for you. Just like the loan with the lowest advertised interest rate could cost you more in the long term.

2. Understand how to use your loan

Once you have gone to the effort of structuring your loan correctly, it’s important that you know how to get the most benefit out of it. For example, an ‘offset’ account may not help you pay your home loan quicker unless you have the discipline to use it as it should be used.

3. Increase your repayments – every dollar helps!

Whether it be a lump sum payment or increasing your monthly repayments, every extra dollar will result in a saving to your interest cost and thus will reduce the time to repay your mortgage. At a 2.5%pa interest rate, an additional $200 per month repayment on the average mortgage will save approx. $30,000 in interest costs. At a 4.5% interest rate, this increases to approximately $60,000 in interest costs

4. Work on your loan early

During the early years, a higher proportion of your loan repayments are going towards paying the interest expense, with a smaller portion reducing your principal owed. So, commiting to make larger additional/lump sum repayments during the initial years of your loan will repay a larger amount of the principal and so will save on the interest costs.

5. Ask your bank for a discount

You’ll be surprised with the reduction you may get on your interest rate if you just ask.

6. Better still use a pro-active mortgage broker

A great mortgage broker is invaluable. From recommending the best loan specifically for you, to explaining how to best utilize it to getting on the front foot and asking the financial institution for a discount. Our lending manager, Cameron Purdy was able to secure our client a further discount 18 months into her loan by simply getting on the front foot and negotiating with bank. It resulted in a saving of over $900 per month!

7. Build Wealth while accelerating your mortgage repayments

A ‘debt recycling’ strategy enables you to simultaneously pay off your home loan sooner, while building an investment portfolio.

So rather than wait until you pay off your loan before commencing the build up of your wealth/investments, you can start doing it now!

And while the investment portfolio is growing, the income it generates is directed towards the home loan acting as another source of repayments and accelerating the time taken to be mortgage free!

Debt recycling is an extremely effective strategy and while popular among many professionals, it is something all who have a mortgage should consider.

Download out free eBook to learn more about how debt recycling strategies allow you to start investing for the future now whilst continuing to pay off your home loan.

Australian residential property is on fire!

Australian residential property is on fire!

The latest statistics coming out of the Australian residential property market indicate we’re seeing a remarkable rebound, with approvals and finance applications soaring and prices likely to follow. For now, the real driver is free standing houses being bought by owner occupiers.

Record construction approvals

Approvals to construct new houses jumped 15.8% in December to a record high, with strength seen right across the country. CBA’s economics unit pointed out that compared to December 2019, housing approvals rose “an incredible 55%” – see chart 1.

Chart 1: Dwelling approvals were strong across the whole of Australia

Blog chart 1

While apartment approvals are nowhere near as impressive, being 19% below a year ago, they are still 44% above the low point reached in June last year when the market had been crushed by national COVID lockdowns and forecasts were for housing markets to collapse.

Residential propery prices expected to follow

While CoreLogic reports that national home prices have risen a relatively modest 1.5% compared to a year ago, with Sydney up 2% and Melbourne down 2.2%, those markets that have enjoyed less COVID disruption were stronger: Perth was up 3.7%, Brisbane 5.3% and Adelaide 6.7%.

 However, given weekly auction clearance rates and loan applications tending to be a reasonable leading indicator for house prices, the outlook for prices, especially for free standing homes, appears to be very positive. Clearance rates have roared to a four-year high – see the chart 2 below – and the value of new housing loan commitments in December jumped 9% to hit a record high of $26 billion, putting it 31% higher than a year ago.

Chart 2: Auction clearance rates have hit a four year high

Blog chart 2

Chart 3: Owner occupier borrowing has shot up

Blog chart 3

UBS forecasts Australian house prices will rise by 10% in 2021, while CBA is calling for an 8% increase.

Perfect storm

What we’re seeing is the culmination of various factors that, when combined, amount to a huge tailwind for the property market.

Interest rates: the Reserve Bank has cut cash rates to an all-time low of 0.1% and indicated they have no intention of raising them any time soon. Borrowers could have two to three more years of super low interest rates up their sleeve.

In addition, the big banks are benefiting from the Reserve Bank’s Term Funding Facility that enables them to borrow a total of $200 billion for home lending at the same rock bottom rate of 0.1%.

Banks have responded by offering fixed rate loans as low as 1.75%, with no fewer than 25 different loans currently below 2%. Not surprisingly, fixed rate loans now account for 40% of new loans, up from 15%.

Relaxed lending standards: In October last year the government announced the removal of the bank regulator’s responsible lending laws, which required banks to undertake thorough due diligence on a borrower’s capacity to repay a loan. The Treasurer said at the time the move was aimed at providing easier access to credit to help Australia’s recovery from its first recession in more than 30 years.

Stimulus spending: the stimulus packages announced in the wake of the COVID pandemic by the Australian government added up to 13% of GDP – newly created money shoved into the economy. That saw household savings jump to an almost 60-year high in June last year – see chart 4.

Chart 4: Household savings hit an almost 60-year high

Blog chart 4
A huge portion of those savings were bound to find their way into the economy through consumer spending, which we saw in the December quarter last year when the CBA Economics Unit said spending on their bank’s credit cards was 11% higher than the year before.

HomeBuilder Grant: the Federal Government also announced grants of $25,000 to qualifying borrowers who were either buying or renovating a home to live in. By the end of 2020, 75,000 applications had been received, blowing past the government’s forecast of 30,000. The scheme has been extended until March, although it’s been reduced to $15,000.

Stamp duty concessions: New South Wales and Victoria announced stamp duty concessions of between 25-50% on residential property purchases up to $1 million.

Job security: thanks largely to the stimulus juicing the economy, the NAB Business Survey shows business confidence and business conditions have rebounded to be well above their average for the last 30 years. That’s in turn prompted the labour participation rate to jump to a 35-year high and the underemployment rate to drop to its six-year average, while job vacancies are at the highest for at least 12 years.

Not as great for investors

While property prices are tipped to do well over the course of 2021, rental markets are not looking  as promising for property investors.

Nationally, CoreLogic reports rental rates went up by just over 1% for the year to the end of January 2021. That means they failed to keep pace with property prices, meaning the yield on an investment property, already notoriously low in Australia, was even worse.

Rents in apartments were markedly worse, possibly reflecting a sharp fall in international students and immigrants. In Melbourne, unit rents dropped 8% over the past year while in Sydney it was 6%.

Key takeaways

  • For those looking to buy a home, the market looks set to rise over this year.
  • While capital gain for investors is always attractive, there may well be risks in finding a tenant at current market rates.
  • Qualifying borrowers can still benefit from the federal government’s HomeBuilder grant until March.
  • For those looking to borrow to buy a home, rates are at all-time lows.
  • For those already with a mortgage, now is a great time to refinance.

Looking to buy a residential property or refinance your existing home?

Call Steward Wealth today on (03) 9975 7070 to find out how we can help you achieve a highly competitive home loan rate.