January saw the biggest correction in financial markets since the COVID selloff in February 2020. What happened? What caused it? And what’s the outlook?
The numbers
Share markets across the world declined over the month of January. The table below shows how far different markets fell from their recent highs, which in some cases was late December and in others was early January, and how they ended up on 31 January compared to the same recent high.

It is striking the extent to which some markets have already bounced back, although it is too early to declare the correction is necessarily over.
What caused the selloff?
The selloff started because markets expect central banks to increase interest rates in response to rising inflation.
Australia’s inflation rate hit 3.5% in the December quarter of last year, after 3.8% in the September quarter, the highest in the post-GFC period.
However, it’s the US, where the CPI hit 7% in December last year, the highest since 1982, that has markets really spooked. Some of the year over year price rises include energy +29%, gasoline +50%, used cars and trucks +37%, plus food and shelter costs rose sharply as well.
Exactly what causes inflation is always tricky to work out, but this time it’s easy to point to at least one major contributor. The US government injected COVID stimulus equivalent to 25% of GDP, which saw personal incomes increase massively at a time when companies had sharply reduced forward orders in anticipation of a drop in demand. While spending initially dropped, it bounced back quickly – see chart 1.
Chart 1: US personal income increased sharply with government stimulus and spending followed soon after

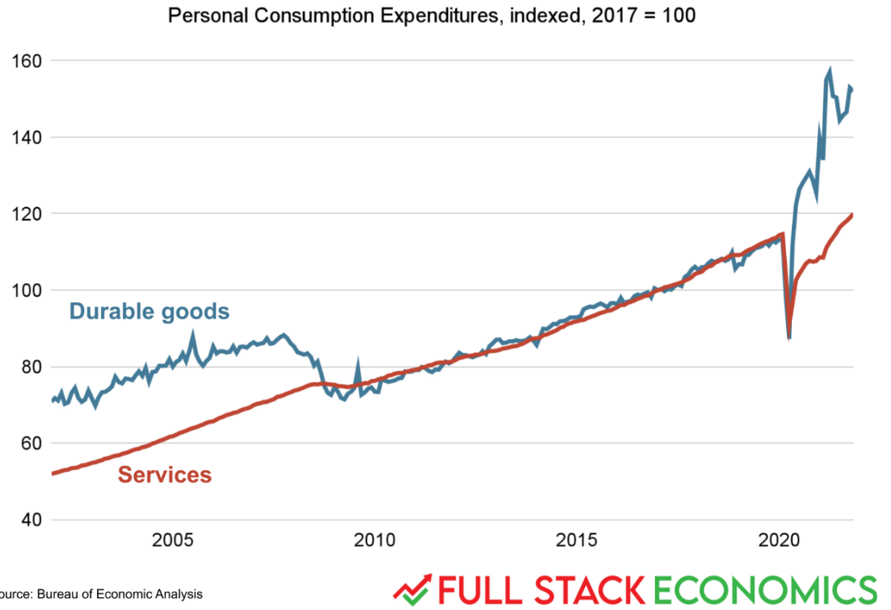
Because people were in lockdown, spending on services plummeted and has only slowly recovered, but spending on goods exploded – see chart 2.
Chart 2: Spending on goods rocketed when people were in lockdown
A lot of those goods being bought had to be imported from Asia, however, at the same time, a chronic shortage of shipping containers saw prices jump from US$3,000 for a container from China to the US, to as high as US$20,000. Then there was the problem that a lot of US transport workers were either calling in sick or quitting their low-end service jobs, so supply chains quickly got clogged up, from ports to warehouses.
Semiconductors quickly became scarce and auto manufacturers, who had cancelled contracts with the semiconductor manufacturers, were left with tens of thousands of almost finished cars at a time when demand for new and used cars took off. Consequently, car prices jumped.
Then US companies reported record margins at the end of the year, so evidently they seized the opportunity to raise prices and pass them on to consumers.
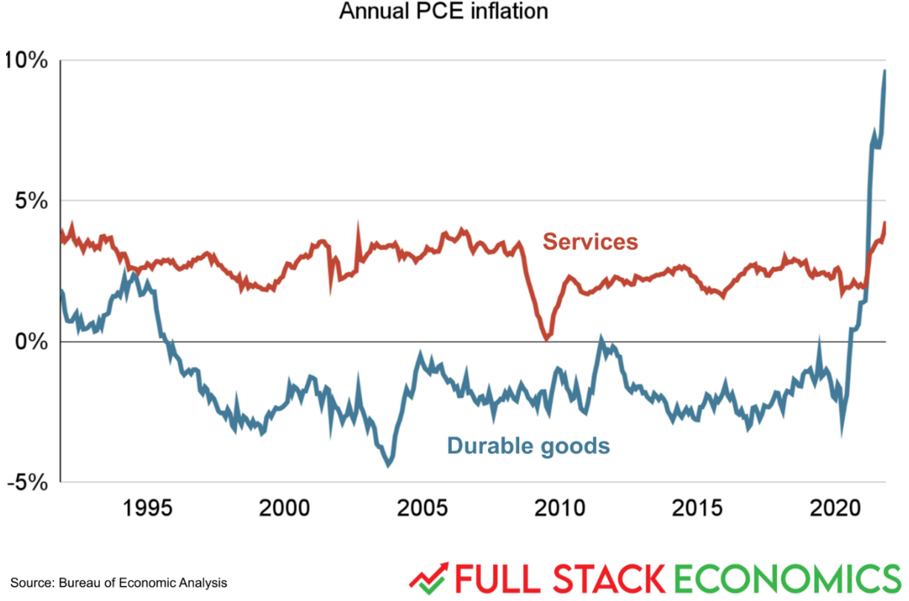
The upshot, goods inflation, having been negative for the past 25 years thanks mainly to technological advances and low wages growth, has rocketed – see chart 3.
Chart 3: Goods inflation has taken off after 25 years of being negative
After initially insisting inflation was only ‘transitory’ and therefore wouldn’t require a near term response, the Federal Reserve has been forced to back down in the face of a relentless barrage of criticism from financial markets. The quantitative easing measures that were put in place at the onset of the COVID crisis are being wound back and the governor, Jerome Powell, all but confirmed the Fed will raise interest rates at their March meeting. In fact, he left the door open to multiple rate rises this year and the market is pricing in at least three.
Here in Australia the RBA has also insisted it would not be raising rates until 2024, but speculation is mounting they will reconsider that position in their meeting on February 1 and the market is pricing in four rate hikes by the end of the year.
Why has that affected the share market?
When interest rates are super low, typically so too are bond yields, which has two effects.
First, when returns from bonds are super low it’s an easier decision to invest into shares.
Second, when you value an asset, you try to work out what all its future cash flows are worth today, which is referred to as a ‘discounted cash flow’ (or DCF) valuation. To calculate a DCF, you use a ‘discount rate’, which is typically based on the 10-year bond yield. The lower the discount rate, the higher is today’s value of all those future cash flows, and vice versa. So with higher interest rates and higher bond yields, those DCF valuations will be going down.
That affects the so-called growth stocks the most because you are typically placing a much higher emphasis on earnings a long way into the future.
That’s why the NASDAQ in the US got whacked the hardest, it’s full of tech companies. In fact, there’s a bunch of the real blue-sky companies, such as Zoom, Peloton, and Zillow, that fell 60-80% from their highs of early last year.
Should we be panicking?
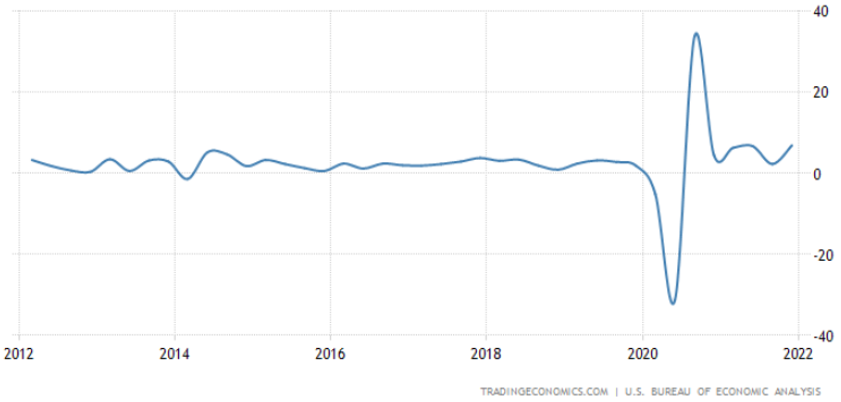
Definitely not. While nobody, but nobody, can tell you when this correction will end, if it hasn’t already, there are many indicators that suggest economies and companies are in good shape. After all, the fact interest rates are rising is because the economy is growing strongly. Indeed, US GDP grew at an annualised rate of 6.9% in the December 2021 quarter, the highest in more than 25 years (with the exception of the freak September 2020 quarter, which was a bounce back from the COVID lockdowns) – see chart 4.
Chart 4: US GDP growth is the highest in decades (except for the post-COVID crisis spike)
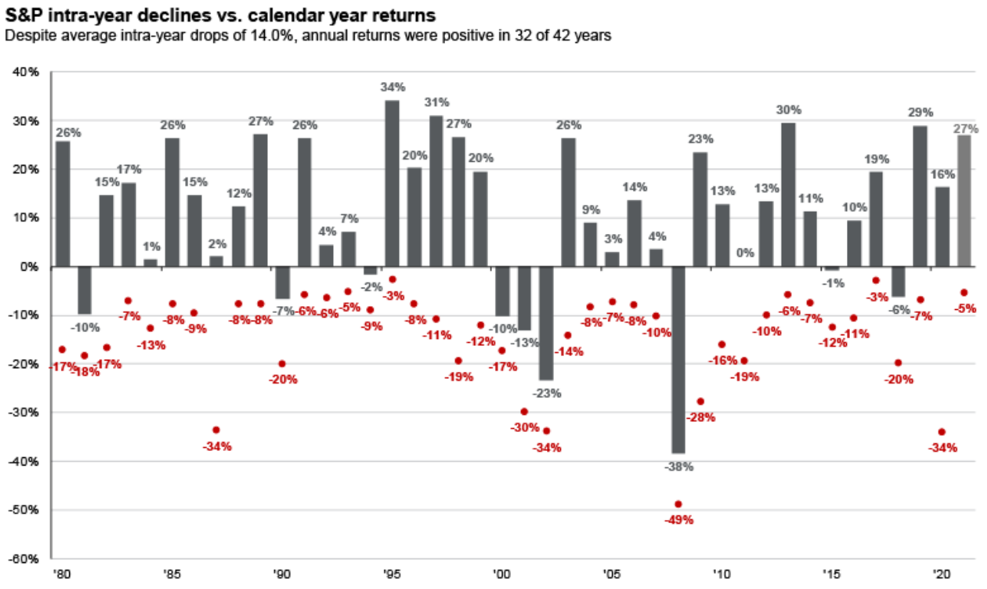
It is entirely normal for share markets to experience a correction, with the average intra-year pullback for both the Australian and US markets being 14% – see charts 5 and 6. Last year was the exception, where the worst drawdown in the US market was only 5% and in Australia was 6%.
Chart 5: Average intra-year drawdown for the Australian market is 13.9%
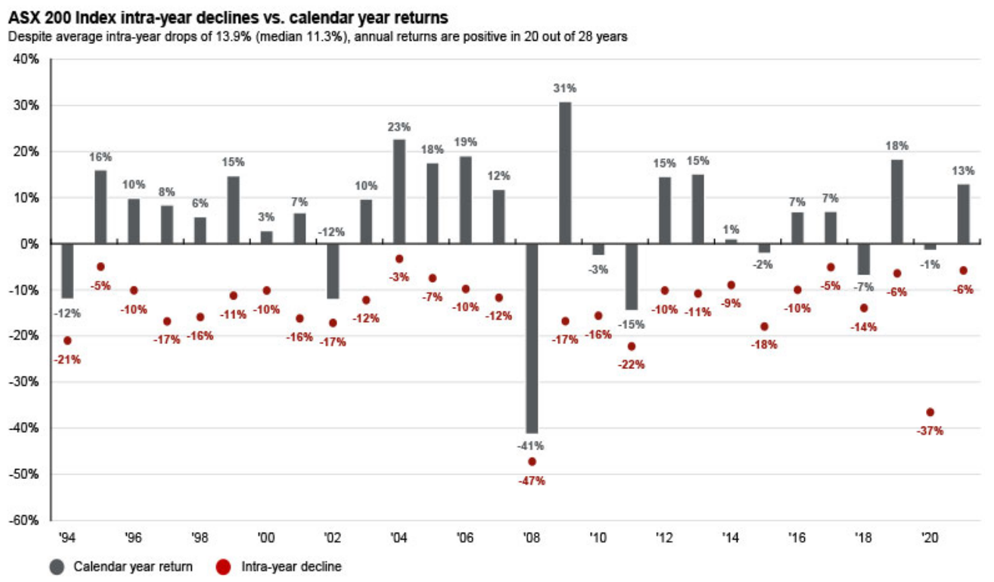
Chart 6: Average intra-year drawdown for the US market is 14%
As inevitably happens with any correction, you may have heard or read stories quoting uber bearish market pundits forecasting the end of the world. One example is Jeremy Grantham, who was widely quoted as predicting the market will fall at least 50%. The simple fact is, Grantham has been making that call since 2013 and has been wrong the whole way.
Something we all need to be aware of is that the media loves a crisis, because they know we’re hardwired to be drawn to headlines screaming “DISASTER AHEAD”. Without doubt they turn up the noise associated with selloffs, and likewise with the recoveries. It’s best not to pay much attention to most things you read and hear in the mainstream media.
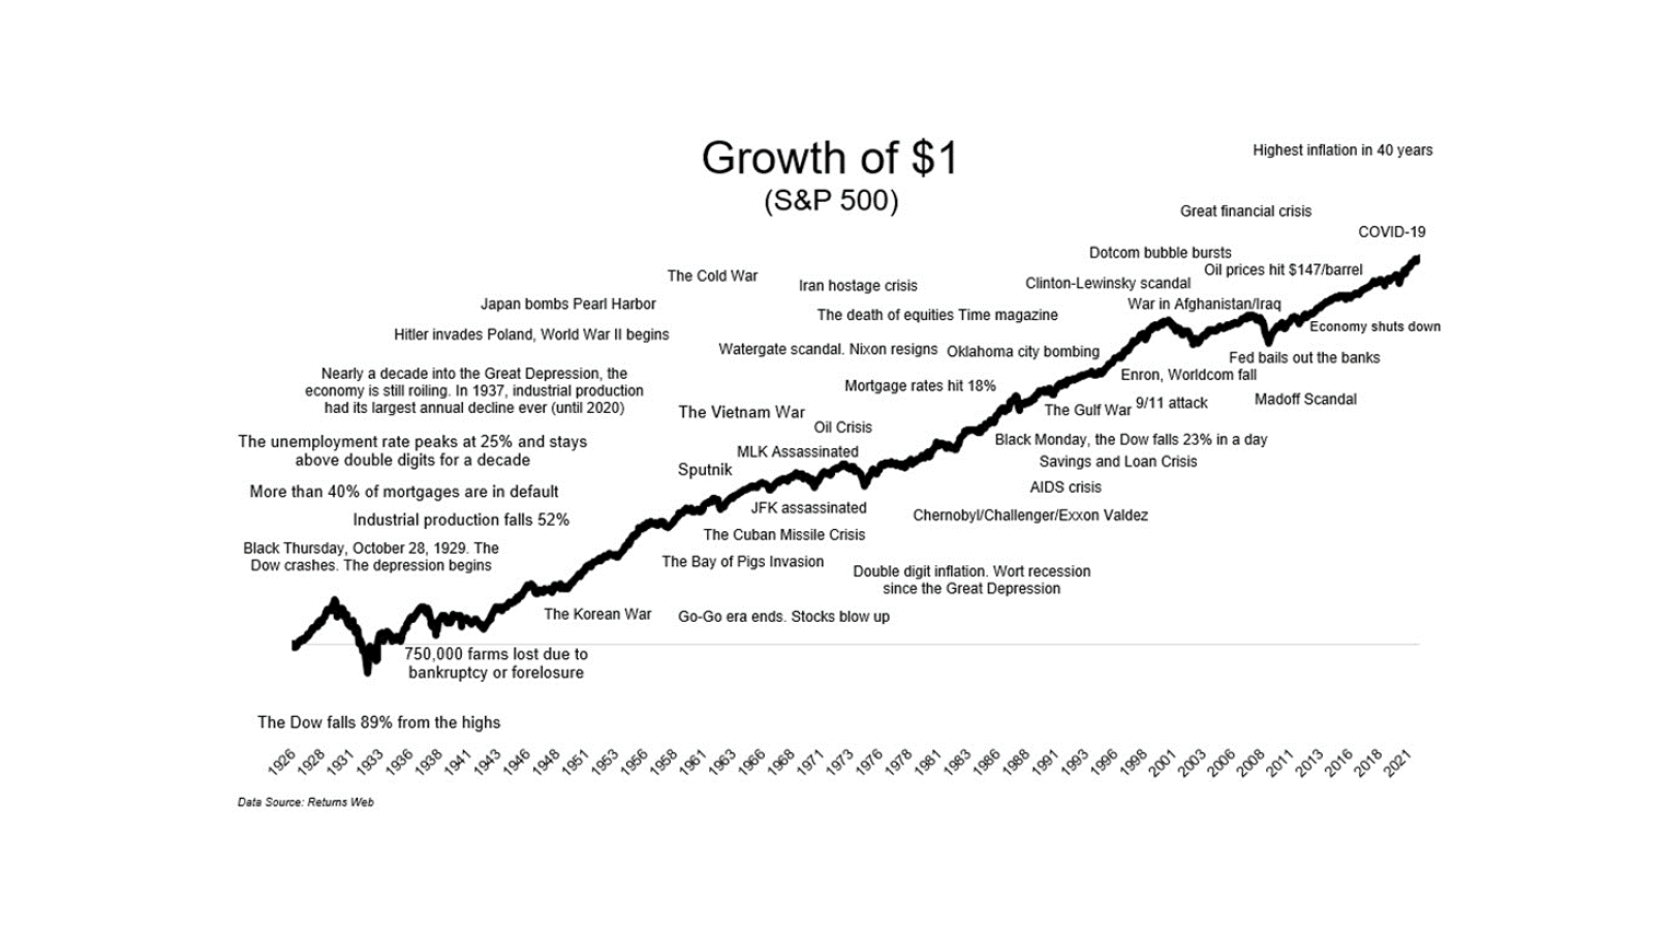
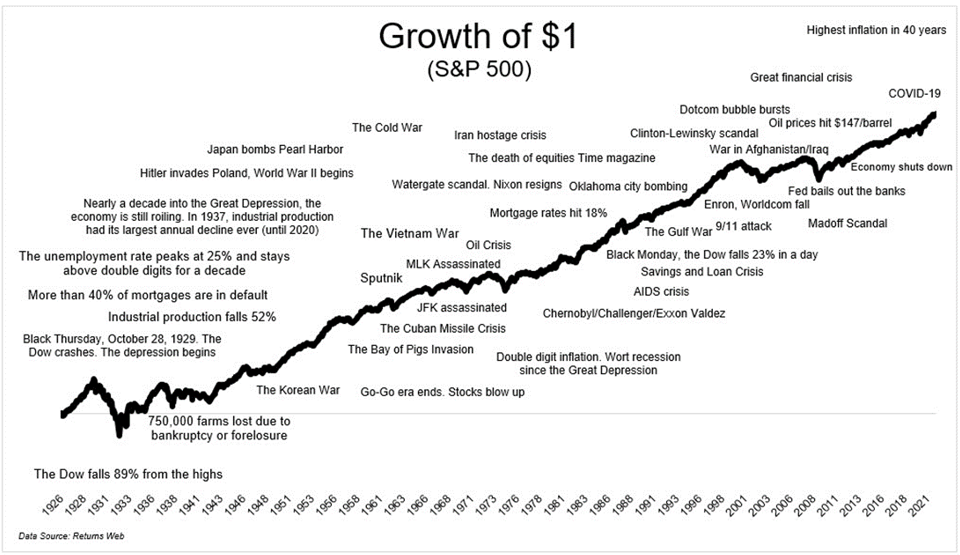
Indeed, far from panicking, it’s worth remembering corrections like the current one usually throw up interesting opportunities. Markets have a way of picking themselves up, dusting themselves off and carrying on with their journey from bottom left to top right – see chart 7. It’s interesting to look at that chart and see some of the past events that at the time seemed like we may never recover from, but we do. The current concerns about Ukraine probably fall into that bucket.
Chart 7: Markets have a way of recovering and carrying on
In conclusion, the current correction is because of concerns that rising inflation will cause central banks to raise interest rates, which affects share valuations, especially for the more growthy stocks. Buyers already appear to be snapping up cheaper stocks, which may indicate the market has already priced in what it believes is the rate rise risk. Nobody can tell you whether this correction has run its course, but you can rest assured the market will recover.

