So far, 2021 has been another year of stellar stock market returns across the developed world. To the end of November, the Australian share market has delivered 14 per cent, the US 25 per cent, and even dusty old Europe has managed to rise 14 per cent, with the only real laggard being the emerging markets, which have struggled under the deadweight of a Chinese market coming to terms with new regulatory concerns, returning 8 per cent.
As we approach the end of the year, it’s an opportune time to take stock of what the drivers of those strong returns have been and the likelihood of them being sustained.
At the heart of the global economic bounce back over the past 12 months, and helping to underwrite the strong financial markets, was the massive government stimulus payments to compensate for the expected drag from COVID. The OECD estimates governments around the world spent more than $19 trillion combined on COVID-related support programs. You have to go back to global wartime to find a comparable period of fiscal spending.
All that money has to go somewhere, and whilst some of it has been saved, much entered the economy and inevitably found its way into company revenues. Australian companies reported close to record earnings growth of more than 26 per cent for F2021 and paid out a record total of $67 billion in dividends. In the US, analysts are forecasting companies to report 40 per cent earnings growth over this calendar year and globally it’s an amazing 48 per cent.
Over the long run, earnings growth is the principal driver of share prices, and Citigroup’s forecast for global earnings growth drops to a far more typical 8 per cent for 2022.
There are also short-term drivers of share prices. In what’s come to be known as the ‘TINA’ effect (There Is No Alternative), money has flooded into equities chasing higher potential returns than what’s on offer through anaemic bond yields.
According to Bank of America Merrill Lynch, rolling 12 month flows of money into equity funds topped more than $1.5 trillion earlier this year, almost four times its previous highest peak. Incredibly, the $1.25 trillion invested into equities funds between January and November this year is more than the total amount over the same period for the previous 19 years combined!
That remarkable amount of liquidity has also underwritten a record year for global initial public offerings (IPOs), or company floats, worth more than $830 billion.
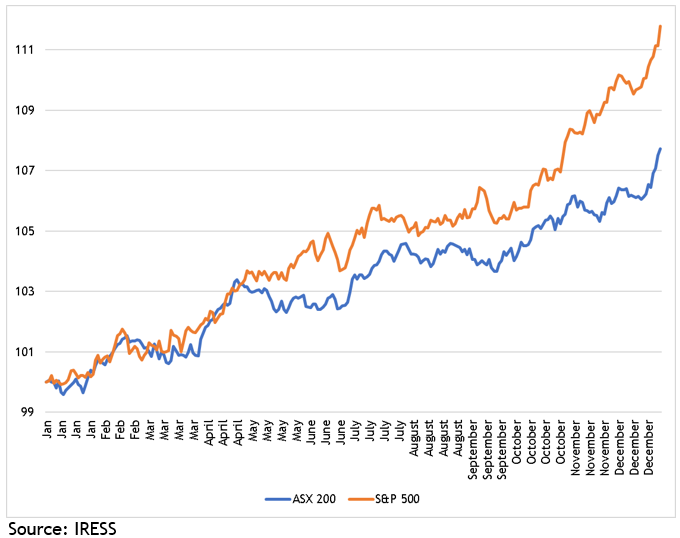
Another short-term driver is referred to as ‘seasonality’, which is the average performance of stock markets over a year. If you look over a long enough period it becomes apparent that money flows follow a pattern. The chart shows the Australian share market tends to experience a rally around April and October each year, which is after dividends have been paid, and for both the Australian and US markets, the December quarter is normally the strongest.
Seasonality of the Australian and US share markets, 1991-2020

Another influence on share markets has been the reluctance of central banks to temper their super accommodative monetary policy, despite coming under concerted pressure from the bond market in the face of sharply higher inflation data.
Although the Reserve Bank of Australia abandoned its quantitative easing policy, it has retained a record low cash rate of 0.1 per cent and insists it’s not even close to raising it. Meanwhile, the US Federal Reserve has kept both its low rates and its QE program in place, and likewise assures markets it’s in no hurry to tighten.
As always, like placard waving protesters, there are bears who are keen to spoil the party. Valuations have undoubtedly become a lot more stretched over the year, and amazingly the total market capitalization of US companies with a price to sales ratio of more than 20 times has rocketed from about US$300bn to more than US$4.5 trillion in just the last 18 months, a level 25 per cent above the notoriously bubbly dotcom boom of 2000.
So, between the biggest peacetime government spending program in history and the lowest cash rates in history, perhaps it’s not surprising share markets have done very well this year, until you throw in that it’s happened during the worst global pandemic in a century. It makes you wonder what 2022 holds in store.


