Why you’ll make more by focusing on a portfolio’s total return

Why you’ll make more by focusing on a portfolio’s total return

Article featured in the AFR

Australians love their dividends. And what’s not to love? Those semi-annual dividend deposits are one of the great benefits of investing in a capitalist society.

John D. Rockefeller famously said, “Do you know the only thing that gives me pleasure? It’s to see my dividends coming in”.

One of the most popular strategies for investors, especially retirees, is to buy high dividend paying shares with the aim of generating sufficient income to live on while hopefully leaving the portfolio principal intact.

While this holds obvious appeal, particularly for investors who are anxious about outliving their money, and benefits from dividends typically being far more predictable than earnings, it is a very constricting approach and carries some risks.

High dividend paying companies tend to offer lower growth. Clearly, if a company is paying generous dividends, it leaves less income to reinvest into the company’s operations. While it’s by no means a universal rule, if a company is able to generate a high return on the equity invested into the business it makes more sense for management to do that rather than pay it out as dividends.

That means a portfolio full of high dividend paying companies is less likely to provide as much capital growth as a more diversified portfolio. If the strategy is to maintain the portfolio’s capital value, then that may not be reason to lose sleep, but over time, it does mean the portfolio won’t benefit as much as it may from the share market’s long history of growth. This is especially true during a period like we saw between 2009-2021 where growth-oriented companies outperformed strongly.

An alternative strategy for investing a portfolio can be to take what’s referred to as a ‘total return approach’, which takes account of both income as well as capital growth. The key to this strategy is to feel comfortable meeting target income requirements by paying a ‘dividend’ from the portfolio by harvesting some of the long-term capital gains.

In other words, imagine an investor with a $1 million investment portfolio who needs $60,000 per year to cover living expenses. If the portfolio generates income of $40,000, they would make up the balance by selling $20,000 worth of investments each year.

To illustrate the benefits of a total return approach, let’s presume it’s the start of 2012 and two investors each have $100,000 to invest as part of a larger overall portfolio. The first buys $100,000 worth of Telstra shares, which were trading on a prospective dividend yield of an amazing 12 per cent, including franking benefits.

The second buys $100,000 worth of CSL shares, which were trading on a prospective yield of a modest 2.6 per cent. However, they decide to sell as many shares as required at the end of each year to bring the total ‘income’ to $12,000 (to match the Telstra yield).

How did the two strategies stack up over 10 years to the very end of 2021? The Telstra shares will have delivered a total of $103,721 of income, but for the last four years the investor was forced to sell a total of $20,255 worth of shares to maintain the $12,000 targeted income. The closing value of the holding was $100,761, so the total return was $124,737 (i.e. net of the initial investment of $100,000) for a compounded annual return of a still respectable 8.4 per cent.

For our other investor, despite having to sell a total of $70,179 worth of CSL shares over the 10 years in order to meet the $12,000 per year income requirement, the closing value of $709,109 plus that $120,000 of ‘income’ delivered a total return of $729,109, or a compounded annual return of 23.6%.

Clearly you could hardly choose a more favourable pair of stocks to illustrate the point, but if the first investor had split the $100,000 equally between the big four banks for a target annual income of $10,000, after 10 years the total return would have been $146,498 or 9.4 per cent per year.

The same investment into the iShares S&P 500 ETF (IVV) and again selling shares to fund the required ‘income’, would have delivered a total return of $371,122, or a 19 per cent annual return.

Source: MarketIndex.com, Steward Wealth

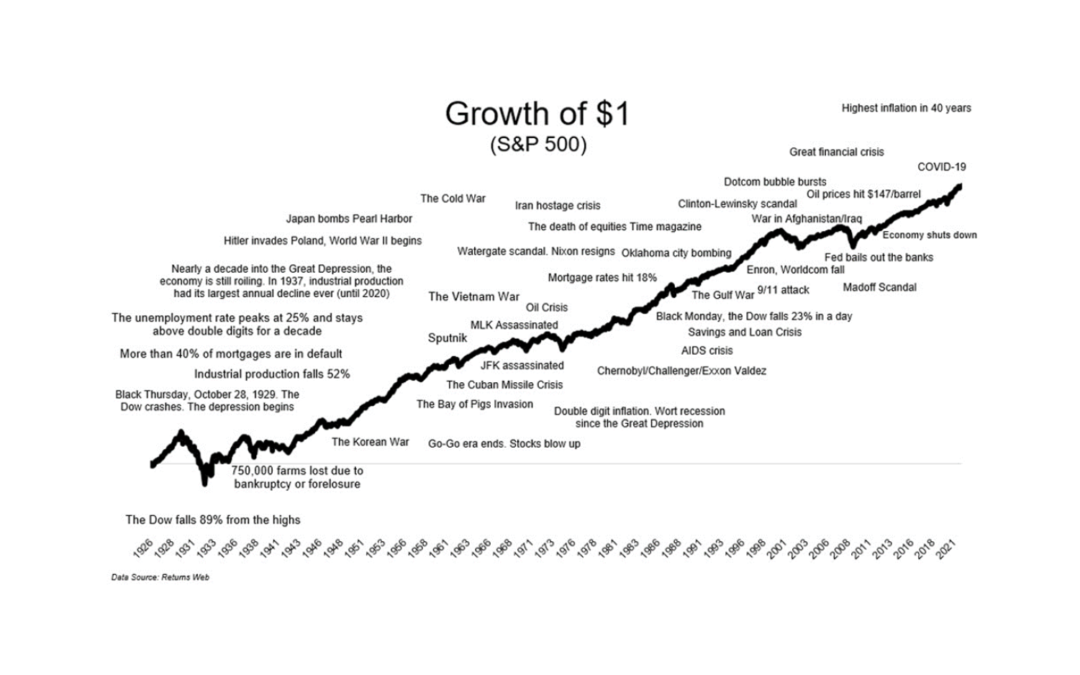
With shares now on sale, smart investors should be mindful of constructing a diversified portfolio that benefits not only from those welcome dividend deposits, but from the inexorable long-term growth that share markets have to offer.

Want to discuss your investment strategy with a specialist?

Why banning short selling is a bad idea

Why banning short selling is a bad idea

The experience of a nasty share market sell off can be made even more stressful for an investor who learns their beloved shares are being short sold by rapacious hedge funds and gun slinger traders. Not surprisingly, with many share markets around the world enduring their worst start to a calendar year for decades, suggestions to ban short selling have resurfaced again.

But research shows such bans are not only ineffective at stopping share price declines, they can even be counterproductive.

Short selling is where an investor sells shares that they don’t yet own, so it’s essentially the reverse of normal share trading. The reason they would do that is because they believe the share price is going to fall, and the profit they stand to make is the difference between the selling price and the price they buy the shares back at. So, if a share is sold at $15 and bought back at $10, the profit is $5, or 33 per cent.

The practice of short selling is often seen as predatory, and the traders who do it as no better than vultures. At the height of the GFC, short selling was banned on various international stock exchanges, including the US, UK and Australia, in an effort to improve market confidence and reduce volatility. ASIC eventually limited the ban to short selling financial stocks.

Then in response to the sharp stock market falls in March 2020, at least seven countries banned short selling again.

However, a number of studies carried out after the GFC to analyse the effectiveness of banning short selling concluded it had little effect on prices but did reduce market efficiency. For example, in 2011 the Federal Reserve Bank of New York concluded that “banning short selling does not appear to prevent stock prices from falling”, but instead “lowered market liquidity and increased trading costs”. The European Systematic Risk Board reached similar conclusions.

The increased trading costs were attributed to the buy-sell spreads on shares widening, in other words, investors paid higher prices to buy or received lower prices when selling. Other studies have found that being able to readily short sell is associated with markets that are more technically capable and boast higher turnover, which is generally seen as a proxy for better ‘liquidity’, that is, the ease with which investors can trade.

Indeed, in an interview at the end of 2008, when the then chairman of the US Securities Exchange Commission was asked about the success of their short selling ban, he said “knowing what we know now, I believe on balance the commission would not do it again.”

In a sophisticated stock market like Australia’s, short selling plays a critical role for many funds that hedge their risk. For example, a ‘market neutral’ fund aims to drastically reduce the volatility of its returns by pairing long positions against short positions and ‘long-short’ funds will use short selling to either protect investors’ capital and/or increase returns.

Funds like these can produce terrific results for their investors, which include mums and dads and SMSFs. For example, one of Australia’s leading long-short funds has a record, over the long-term, of not participating in market falls but capturing all of the market rises.

Because the ASX reports short selling on a stock by stock basis, it doesn’t reflect that most short selling has a corresponding long position paired with it. For example, a fund might buy BHP and hedge the position by selling RIO, not because they think RIO will necessarily go down, but simply that it will underperform BHP.

As for predatory short selling, that is very difficult in Australia because all short positions have to be ‘covered’, meaning the seller has to borrow shares from an existing holder, which incurs costs. So the risk of a hedge fund attacking a small cap company is greatly reduced because borrowing shares in small companies is much harder and more expensive.

Share prices eventually always reflect fundamentals. Successful short selling requires skill, just like successful long investing does. If an investor has the skill to identify that a company’s share price doesn’t match its fundamentals, then it makes sense they should be able to profit from that knowledge. And modern share markets do smart investors a disservice if they ban it.

The January correction explained

The January correction explained

January saw the biggest correction in financial markets since the COVID selloff in February 2020. What happened? What caused it? And what’s the outlook?

The numbers

Share markets across the world declined over the month of January. The table below shows how far different markets fell from their recent highs, which in some cases was late December and in others was early January, and how they ended up on 31 January compared to the same recent high.

The numbers_image1

It is striking the extent to which some markets have already bounced back, although it is too early to declare the correction is necessarily over.

What caused the selloff?

The selloff started because markets expect central banks to increase interest rates in response to rising inflation.

Australia’s inflation rate hit 3.5% in the December quarter of last year, after 3.8% in the September quarter, the highest in the post-GFC period.

However, it’s the US, where the CPI hit 7% in December last year, the highest since 1982, that has markets really spooked. Some of the year over year price rises include energy +29%, gasoline +50%, used cars and trucks +37%, plus food and shelter costs rose sharply as well.

Exactly what causes inflation is always tricky to work out, but this time it’s easy to point to at least one major contributor. The US government injected COVID stimulus equivalent to 25% of GDP, which saw personal incomes increase massively at a time when companies had sharply reduced forward orders in anticipation of a drop in demand. While spending initially dropped, it bounced back quickly – see chart 1.

Chart 1: US personal income increased sharply with government stimulus and spending followed soon after

Chart 1_Trillion of chained 2012 dollars

Because people were in lockdown, spending on services plummeted and has only slowly recovered, but spending on goods exploded – see chart 2.

Chart 2: Spending on goods rocketed when people were in lockdown

Chart 2_Personal Consumption Expenditures

A lot of those goods being bought had to be imported from Asia, however, at the same time, a chronic shortage of shipping containers saw prices jump from US$3,000 for a container from China to the US, to as high as US$20,000. Then there was the problem that a lot of US transport workers were either calling in sick or quitting their low-end service jobs, so supply chains quickly got clogged up, from ports to warehouses.

Semiconductors quickly became scarce and auto manufacturers, who had cancelled contracts with the semiconductor manufacturers, were left with tens of thousands of almost finished cars at a time when demand for new and used cars took off. Consequently, car prices jumped.

Then US companies reported record margins at the end of the year, so evidently they seized the opportunity to raise prices and pass them on to consumers.

The upshot, goods inflation, having been negative for the past 25 years thanks mainly to technological advances and low wages growth, has rocketed – see chart 3.

Chart 3: Goods inflation has taken off after 25 years of being negative

Chart 3_Annual PCE inflation

After initially insisting inflation was only ‘transitory’ and therefore wouldn’t require a near term response, the Federal Reserve has been forced to back down in the face of a relentless barrage of criticism from financial markets. The quantitative easing measures that were put in place at the onset of the COVID crisis are being wound back and the governor, Jerome Powell, all but confirmed the Fed will raise interest rates at their March meeting. In fact, he left the door open to multiple rate rises this year and the market is pricing in at least three.

Here in Australia the RBA has also insisted it would not be raising rates until 2024, but speculation is mounting they will reconsider that position in their meeting on February 1 and the market is pricing in four rate hikes by the end of the year.

Why has that affected the share market?

When interest rates are super low, typically so too are bond yields, which has two effects.

First, when returns from bonds are super low it’s an easier decision to invest into shares.

Second, when you value an asset, you try to work out what all its future cash flows are worth today, which is referred to as a ‘discounted cash flow’ (or DCF) valuation. To calculate a DCF, you use a ‘discount rate’, which is typically based on the 10-year bond yield. The lower the discount rate, the higher is today’s value of all those future cash flows, and vice versa. So with higher interest rates and higher bond yields, those DCF valuations will be going down.

That affects the so-called growth stocks the most because you are typically placing a much higher emphasis on earnings a long way into the future.

That’s why the NASDAQ in the US got whacked the hardest, it’s full of tech companies. In fact, there’s a bunch of the real blue-sky companies, such as Zoom, Peloton, and Zillow, that fell 60-80% from their highs of early last year.

Should we be panicking?

Definitely not. While nobody, but nobody, can tell you when this correction will end, if it hasn’t already, there are many indicators that suggest economies and companies are in good shape. After all, the fact interest rates are rising is because the economy is growing strongly. Indeed, US GDP grew at an annualised rate of 6.9% in the December 2021 quarter, the highest in more than 25 years (with the exception of the freak September 2020 quarter, which was a bounce back from the COVID lockdowns) – see chart 4.

Chart 4: US GDP growth is the highest in decades (except for the post-COVID crisis spike)

Chart 4_US GDP growth

It is entirely normal for share markets to experience a correction, with the average intra-year pullback for both the Australian and US markets being 14% – see charts 5 and 6. Last year was the exception, where the worst drawdown in the US market was only 5% and in Australia was 6%.

Chart 5: Average intra-year drawdown for the Australian market is 13.9%

Chart 5_Average intra-year drawdown

Chart 6: Average intra-year drawdown for the US market is 14%

Chart 6_Average intra-year drawdown

As inevitably happens with any correction, you may have heard or read stories quoting uber bearish market pundits forecasting the end of the world. One example is Jeremy Grantham, who was widely quoted as predicting the market will fall at least 50%. The simple fact is, Grantham has been making that call since 2013 and has been wrong the whole way.

Something we all need to be aware of is that the media loves a crisis, because they know we’re hardwired to be drawn to headlines screaming “DISASTER AHEAD”. Without doubt they turn up the noise associated with selloffs, and likewise with the recoveries. It’s best not to pay much attention to most things you read and hear in the mainstream media.

Indeed, far from panicking, it’s worth remembering corrections like the current one usually throw up interesting opportunities. Markets have a way of picking themselves up, dusting themselves off and carrying on with their journey from bottom left to top right – see chart 7. It’s interesting to look at that chart and see some of the past events that at the time seemed like we may never recover from, but we do. The current concerns about Ukraine probably fall into that bucket.

Chart 7: Markets have a way of recovering and carrying on

Chart 7_Growth of $1

In conclusion, the current correction is because of concerns that rising inflation will cause central banks to raise interest rates, which affects share valuations, especially for the more growthy stocks. Buyers already appear to be snapping up cheaper stocks, which may indicate the market has already priced in what it believes is the rate rise risk. Nobody can tell you whether this correction has run its course, but you can rest assured the market will recover.

If you have any questions about what markets are doing or how your portfolio is positioned, please call us today.

Are cryptocurrencies an investable asset?

Are cryptocurrencies an investable asset?

In a year full of remarkable financial events, there are few issues as remarkable, and divisive, as cryptocurrencies. After peaking in April this year at a collective market capitalisation of almost US$2.5 trillion, or about 1 per cent of the world’s investable assets, global cryptocurrencies have dropped 40 per cent, to about US$1.5 trillion. Bitcoin, which accounts for almost half that total, has fallen 45 per cent from its recent highs, but that’s after rising nine-fold in the 12 months before.

It is perhaps that volatility that inspires such strong feelings among those who see cryptocurrencies as a new and legitimate asset class and those who see it as not much more than thin air with a price tag. Berkshire Hathaway Vice Chairman, Charlie Munger, described bitcoin as “disgusting and contrary to the interests of civilization”, while fellow investing legend, Stanley Druckenmiller, bought some last year.

Recently Finance Services Minister, Jane Hume, proclaimed, “I would like to make something clear: cryptocurrency is not a fad. It is an asset class that will grow in importance.” That brought critics of the unregulated crypto marketing industry out swinging, pointing out there are currently more than 5,000 cryptocurrencies in circulation and a new one can be created in 15 minutes. Of itself, that is really no different to being able to list a new mining exploration company in a few weeks; the timeline is different, but the speculative element is identical.

Whether cryptocurrencies are an investable asset class and whether they belong in a portfolio are two very different questions. The usual criticism of crypto as an asset class is that it’s impossible to value because there are no earnings or dividends to model, but gold and other commodities are no different. Dan Morehead, co-CIO of US crypto fund manager Pantera Capital, points out no fiat currency can be valued either, yet relative values are determined through trading every day.

Morehead’s take on crypto is interesting. While he concedes probably the bulk of bitcoin investors are simply speculators and much of the balance are libertarians convinced of the debasement of fiat currencies, he argues it has definite utility that is steadily becoming more apparent. He sees the internet as having revolutionised countless major industries worldwide, but finance has yet to be fully disrupted. Bitcoin is simply another internet protocol for moving data around, providing the means to send money anywhere in the world instantly and for no cost. After only 10 years it’s still very early days for bitcoin, which exacerbates volatility, but as the number of users increases, he expects that volatility to settle.

Pantera has analysed the growth of bitcoin’s price and user base since its inception in the GFC and concluded there has been a remarkable consistency: both have increased, in lockstep, by five orders of magnitude since 2010, (there was one point where they diverged due to price volatility, but they caught up again 15 months later).

It works out at a US$200 increase for every million new users (exactly how they calculate ‘new users’ is unclear). Based on that, they have calculated a long-term trend, which has proven impressively accurate, albeit with that sometimes gut-wrenching volatility.

Are cryptocurrencies an investable asset chart

In an exercise that is either astonishing or one hell of a fluke, on 15 April 2020, when bitcoin was trading at US$8,988, Pantera used its mathematical model to forecast the bitcoin price month by month out to August 2021. The 12-month forecast, for 15 April 2021, was US$62,968, which required an increase of 601 per cent. The actual price ended up at US63,237, a variance of only 0.4 per cent. Then that volatility struck again, sending the May price 37 per cent below the forecast.

Morehead remains convinced the price will, once again, catch up. He argues investing 1 per cent of your portfolio in cryptocurrencies means you’re in the game if they eventually account for 5 per cent of global investable assets, and if they go to zero, it shouldn’t have hurt too much.

Asset allocation consultant, Tim Farrelly, says that since bitcoin is investable, it qualifies as an asset class. However, until he’s convinced you can get a meaningful forecast for its price and relationship to other assets, there’s no chance it will be included in his portfolios. “Do I see it like gold? I’m prepared to give a nod to 2,000 years of history that gold isn’t going away. I’m not so sure bitcoin will stack up in the same way. I wouldn’t be surprised if in 10 years’ time everyone says ‘what were we thinking?’”

The Post-Pandemic Boom

The Post-Pandemic Boom

    2021 is shaping up to be a year of strong economic growth, and, right now, the indicators are looking good for financial markets as well.

Australia

    • The government response to the COVID shutdowns  was swift and big. In total, the federal government is spending $272 billion, equivalent to 14% of GDP, and the states $122 billion. All that newly created money has to go nowhere.
    • Early on, households saved a lot of the extra cash. The June quarter savings rate hit 19.8%, 8x higher than the year before and only 0.5% below the 60-year peak set in 1974. The Commonwealth Bank estimates households will have about $100 billion of savings, or 5% of GDP, that has been accrued between the start of COVID and December.
Image1
      • To that you can add $34 billion of super withdrawals so far, with Treasury estimating an eventual total of $44 billion.
      • After a record plunge to 76 in April, consumer confidence has now had 11 consecutive weekly gains to 108.
      • It now appears Australians are spending those gains. Commonwealth Bank reported credit card spending jumped 11% year on year in mid-November. Restaurants in New South Wales enjoyed seated dining numbers 55% higher than a year ago, while Queensland was a whopping 79% and even shellshocked Victoria was up 54%
      • Retailers have seen record spending in the Black Friday sales, prompting Gerry Harvey to say, “This is like the greatest boom I’ve ever seen in my lifetime”.

US

      • The US fiscal package injected 13% of GDP and pushed the personal savings rate to almost double what it was at the start of the year.
      • Low interest rates have ignited the US housing market, where prices are now 10% above the pre-GFC levels. Homeowners’ equity is at a record high and the increase in the pending sales index is parabolic.
Image2
      • More than 80% of stocks in the S&P 500 are trading above their 200-day moving average, a sign of positive market breadth that has only been seen twice in the past 20 years.
      • We are seeing 52-week highs in share markets across the world, from China, to Japan, to Europe, to Australia.
      • Global equities have seen a record inflow post the COVID vaccine announcements.
Image3

While the indicators are stacking up well, there are, of course, no guarantees that markets will play ball and they sure do have a way of wrong-footing us. However, it’s noteworthy that nothing in the economy was ‘broken’ going into the pandemic downturn; there was no particular sector on the cusp of being crushed by excessive debt and while valuations were not cheap, they were certainly defensible.

Now is not the time to be sitting on lots of cash.