
Steward Wealth September 2020 quarterly outlook
Welcome to our Steward Wealth quarterly outlook video, a brief overview of where we see markets now and how we’re positioned.

Welcome to our Steward Wealth quarterly outlook video, a brief overview of where we see markets now and how we’re positioned.

After my first ride in a Tesla, climbing back into my diesel car felt very much like I’d gone back in time – noisy, slow, and those fiendish fumes coming out of the exhaust. I only know a few Tesla owners, but they all swear by them and claim they will never go back to an internal combustion driven car.
I don’t think there’s any doubt Tesla is at the forefront of an inexorable change in the auto industry, and that we are on the way to a car market dominated by electric vehicles. What I am far less certain about, is whether the seven-fold increase in the share price over the past nine months, which includes a 50% jump in the past five weeks, makes sense.
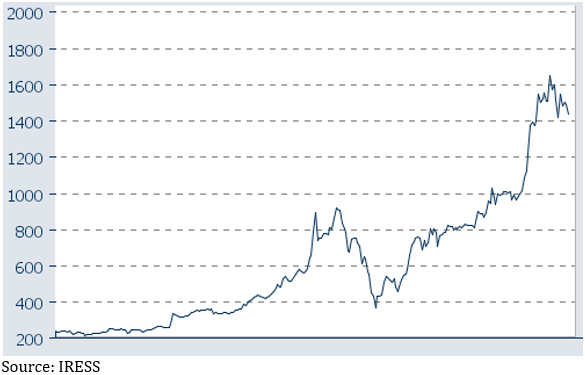
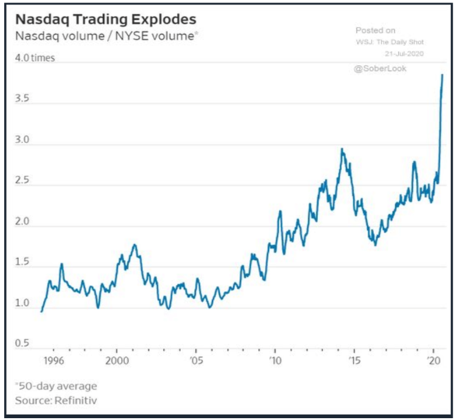
I make absolutely no claim to any expertise about Tesla as an investment, and if you own the shares I’m sure as hell not suggesting you should sell them. What I am wary about, though, is that there are pockets of the share market, in particular the tech-heavy NASDAQ index, that appear stretched at the moment, to the point where you could say they have the whiff of bubble about them. To be clear, by no means the whole of the market – it’s like there are micro bubbles.
I certainly don’t think it’s reminiscent of the dotcom bubble that popped so spectacularly in early 2000, when the NASDAQ index fell 78% between March 2000 and October 2002, the biggest tech companies are reporting phenomenal earnings and sales growth that are clearly backing their astonishing performance. However, there’s no shortage of bears among the commentariat, and I recently listened to a conversation between two US-based bloggers whom I respect, because they are generally level headed and not prone to hyperbole, where they straight up called the book going on in parts of the NASDAQ a bubble,
Here are a few of the things that have caught my eye:
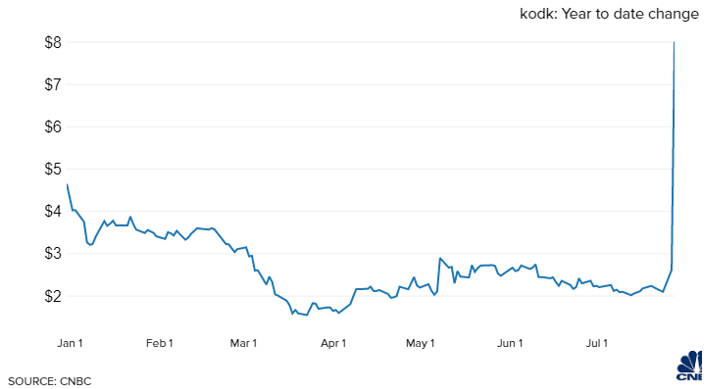
Wayfair, 835%
Tesla, 326%
Wendy’s, 211%
Docusign, 194%
Zillow, 165%
Chipotle, 144%
Roku, 140%
Beyond Meat, 140%
GrubHub, 130%
Zoom, 124%
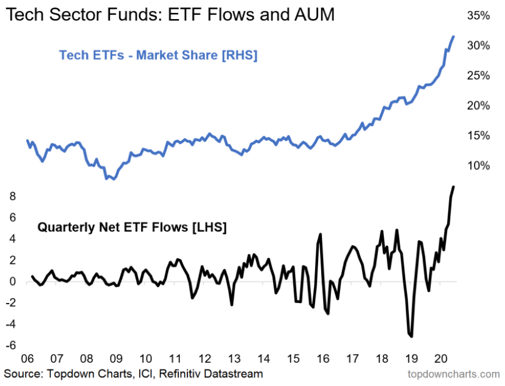
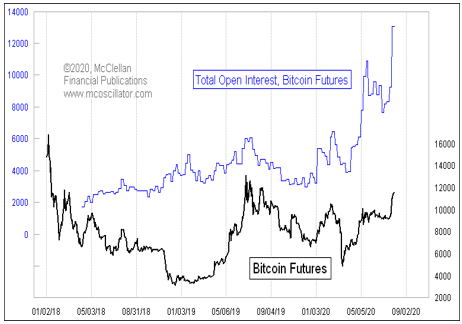
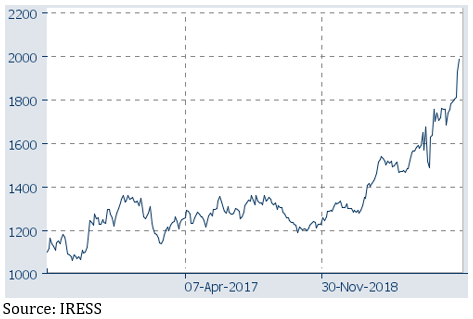
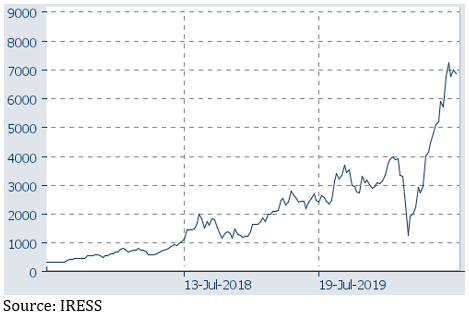
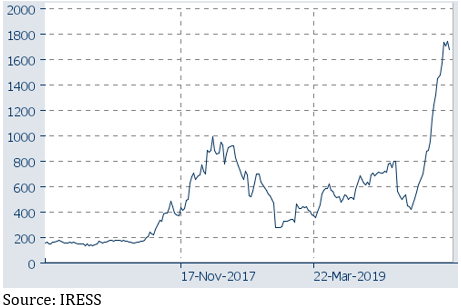
To reiterate, I don’t include the five tech giants, Facebook, Apple, Microsoft, Amazon and Google, in this. While there is growing consternation that they represent an historically high proportion of the S&P 500 at 22%, they also represent 18% of total earnings, and their earnings are growing way faster than the rest of the market. So while they have seen spectacular rises since the March correction, it is, I believe, much easier to rationalise, especially in an environment of super low interest rates.
I also readily concede the basis of the US dotcom boom of 1999-2000, that the internet would be transformative of how we live and do business, was dead right, it was just wrong about how they should be valued and retail investors ended up getting carried away – and then carted out backwards. This time around it’s again entirely possible the market is right about the impact of electric vehicles, small pharmaceutical companies and other online business models, it’s again a question of what valuation you put on them now, and there are signs some retail investors are once again getting carried away.
As unusual or extreme some of the above stories and examples might be, the thing about a bubble is it can go up a lot higher, and last for a lot longer, than you would ever think possible. Alan Greenspan, who at the time was the Chairman of the US Federal Reserve (their central bank), famously referred to the ‘irrational exuberance’ of the stock market in November 1996, more than three years before it peaked. It’s entirely possible if there is a correction it’s confined to a specific part of the market, leaving the rest of it largely unaffected.
As I said, this is not a suggestion to sell your tech shares, but it is a recommendation to be very careful.

This article by Jason Todd, a strategist at Macquarie Wealth, takes a measured look at whether the Australian share market is overvalued, and whether the tech sector is in a bubble.
When equity markets began to rise back in late March, we had no problem thinking that liquidity would do the ‘heavy lifting’ as long as COVID-19 cases were not still rising and economic expectations were not still falling. It was right to take this stance. Now the equation seems much harder to solve. COVID-19 cases are rising again but markets do not seem particularly concerned even though valuations have expanded by an extraordinary amount. There appears to be two schools of thought emerging to explain the current backdrop.
The first, suggests that markets are becoming irrational and are in the midst of a liquidity-fuelled rally that is fast taking on bubble-like characteristics. This view argues that investors are being driven by the fear of missing out (FOMO), paying an unjustified scarcity premium for earnings growth and that momentum rather than fundamentals matter.
The alternative view is that markets are pricing in a combination of record low bond yields, an unwavering commitment by policy makers to keep economies and the financial system afloat and the willingness to pay a premium for structural growth. This is pushing valuations higher in areas where COVID-19 has accelerated change such as technology while pushing valuations lower in areas under downward pressure such as traditional retail and property.
It is hard to say which view will ultimately prevail as we think there are elements of truth to both sides. The risk-reward for certain pockets of the market are becoming hard to justify, but in general, we do not see broad signs of “bubble trouble” across equities. Traditional warnings signs such as speculation activity are not broadly evident even if tech valuations are looking troublesome.
A ‘bubble’ is defined as a rapid rise in the price of an asset that is not supported by fundamentals. A typical sign of a bubble is a sharp increase in valuations to extreme levels. For the Australian market, valuations are high but outside of a reversion in the drivers supporting risk assets in general, we don’t think they have reached a self-correcting level.
The 12-month forward P/E multiple for the Australian market has risen sharply since 23rd March and now sits at a near-record high of 19.1x. However, the P/E multiple has been boosted by the COVID-19 induced collapse in earnings which we think is not a permanent hit. In addition, the CAPE is only 15.9x. This is well below previous peaks and is below its long run average of 16.6x. So far so good…right?
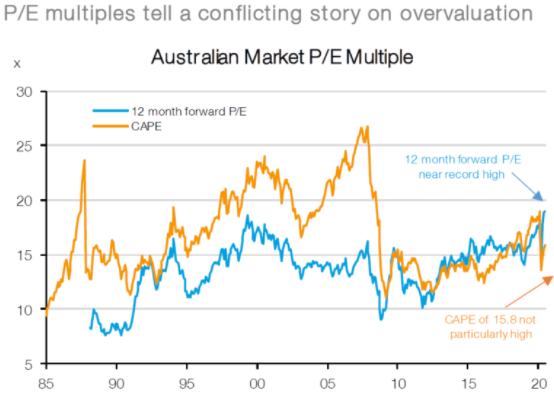
We do not think Australian equity valuations are anywhere near bubble territory and nor do we think other traditional indicators of bubble-like behaviour are evident. However, we cannot say the same for Australian technology stocks which are now trading on an eye watering 60x forward earnings!
These valuation metrics look even more concerning when only the WAAAX stocks are considered (Wisetech, Afterpay, Appen, Altium and Xero). These 5 stocks have seen prices rise more than 500% over the past 3 years versus the broader ASX200 index which has barely risen above 0% over the same period. This has pushed 12-month forward P/E valuations for WAAAX to a new all-time high of 168x versus a paltry 19x for the ASX200.
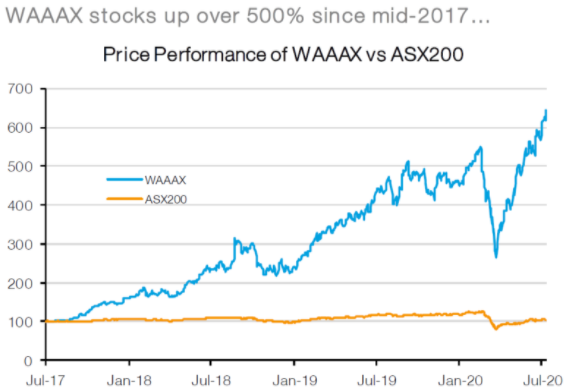
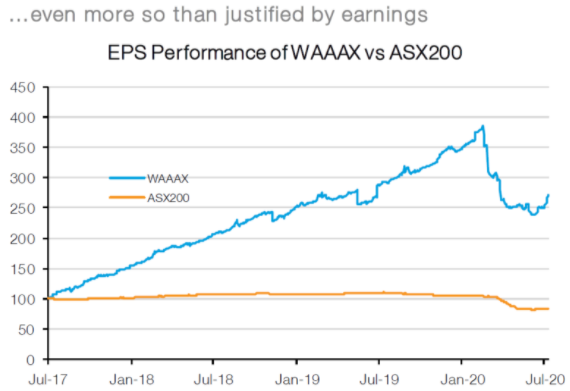
Part of the extraordinary price appreciation and valuation re-rating has been due to a much stronger and less cyclical earnings outlook, but it has also been fuelled by record low interest rates which disproportionately benefit high multiple/long earnings duration stocks. In fact, the WAAAX stocks have seen earnings grow 2.5x over the last 3 years – an impressive outcome versus the broader market which has seen earnings decline. However, this has been dwarfed by the near 6-fold increase in share prices over the same period!
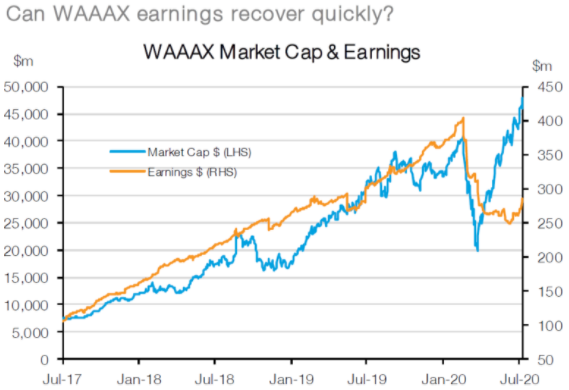
To put this in context, the WAAAX stocks have seen earnings increase by A$181m and their market cap expand by a staggering A$41bn. Back in 2017 investors were willing to pay 71 for each $1 of earnings and now these same stocks are commanding 168 for each $1 in earnings. In other words, investors have been willing to ‘pay up’ for the superior earnings performance of WAAAX stocks but at an increasingly higher and higher rate.
The re-rating of growth stocks is not unique to Australia. The WAAAX ‘bubble’ is part of a larger issue relating to the willingness of investors to bid up stocks which have a strong, structural, and/or transparent earnings growth outlook. ‘Growth’ stocks (of which WAAAX is a component) have been fiercely bid up as one of the few sources of structural earnings growth in the Australian market.
In other words, in a world where earnings growth is scarce, any earnings growth has become more valuable. This has also been seen in the recent performance of the FAANG’s (Facebook, Apple, Amazon, Netflix and Alphabet – formerly Google). This collection of stocks has also seen valuations ratios explode in recent years with momentum rising even faster in recent months because of an acceleration in their earnings outlook thanks to COVID-19.
The other big factor, ultra-low interest rates, has also played a part. All other things equal, a lower discount rate would not only increase the fair value P/E multiple of the market generally but would also increase the dispersion between high and low P/E stocks. However, the current unprecedentedly high P/E dispersion exceeds the extremes seen during the Tech bubble of late 1999/early 2000, which suggests caution may be merited.
In a world where earnings growth is scare, what is the right price for the rarest of structural earnings stocks like technology, which the market is assuming can access that growth? Is it 50x future earnings, 100x future earnings, an eye watering 168x future earnings or something even higher? Only time will give us the right answer, but we think it is worthwhile trying to determine what conditions would need to prevail in order for these stocks to maintain these multiples (or the alternative – what would need to change for these stocks to suddenly lose their scarcity premium?). Gavekal’s Louis Gave believes there are 4 factors that would drive this reassessment:
We think equity markets are optimistically priced and waiting for economic fundamentals to catch up, but they are not at an extreme (bonds are even more expensive). Similarly, retail sentiment is bullish but not exuberant, cash levels have come off their highs, but remain exceptionally elevated and capital raisings are still being gobbled up (predominately by institutional and not retail money). On the other hand, there have been some anecdotal signs of rising market ‘madness’ in the US with investors fiercely bidding up bankrupt companies, retail account openings have exploded (in part because many have been stuck at home) and some daily price moves have been extreme.
The technology sector is another kettle of fish. In the US, valuations are high but nothing in comparison to our own WAAAX stocks. On the other hand, there are still few signs of speculative activity stretching more broadly into financial assets and the scale of global (and domestic) liquidity injections is nothing we have seen before. We are not saying that fundamentals don’t matter because in the end they always do, but it is quite possible that the combination of easy money and a slightly better cyclical outlook push multiples for both technology and the broader market even higher!
Over the coming 12 months, we think investors should maintain a pro-growth portfolio allocation (overweight equities versus bonds and cash) and be prepared to look through any near-term fluctuations or use weakness to reallocate back into the equity market. Despite near-term risks, we think the downside risks are more likely to slow the recovery rather than put the cyclical recovery at threat. This could lead to a more drawn out rebound, but if economic growth and corporate earnings continue a path back to trend, then, in combination with record low interest rates, this will be sufficient to propel markets higher. In addition, while valuations for equity markets are not overly appealing, they are even worse for the bond market with yields not far from their lower bound and as a result bonds continue to give away a substantial yield premium to equities.

Welcome to our Steward Wealth quarterly outlook video, a brief overview of where we see markets now and how we’re positioned.

This article was published by The Australian Financial Review.
The Australian sharemarket. like many others around the world, had left many shell-shocked investors scratching their head. After a gut-wrenching fall of 36.5 per cent in just over a month to March 23, the S&P/ASX 200 had rebounded 35 per cent to early June only to start falling late last week.
Many shell-shocked investors are left scratching their heads, wondering how it’s possible financial markets could be within reach of levels that were last seen before COVID-19 forced the world’s economy to a grinding halt and with so many questions still unanswered. As the dust settles, there are a few explanations that, if not simple, are at least logical.
It makes intuitive sense to conclude that if the economy is doing badly, then so too should the stock market. However, the composition of the stock market actually bears little resemblance to the overall economy and although the two will head in the same general direction over the long-term, over the short-term they can diverge enormously.
For instance, financial companies make up about 26% of the ASX200 but only about 10% of the broader economy, resources are 19% of the index but about 9% of the economy, and CSL on its own accounts for 9% of the Australian share market but is a tiny fraction of the overall economy.
While we hear dreadful reports of businesses that have either shut down entirely or are very close to it, most often small service-oriented businesses like cafes and restaurants, hairdressers, gyms or travel agents, which are simply not represented on the stock market at all and so have very little influence on it.
The flow of credit is like the lifeblood of modern economies, and central banks, like the Reserve Bank of Australia, learned valuable lessons from the GFC about how critical it is to make sure the financial markets’ plumbing doesn’t get clogged up.
The US’s Federal Reserve stepped in quickly and aggressively when global markets panicked about having access to cash in March, and our own Reserve Bank followed right behind making it clear it would backstop the flow of money, cutting interest rates to new lows, offering enormous lines of credit to the banks for business lending and embarking on its first quantitative easing measures. Financial markets heaced a sigh of relief.
The Australian government likewise acted quickly and aggressively. Having orderedd the economy to be shut down it knew it had to abandon any hopes of delivering a balanced budget and instead step in to fill the economic hole it had created. A range of support packages amounting to a world-leading 10% of GDP have been announced, all aimed at helping households and businesses ride out the storm. Importantly, the government’s support spending is injected directly into the economy, so we know exactly how much of an inpact it should have, whereas the central bank measures rely on the banks to distribute it, meaning we can’t be sure of the final effect.
Economist, Tim Toohey, calculated the government’s support package is so large it will actually increase national income in the June and September quarters. This is backed up by Kristine Clifton, an economist with Commonwealth Bank’s Global Economics and Market Research team, who confirmed the bank is finding the reduction in wages and salaries going into accounts is being more than offset by the increase in government benefits, such that overall inflows are up about 10% year on year.
The ASX 200 is trading on a Price to Earnings (PE) ration of about 18x, which compares to a 15-year average of about 14x, prompting many commentators to warn the market is absurdly expensive given ‘the elevated uncertainty.’
Firstly, there is never, ever a time where markets are certain. What changes is how people perceive the consequences of that uncertainty, but that is something we cannot know.
Also, despite analysts slashing their earnings forecasts by about 25% they are still absolutely guessing. It begs the question of why you would even look at forecast earnings when the companies themselves barely have any idea what the next 6-12 months holds.
Finally, super low inflation and interest rates change how assets are valued. When the return you get from risk-free assets, like government bonds, is basically nothing after inflation, then investors are left with little choice but to look elsewhere.
If you swithc off the economy, it’s inevitable you’ll see some ugly economic data – you might be shocked, but you shouldn’t be surprised. The price you pay for an investment is always critical, but as usual, the market is looking forward and balancing a complex host of probabilities, including the old adage, ‘don’t fight the Fed’, to which you might now add, ‘don’t bet against government spending.’