A tax effective alternative to superannuation

A tax effective alternative to superannuation

One of the reasons superannuation is so popular is the associated tax benefits, but last year the government imposed new limits how much money you can get in to super.

Investment bonds are another tax effective investment strategy that’s been around for years and is becoming popular again as an investment vehicle for tax payers on the highest marginal rate, or indeed anyone paying more than 30% tax. Investment bonds are flexible and easy to establish and manage, but you do need to be aware of a couple of ‘quirks’.

For a start, the opening amount you put into the bond can be whatever you like; unlike superannuation where you are limited in how much you can put in. What you actually invest in will be determined by the provider of the bond, but the range is pretty broad and includes things like managed funds, fixed income, property and cash.

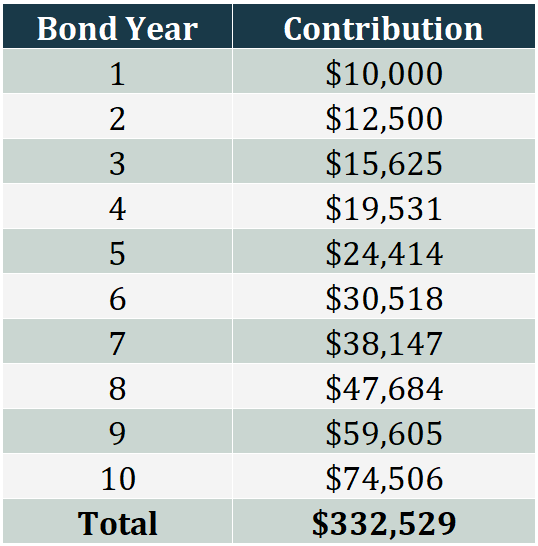
After your initial contribution you don’t have to put any more into the bond if you don’t want to, but you can choose to increase your investment by a maximum of 125% of whatever you put in the year before. So each year the amount invested can grow. Chart 1 shows how much you could invest if you start off with $10,000.


Chart 1: you can start an investment bond with as much or little as you like and and add 125% of your previous year’s contribution every year
A tax effective alternative to superannuation table1

Over the life of the bond all the earnings are reinvested, again, much like your super fund. That way you get to benefit from the magic of compounding.

For the life of the bond, which is a maximum of 10 years, the earnings from the investments are taxed inside the bond at 30%, though that rate can be reduced by franking credits. In other words, you don’t have to pay anything out of your pocket while the bond is going, provided (and here’s one of the tricky bits), you let the bond run its full term.

If you do let it go the full 10 years, at the end, you receive all the earnings from the bond and won’t have to pay any further tax on them, plus of course you get back what you invested. That means you’ll have paid 30% tax on the earnings instead of 45%. Importantly, the 10 years starts from the time you make the initial investment, not any subsequent investments. So if you follow the schedule in the table above, the $74,506 invested in year 10 is only tied up for 12 months.

If, for some reason, you have no choice but to break the bond inside the 10 years, you’re allowed to do so, but you’ll have to pay some tax; the amount depends on when you break it.

If you stop within the first eight years, you receive all the earnings but you’ll have to pay the difference between the 30% tax that’s been paid inside the bond while it was in force and your marginal tax rate. In other words, there’s no real tax benefit.

If you stop during year nine, one-third of the earnings are tax-free but you’ll pay your marginal rate on the rest. If you stop during year 10, two-thirds are tax-free.

There are other attractive aspects to investment bonds, like you can nominate beneficiaries of the bond without having to make it part of your will. Also, every investment bond has a built in life insurance policy, and the death benefits can go to any nominee tax-free – regardless of how long the bond’s been going for. Finally, unlike superannuation, the rules around investment bonds have been stable since 1995.

There is one downside to bear in mind: because investment bonds are effectively taxed like a company CGT is paid in full when the bond is redeemed, regardless of how long it’s been held. That compares to the 50% CGT discount when you hold an asset in your own name and sell it after 12 months, or in super, where you pay 10% CGT after 12 months.

Investment bonds are making a comeback as a useful tax planning tool for high income earners and can be a great way to save for a specific objective, like a house deposit, education costs or a boost for grandkids.

A classic mistake

A classic mistake

What would you do: you’re 67 years old and about to retire from General Electric with a company pension. You hold US$1.8 million worth of GE stock, which accounts for 90% of your investment portfolio. Do you sell some of your GE and diversify or sit on it because it’s a blue chip company?

This was a topic discussed on a recent episode of one of my favourite podcasts, called Animal Spirits, where two American financial bloggers chat about things they’ve found interesting over the past week. It was actually a thread on Reddit posted by the retiree’s son, who was asking what his dad should do having held the shares for years and being “quite stubborn”, which presumably means he wanted to hang on to them.

There were some 124 comments on the post. While I haven’t read all of them, my sense is that most were arguing he should keep the shares, with quite a few pointing out the 4% dividend yield would pay him US$72,000 per year. I’ve no idea what the guy ended up doing but, given what’s happened to GE shares in the nine months since, there’s a really good lesson to be had for anybody.

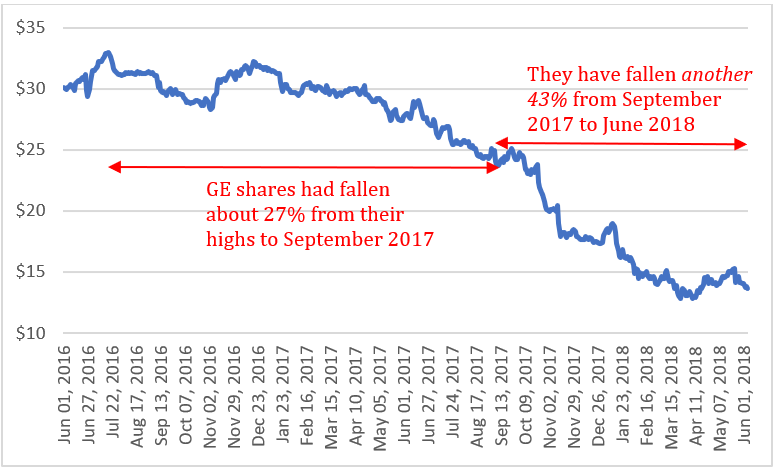
When the original question was posted in September 2017, GE shares were trading at around $24, having fallen about 20% in the previous year and compared with a peak of about $33 in July 2016. GE has been one of the great blue chips of the American market, so it’s not surprising that a lot of people expected it would rebound. Alas, today the stock is trading around US$13.60 after revealing problems with its power generation division, amongst other things, and cutting its dividend in November 2017 – see chart 1.


Chart 1: the GE share price has fallen more than 40% since September 2017
Source: investing.com

So if the retiree didn’t sell any of his shares, the holding would now be worth just over US$1 million and at the current yield of 3.5% he’d be receiving around US$35,000 in dividends.

So lesson number 1 is concentration risk. This guy had 90% of his investment portfolio tied up in a single stock, which is also the company that’s going to be paying his pension. That’s an awful lot of exposure to have to a single company, blue chip or not.

It’s often said it takes concentrated exposure to get rich, but you diversify to stay rich. While we can all name exceptions to that rule, when you’re that close to retirement the way the equation stacks up is very different to when you’ve got 20-30 years of work ahead of you.

Lesson number 2 is about what’s called ‘sequencing risk’, which is taking a big hit to your assets when you’re not going to be able to make up the lost money through work. He needed to do the sums: his total investments were worth US$2 million, plus he was going to get a pension. Could that amount of money have supported the lifestyle he wanted in retirement? If the answer is yes, then it makes sense to take steps to protect the capital, if it’s no, then how much more money do you need and what’s the best way to get there?

Just as importantly, he needed to ask himself how he would feel if the total of his investments dropped to US$1.8 million, or US$1.6. If the answer is he would have felt pretty miserable and stressed about the future, again, he needed to protect the capital.

When you’re about to retire is not the time to take the attitude of ‘those shares have fallen so far already, surely they won’t fall further’. Any share can go to zero, even those considered to be blue chips, just ask holders of Enron shares. And while of course there may be tax considerations in selling a big holding, it is risky to allow tax to be the main determinant of your investment strategy.

This scenario is yet another example of where our human biases can get in the way of making sensible decisions. It’s also another example of where it can be a good idea to get objective advice.

What happens to my super when I die?

What happens to my super when I die?

It’s a question that comes up from time to time, however, it’s one which superfund members should understand as it’s an important consideration for tax purposes when your estate planning strategy is put in place.

So, what does happen with my super when I die? Well, it really depends upon several factors including:

  • Age
  • whether you are in pension or accumulation phase
  • who is considered a ‘dependent’ under both superannuation (SIS) definition and the ATO definition
  • the amount you have in super
  • the ‘taxable’ and ‘non-taxable’ components of your super
  • what your trust deed allows.

Generally, the options on how your benefit can be paid to beneficiaries upon death are:

What happens to my super when I die image1
What happens to my super when I die image1.1

Who is a ‘dependent’ and a ‘non-dependent’?

One thing you need to be aware of is that there are two definitions of who is deemed as a dependent. One relates to the SIS Act (Superannuation) and the other under the ITAA 97 (ATO). This is an important distinction because while a dependent receives the benefit tax free, a non-dependent under the ITAA will incur tax on super benefits.

Under the ITAA, a death benefit paid to a beneficiary will be deemed a ‘dependent’ and therefore will be tax free if it is paid to the deceased’s:

  • spouse;
  • child under the age of 18;
  • any person over 18 years and financially dependent or in an interdependent relationship.

An interdependent relationship is a close personal relationship between two people who live together, where one or both provides for the financial and domestic support, and care of the other. This definition can include parent-child relationships that don’t fall within the usual definition of dependent and can also include sibling relationships.

Any person who does not fit within these categories can only receive the superannuation benefit via the deceased fund member’s estate.

Super Taxation

Superannuation benefits consist of different components for tax purposes:

  • a tax-free component;
  • a taxable component; and possibly
  • an untaxed element of the taxable component.

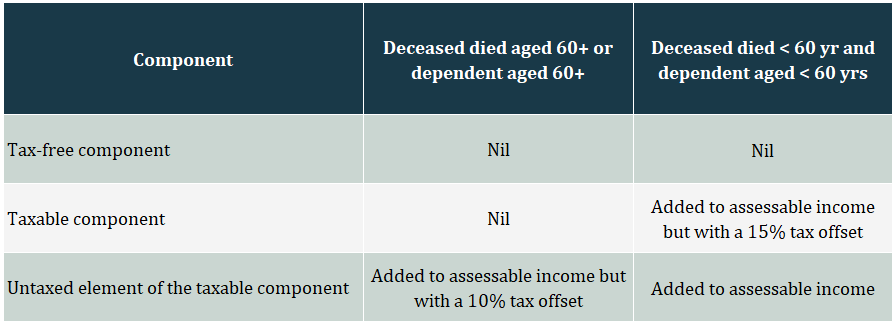
We have established that if you are a dependent under the ITAA definition, your lump sum benefit will be tax free. However, if you are receiving the super benefit as a pension rather than a lump sum, you may be required to add the taxable component of your pension income to your assessable income. This will depend on your age.

What happens to my super when I die image2.1

However, if you are a non-dependent for tax purposes, the above components will be taxed as follows:

What happens to my super when I die image3

The new transfer balance cap (TBC) and death benefits

From 1st July 2017, the transfer balance cap (TBC) will apply to limit how much a member can have in retirement phase over their lifetime. For 2017/2018 the TBC is $1.6m. When a member dies, their TBC is not transferable to a dependent or even their spouse.

When the deceased member’s superannuation benefits are cashed as a lump sum, there is no impact on anyone’s TBC and the relevant death benefit taxes we previously discussed will apply.

However, if the benefit is used to continue paying a reversionary pension to a spouse, the surviving spouse will need to add its value to his/her super asset balance. This can only be paid as a death benefit pension if it doesn’t cause the dependent to exceed their TBC. Any excess will need to be paid out as a lump sum death benefit and cannot be retained within the super environment.

To reduce any excess and retain it in the superannuation environment, the receiving beneficiary will need to commute their own benefit first as it can still be held in the superannuation environment as an ‘accumulation’ interest. The death benefit pension they receive from the deceased can be retained up to the $1.6m TBC and it is only any surplus that will need to be paid out as a lump sum.

When did you last review your SMSF trust deed?

Many trustees of superfunds don’t realise that when super legislation changes the trust may require updating. This is particularly critical when dealing with payments of death benefits.

While most trust deeds are written to provide the trustee with wide discretion, to be 100% certain, we strongly recommend they be reviewed. An updated deed will provide complete flexibility when it comes to dealing with excess transfer balance caps, the rollover of death benefits, reversionary and child pensions and effective binding death nominations.

Summary

Superannuation continues to be the most attractive vehicle to grow your wealth. It can also be a very tax effective estate planning tool. For a spouse and financial dependent, a lump sum benefit death benefit is tax free. For non-dependents (as defined by the ATO), there may be taxes of up to 30% on a lump sum super death benefit. Having said this, there are strategies you may be able to implement to significantly reduce, or even eliminate, this tax for non-dependents such as your adult children.

You must also be very careful when a reversionary beneficiary is dealing with a deceased’s pension when it will exceed their transfer balance cap.

If you would like to have a chat about it, we are more than happy to have a look at this for you.

Why have we got such low wages growth?

Why have we got such low wages growth?

One of the enduring economic conundrums over the past few years has been declining real wages growth across developed nations, because if wages aren’t growing then it’s a serious headwind for an economy to grow. The strange thing is, it’s difficult to pin down a particular reason for the flat wages, and the ominous thing is, you can make an argument that the combination of technology and globalization will continue to keep the pressure on.

Weak wages growth is endemic across developed nations

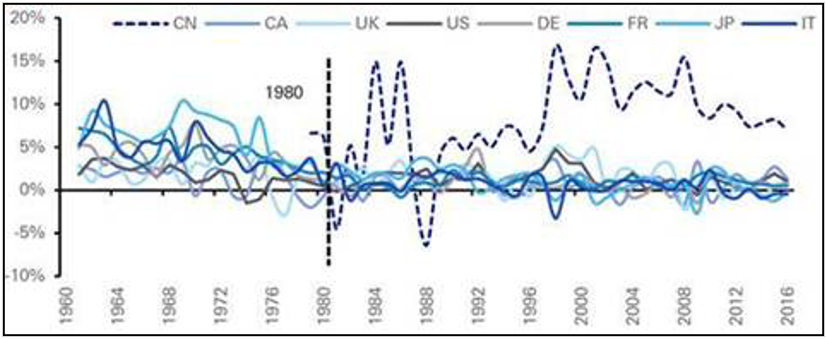
The only country that’s shown strong positive wages growth across the G8 since the start of this century is, surprise! surprise!, China – see chart 1 – but even that has recently been on a downward trend.

Chart 1: Year on year real wages growth across the G8
Source: Deutsche bank

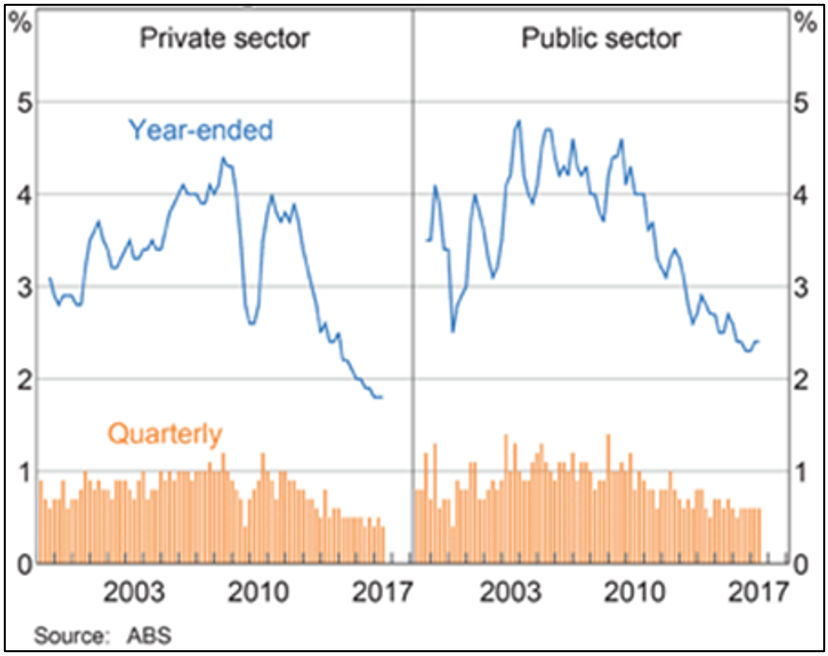
And Australia’s wages growth started to weaken after the GFC – see chart 2.

Chart 2: Australian wage price index growth

But why…

It’s worth remembering from the outset that like all things economic, you can point to many plausible reasons to explain low wages growth; and any one of them, or combination of them, could be right – it could also easily be the subject of a book as opposed to an article.

A couple of the popular ones are:

1. Low productivity growth

This argument is essentially that companies will only pay workers more if they are actually more efficient. So if a mining company increases its profits because the iron ore price has gone up, as opposed to its workers digging more ore out of the ground, then the workers shouldn’t necessarily benefit from that increased profitability.

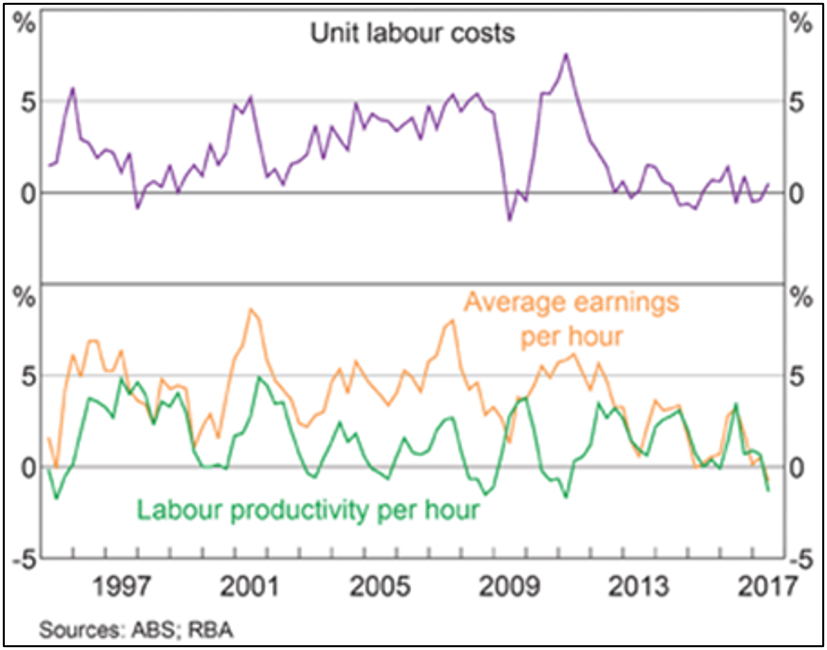
Chart 3 shows quite a close relationship between Australian wages growth and productivity over the past five years, but very little similarity before that. So it begs the question, why would there suddenly be a close relationship?

Chart 3: Australian unit labour costs growth

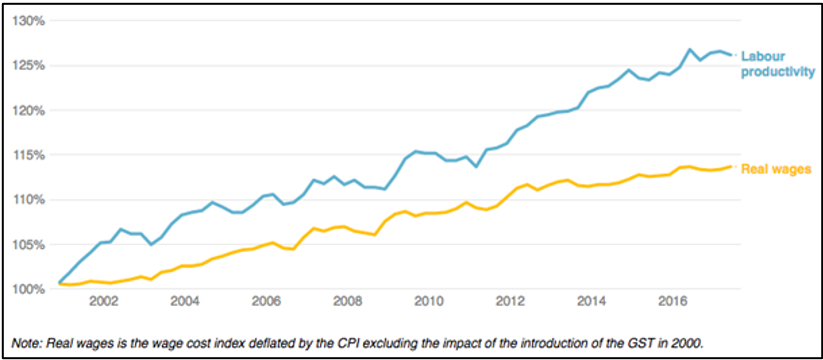
Also, while productivity growth has stagnated since the turn of the century in most developed nations – another of the great economic mysteries of our time – in Australia it’s risen about 25%. But chart 4 shows wages growth has been about half productivity growth over that time.

Chart 4: Australian real wages and productivity growth

2. Poor company profits

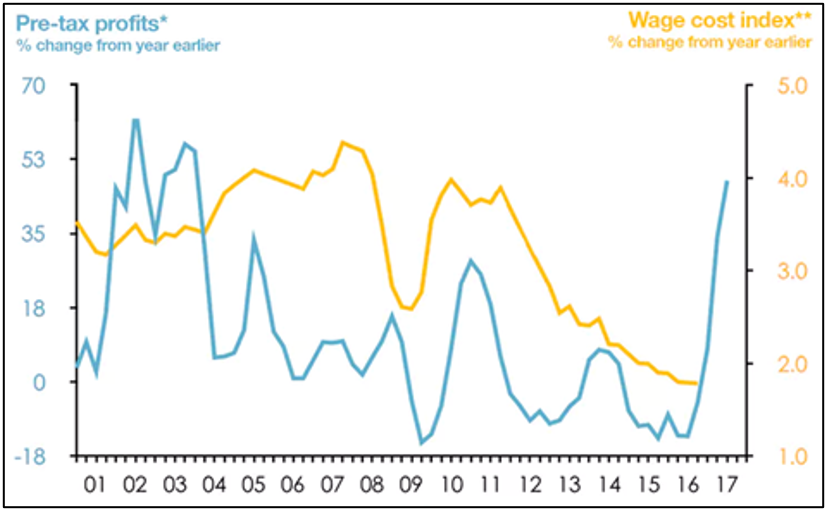
It makes sense that if companies aren’t making good profits they’re not going to pay higher wages. Chart 5 shows there is some relationship between company profits and wages, but it’s not a particularly close one.

Also, the wages growth line in the chart is lagged by nine months, to allow for a rise in profits to feed through to wages, but despite the sharp rise in pre-tax profits starting some 18 months ago, the latest data show Australian wages growth is, as Reserve Bank governor Philip Lowe recently noted, “the slowest since at least the mid-1960s”.

Chart 5: Australian pre-tax company profits and wages
Source: ABS, Saul Eslake, The Conversation
Note: pre-tax profits are rolling four quarters and wages are lagged three quarters

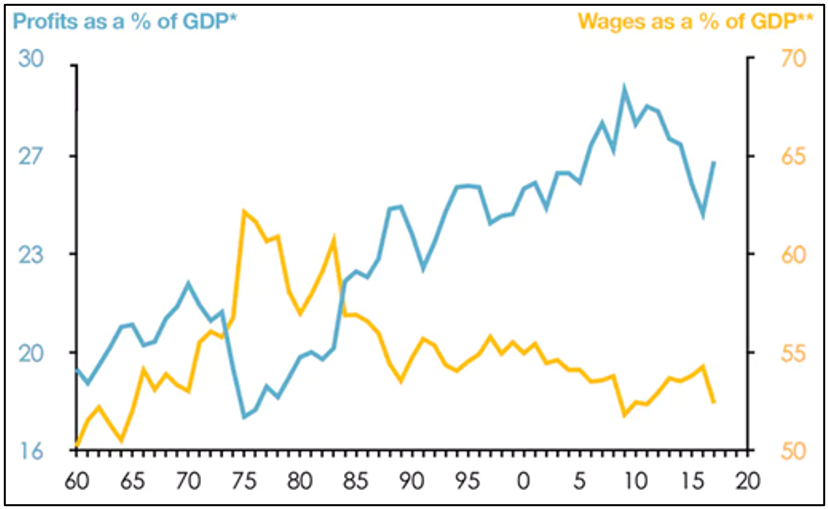
And for a bit of longer-term perspective, chart 6 shows the share of the overall economic pie going to profits continues to trend up toward record levels, while the share going to wages is doing the opposite.

Chart 6: The share of Australian national income going to profits vs. wages
Source: ABS, Saul Eslake, The Conversation


So arguments based on profits doesn’t seem to stand up either.

3. Regulatory changes

Once upon a time Australia, and much of the developed world, operated under ‘wage indexation’, but the inflationary ‘wages spiral’ of the late 1970s put an end to that.

Since the 1980s the combination of reduced union representation and successive governments on both sides of the political fence seeking to link wages growth to productivity has reshaped how wage rates are negotiated.

This actually strikes me as a more persuasive argument for the long-term reduction in labour’s bargaining power.

Technology and globalization

I have a slightly more convoluted theory on why wages growth is weak and it’s to do with the effects of technology and globalization combining to seriously undermine any bargaining leverage wage earners can wield.

About 25 years ago China set out to become the world’s factory, exploiting a vast workforce that was paid a fraction of their western counterparts. From that point the pressure on manufacturing wages grew as companies that compete against manufactured imports have to do the math: at what point does it no longer make sense to produce locally and you either have to send the work offshore or close down?

Currently about half of Australia’s manufactured imports come from low-wage countries, compared with less than 10%, 40 years ago. This is important given that 80% of the value of Australia’s imports comes from manufactured goods.

The only way developed world manufacturers could hope to compete was to increase efficiency, which has translated into replacing as many people with machines as possible and keeping down the wages of those workers that remained. Even today, with the inexorable rise in robotics and AI, the so-called ‘on-shoring’ of manufacturing back to developed countries is because those factories are largely automated and energy and logistics can be sourced cheaply enough to make it worthwhile.

That has seen the gradual elimination of well paid but low skilled manufacturing jobs where unions used to play a role in helping secure wage rises. One upshot of this for Australia has been the hollowing out of the manufacturing sector, with services now representing more than 60% of GDP and 80% of employment.

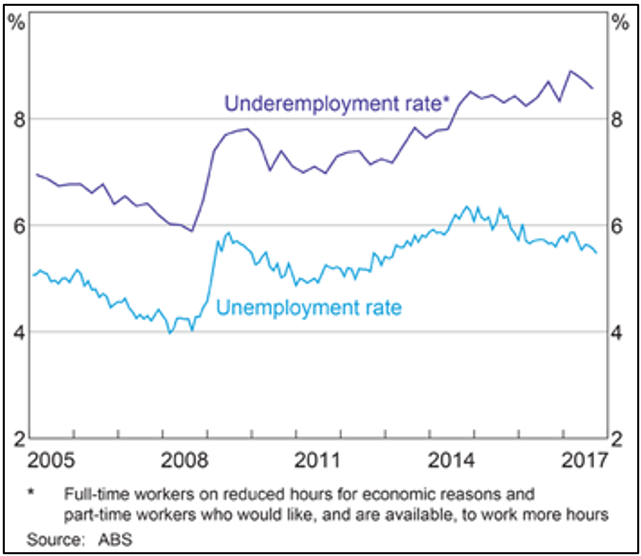
Now the unskilled and displaced are often ending up in the growing low paid services sector, such as aged care services and hospitality, which is reflected in our unemployment data: while headline unemployment over the last three years has declined to 5.5%, the underemployment rate has been trending upwards since the GFC from 6% to now be 8.5% – see chart 7.

Chart 7: Australia’s labour market – underemployment continues to trend upwards

The long reach of globalization is now starting to touch the upper end of the services sector as well, with increasing numbers of accounting firms, engineering, software development, design and what-have-you ‘off-shoring’ work to the likes of Vietnam and India. If Australian accountants and designers want to compete they either have to stay ahead on the quality curve or reduce their costs (wages).

With the rise of AI it’s not just low skilled jobs that are being targeted, rather it’s any industry where wages form a high proportion of costs. For example, in the U.S. there’s a radiology ‘robot’ that is 50% better than its human counterparts at diagnosing particular tumors, and law firms are talking about cutting the human cost of litigation from 70% to 2% by using technology.

It’s reached the point now where if labor demands higher wages for a multitude of jobs they are battling an equation that has offshore workers or robots on the other side of it. Combine that with record levels of household debt, the risk of losing a job means for big chunks of the workforce there’s not much incentive to go in hard on your annual salary review.

The benefits go to capital

The big winner from the suppression of wages is, of course, the owners of the capital, that is, the companies. As we saw above profits are strong and getting stronger.

If that’s the case it makes it all the more critical that companies pay their fair share of tax. If wages are stagnant so too will be income tax revenue yet countries like Australia face a growing welfare and healthcare burden. And yet for now countries across the world are engaged in a race to the bottom for corporate taxes; a beggar thy neighbor strategy that risks impoverishing everybody.

Like I said, there’s a multitude of reasons to account for low wages growth, and just as with most economic arguments there’s almost no way of proving which one is right. Admittedly some of the trends have not existed long enough to make anything other than assertions and it may change on a dime. I’m by no means arguing we should try to fight a rising tide, but there are seriously important issues involved that will shape our economies and societies in the years ahead.

What’s behind the share markets going up?

What’s behind the share markets going up?

As at yesterday the S&P 500 had gone 252 days without experiencing a 3% correction, which is the longest streak on record and last Friday marked the 24th time the three major US stock market indices, the S&P 500, Dow Jones and NASDAQ, closed at simultaneous record highs.

If you listen to the market commentary a key reason for the steady climb is the anticipation of tax cuts from the Trump administration. I was recently talking to a friend and said I thought tax cuts have got nothing to do with the market’s record breaking run, which is, of course, a silly thing to say.

There is always a bunch of factors that go together to make the market, and anticipation of tax cuts could well be one of them. What I should have said is I reckon it’s only a small one – though that’s almost impossible to prove.

It’s pretty easy to mount an argument that the two most influential factors on share prices tend to be corporate earnings growth and sentiment, and hopefully the charts below illustrate at least the first of those.

Chart 1, courtesy of Brandywine Global, shows the year on year earnings growth for the US and I’ve added the red line to emphasise the very healthy positive trend over the past five quarters, since it bottomed in 2Q 2016.


Chart 1: S&P 500 trailing 12 month year on year earnings growth
Source: Bloomberg, Brandywine

If you accept that markets tend to be forward-looking, it shouldn’t be a surprise that the S&P 500 bottomed in 1Q 2016, just ahead of the change in direction of earnings growth, see chart 2, and has risen in line with that healthy positive trend since.

Chart 2: S&P 500
Chart 2: S&P 500
Source: IRESS

The same applies to Europe, where stock prices again bottomed just ahead of the decline in earnings growth around 1Q 2016 and then rose in line with the positive trend that followed – see charts 3 and 4. Interestingly, you can see the European index flattened off in the last couple of quarters just as the pace of earnings growth backed off a little, unlike in the US where the rate of earnings growth has continued to go up, as have share prices.


Chart 3: Stoxx 600 (Europe) trailing 12 month year on year earnings growth
Source: Bloomberg, Brandywine


Chart 4: Morningstar Eurozone Index
Source: IRESS

Likewise, the wave pattern traced out by the Nikkei in Japan also follows the rate of year on year earnings growth – see charts 5 and 6.


Chart 5: Nikkei 225 (Japan) trailing 12 month year on year earnings growth
Source: Bloomberg, Brandywine


Chart 6: Nikkei 225 Index
Source: IRESS

US tax cuts are a long way away, if they’re going to come at all and of course they’ve had zero effect on corporate earnings growth so far. Attributing the market’s rise to investors anticipating their arrival is what’s called a ‘narrative fallacy’, in other words, someone gets a microphone shoved under their nose and asked ‘why did the market go up today?’ They look around and latch on to the most obvious piece of news to hand, in this case, tax cuts, or it could just as easily be elections, or geopolitical events. Just ask yourself, why should potential US tax cuts underwrite a rise in European and Japanese stocks?

When it comes to explaining why share prices are going up, things like company earnings, business confidence and economic surprises tend not to be in the headlines so are that much harder to see, but they make a lot more sense.