Jobkeeper Payment

Jobkeeper Payment

The Federal Government last night announced its 3rd, and largest, round of stimulus with a $130 billion package aimed at businesses impacted by the COVID-19 pandemic. Eligible businesses will receive a fortnightly wage subsidy up to $1,500 per eligible employee as part of a Federal Government action to prevent the significant jobs losses due to the COVID-19 pandemic. 

 The Government has released a helpful Fact Sheet detailed below.  

OBLIGATIONS ON EMPLOYERS

To receive the JobKeeper Payment, employers must:

  • Register an intention to apply on the ATO website and assess that they have or will experience the required turnover decline.
  • Provide information to the ATO on eligible employees. This includes information on the number of eligible employees engaged as at 1 March 2020 and those currently employed by the business (including those stood down or rehired). For most businesses, the ATO will use Single Touch Payroll data to pre-populate the employee details for the business.
  • Ensure that each eligible employee receives at least $1,500 per fortnight (before tax). For employees that were already receiving this amount from the employer then their income will not change. For employees that have been receiving less than this amount, the employer will need to top up the payment to the employee up to $1,500, before tax. And for those employees earning more than this amount, the employer is able to provide them with a top-up.
  • Notify all eligible employees that they are receiving the JobKeeper Payment.
  • Continue to provide information to the ATO on a monthly basis, including the number of eligible employees employed by the business.

BACKGROUND ON JOBKEEPER PAYMENT

Under the JobKeeper Payment, businesses impacted by the Coronavirus will be able to access a subsidy from the Government to continue paying their employees. Affected employers will be able to claim a fortnightly payment of $1,500 per eligible employee from 30 March 2020, for a maximum period of 6 months.

Eligible empyloyers

Employers will be eligible for the subsidy if:

  • their business has a turnover of less than $1 billion and their turnover will be reduced by more than 30 per cent relative to a comparable period a year ago (of at least a month); or
  • their business has a turnover of $1 billion or more and their turnover will be reduced by more than 50 per cent relative to a comparable period a year ago (of at least a month); and
  • the business is not subject to the Major Bank Levy.

The employer must have been in an employment relationship with eligible employees as at 1 March 2020, and confirm that each eligible employee is currently engaged in order to receive JobKeeper Payments.

Not-for-profit entities (including charities) and self-employed individuals (businesses without employees) that meet the turnover tests that apply for businesses are eligible to apply for JobKeeper Payments.

Eligible employees

Eligible employees are employees who:

  • are currently employed by the eligible employer (including those stoo down or re-hired);
  • were employed by the employer at 1 March 2020;
  • are full-time, part-time, or long-term casuals (a casual employed on a regular basis for longer than 12 months as at 1 March 2020);
  • are at least 16 years of age;
  • are an Australian citizen, the holder of a permanent visa, a Protected Special Category Visa Holder, a non-protected Special Category Visa Holder who has been residing continually in Australia fro 10 years or more, or a Specia Category (Subclass 444) Visa Holder; and
  • are not in receipt of a JobKeeper Payment from another employer.

If your employees receive the JobKeeper Payment, this may affect their eligibility for payments from Services Australia as they must report their JobKeeper Payment as income.

APPLICATION PROCESS

Business with employees

Initially, employers can register their interest in applying for the JobKeeper Payment via ato.gov.au from 30 March 2020.

Subsequently, eligible employers will be able to apply for the scheme by means of an online application. The first payment will be received by employers from the ATO in the first week of May.

Eligible employers will need to identify eligible employees for JobKeeper Payments and must provide monthly updates to the ATO.

Participating employers will be required to ensure eligible employees will receive, at a minimum, $1,500 per fortnight, before tax.

It will be up to the employer if they want to pay superannuation on any additional wage paid because of the JobKeeper Payment.

Further details for businesses for employees will be provided on ato.gov.au

Businesses without employees

Businesses without employees, such as the self-employed, can register their interest in applying for JobKeeper Payment via ato.gov.au from 30 March 2020.

Businesses without employees will need to provide an ABN for their business, nominate an individual to receive the payment and provide that individual’s Tax File Number and provide a declaration as to recent business activity.

People who are self-employed will need to provide a monthly update to the ATO to declare their continued eligibility for the payments. Payment will be made monthly to the individual’s bank account.

Further details for the self-employed will be provided on ato.gov.au.

Employer with employees on different wages

Adam owns a real estate business with two employees. The business is still operating at this stage but Adam expects that turnover will decline by more than 30 per cent in the coming months. The employees are:

  • Anne, who is a permanent full-time employee on a salary of $3,000 per fortnight before tax and who continues working for the business; and
  • Nick, who is a permanent part-time employee on a salary of $1,000 per fortnight before tax and who continues working for the business

Adam is eligible to receive the JobKeeper Payment for each employee, which would have the following benefits for the business and its employees:

  • The business continues to pay Anne her full-time salary of $3,000 per fortnight before tax, and the business will receive $1,500 per fortnight from the JobKeeper Payment to subsidise the cost of Anne’s salary and will continue paying the superannuation guarantee on Anne’s income;
  • The business continues to pay Nick his $1,000 per fortnight before tax salary and an additional $500 per fortnight before tax, totalling $1,500 per fortnight before tax. The business receives $1,500 per fortnight before tax from the JobKeeper Payment which will subsidise the cost of Nick’s salary. The business must continue to pay the superannuation guarantee on the $1,000 per fortnight of wages that Nick is earning. The business has the option of choosing to pay superannuation on the additional $500 (before tax) paid to Nick under the JobKeeper Payment.

Adam can register his initial interest in the scheme from 30 March 2020, followed subsequently by an application to ATO with details about his eligible employees. In addition, Adam is required to advise his employees that he has nominated them as eligible employees to receive the payment. Adam will provide information to the ATO on a monthly basis and receive the payment monthly in arrears.

Employer with employees who have been stood down without pay

Zahrah runs a beauty salon in Melbourne. Ordinarily, she employs three permanent part-time beauticians, but the government directive that beauty salons can no longer operate has required her to shut the business. As such she has been forced to stand down her three beauticians without pay.

Zahrah’s turnover will decline by more than 30 per cent, so she is eligible to apply for the JobKeeper Payment for each employee, and pass on $1,500 per fortnight before tax to each of her three beauticians for up to six months. Zahrah will maintain the connection to her employees, and be in a position to quickly resume her operations.

Zahrah is required to advise her employees that she has nominated them as eligible employees to receive the payment. It is up to Zahrah whether she wants to pay superannuation on the additional income paid because of the JobKeeper Payment.

If Zahrah’s employees have already started receiving income support payments like the JobSeeker Payment when they receive the JobKeeper Payment, they will need to advise Services Australia of their new income.

Why treating a government like it’s a household is simply wrong

Why treating a government like it’s a household is simply wrong

Part 1

Conventional economics is having a really hard time explaining what’s going on in much of the world today: how can we have such low inflation when interest rates are at record low levels? How can some governments consistently run deficits, that look for all the world like they could never be repaid, and yet their bond yields are going down, not up? How come those economies where central banks have been pumping in stimulus for years, are still showing sluggish rates of growth?

The same questions have left many investors perplexed as asset prices stay high while they read about a range of risks.

It makes sense that if conventional thinking can’t explain what’s going on, then it’s time to look elsewhere. There is one school of economic thought that’s been talking about the inevitability of declining inflation and interest rates for years. It has not just a plausible, but also logical, explanation for many of the conundrums that leave orthodox economists scratching their heads.

However, that school of thought is so unconventional, and requires such a radical change to long-accepted wisdom, that those orthodox economists, including some of the best known names in the industry, have been lining up to ridicule it. But the most common criticisms sometimes show at best a lack of understanding, and at worst, an unwillingness to think differently.

That new school of thought is known as Modern Monetary Theory, which is commonly abbreviated to MMT. The first problem MMT has is its name, which is simply not a good description of what it is.

While it is indeed modern, having been developed in the early 1990s, it could easily be mistaken as a new version of ‘monetarism’, which was the economic theory developed by Milton Friedman and the Chicago School back in the 1960s that advocated, amongst other things, that markets are best at determining the optimal allocation of resources, so the role of government should be minimised and indeed fiscal spending is not only ineffective but irresponsible, because the resulting government borrowing will end up increasing interest rates, inflationary expectations, or future taxation in order to fund it.

But if that thinking’s right, then how is it that Japan and the US, both with massive government deficits, can reduce tax rates and have falling inflation and interest rates?

MMT is, in fact, the antithesis of monetarism, arguing governments must spend in order to achieve full utilisation of an economy’s resources. In that sense, it’s closer to Keynesianism. Finally, it’s not really a ‘theory’, it’s actually a straight up application of accounting rules to explain how money works in an economy where the government controls its own currency, in other words, an economy like Australia’s.

One of MMT’s most controversial insights is that such a government cannot be insolvent, that is, it can never run out of money, however, it can go broke. How that works is a government creates brand new money whenever it injects more in fiscal policy that it takes back in taxes, so, by logical extension, it can never run out.

However, that money is effectively backed by all the resources of the economy: all the workers, machines, factories and farms. If every single one of the workers suddenly disappeared, so there’s nobody left to run the machines, then the economy’s stuffed and the money is worthless. The government would be broke.

In this sense, one of the hardest lessons to get your head around that MMT teaches us, is that treating a government like it’s a household is fundamentally wrong. A household doesn’t control its own currency, so it can easily become both insolvent and broke. If a household spends more than it earns, or takes on too much debt, it’s in big trouble.

Because a government can create money at will, MMT points out that government spending is not constrained by a lack of funds. This is where conventional economists yell indignantly that MMT is preposterous: telling a government it can spend as much as it wants is a sure-fire recipe for inflationary disaster, and they’ll often refer to Venezuela, Zimbabwe or the Weimar Republic of the 1930s as examples of what happens when governments spend money as if there were no limits.

But MMT explicitly acknowledges the existence and risks of government deficits and inflation. What it says though, in a very simplified example, is imagine the economy is like a giant department store where both the private sector and the government sector shop for the things they need, everything from hospitals, to cars, workers, or soldiers. If some of the stock is not being bought by the private sector, that means there’s excess capacity and you’d expect prices will not be rising. It follows the government is able to go to the store and keep buying things with its printed money until all the stuff in the shop is being sold before you’d expect prices to rise.

One of the critical things to remember about MMT is it’s not a policy framework, it’s simply a model of how money works in a modern economy and this has been a very brief and basic overview of what is a complex and sophisticated body of work that’s gaining increasing traction as the most logical explanation of a variety of situations that conventional economics is at a loss to explain.

Part 2

In the first part of this overview of Modern Monetary Theory, I suggested it provides the most logical explanation of what’s going on in the world’s economies that conventional economics is simply at a loss to account for.

One of the unexplained mysteries is how countries can have the lowest interest rates in history, which is supposed to stimulate the economy, with low unemployment and yet economic growth is also, surprisingly, low.

Back in the early 1980s the US central bank ‘put the inflation genie back in the bottle’ by cranking interest rates all the way to 20%. Soon after that, governments the world over happily passed responsibility for managing economic growth to their central banks in the form of targeted inflation and unemployment rates.

The problem is, central banks only have one weapon: short-term interest rates, also known as the cash rate. In an effort to stimulate growth over the past almost 40 years, central banks have been steadily reducing interest rates. Occasionally they’ve had to raise them when lending growth got out of hand, but the overall trend has been a steady decline.

The other side of this story is governments at the same time tried to minimise budget deficits, on the basis that conventional economic theory dictates it’s prudent economic management. However, another of MMT’s insights is that government spending creates money and activity. When a government spends more than it takes back in taxes, referred to as a budget deficit, it’s injecting money into the economy. But when it runs a budget surplus, it’s sucking money out of the economy, meaning the only way for the economy to grow is by the private sector making up for the reduction of government money in the system by running down their savings and borrowing money.

Here in Australia, the Howard government was lauded for running budget surpluses, so how did the economy grow so strongly over that period? In short, there was a credit boom. Household savings rates fell from 4% to -1%, and credit growth averaged around 12%, peaking as high as 16% in 2005. The result was household debt increased from around $200 billion to $900 billion, representing an almighty credit impulse to offset the lack of government spending.

MMT identified ages ago that relying on households to borrow in order to stimulate the economy will only work for so long, because eventually borrowing capacity maxes out and you’re left with the situation we have now, rates are the lowest they’ve ever been but credit growth is also the lowest since they started tracking it in 1977. Economists call it ‘pushing on a string’.

Not surprisingly, Philip Lowe, the governor of the Reserve Bank of Australia, has been all but begging the government to crank up fiscal spending in order to support the economy. And he’s not the only one, central bankers across the world, acknowledging that monetary policy has reached the end game, have been calling on governments to start doing some of the heavy lifting by increasing fiscal spending.

The problem is politicians are stuck in the conventional economic mindset that presumes a government’s finances are the same as a household’s, which we learned above is fundamentally wrong, since a household cannot print its own money. A government that can print its own money is never financially constrained.

MMT does, however, acknowledge that a government is constrained by its economy’s total resources. Once government spending hits a level where it’s competing against private spending, prices will go up and inflation sets in.

Until that point, though, accumulated government deficits simply represent money the government has put into the economy that hasn’t been taken back out again by taxes. Another of MMT’s insights that conventional economists find hard to swallow, is that accumulated deficits don’t represent a burden on future generations that will result in crushing interest rates or catastrophically weak currencies as overseas investors refuse to fund our indulgent spending.

The best illustration of that is Japan, where government debt is 240% of GDP. As remarkable as it is, the government could print a ¥1,000,000,000,000,000 (that’s one quadrillion) yen note tomorrow and the debt will be instantly extinguished. Ah, but, the conventional economists scream, no one would ever trust the Japanese government again. Realistically, no one expects the government to repay that debt, ever, and it’s going up at about ¥1 million every two seconds! And yet the world continues to trade with Japan, the Yen is seen as a ‘safe haven’ currency and inflation has averaged around 0% for the last 25 years.

While MMT asserts government spending is not financially constrained, it also acknowledges some government spending is better than others. A big chunk of President Trump’s US$1.5 trillion of tax cuts went into the pockets of people who were already net savers, so the growth benefit was muted. That same US$1.5 trillion could have been used to eliminate student debt and almost all the money would have gone into the pockets of people who are net spenders, so the growth impact would have been far more pronounced.

Similarly, governments can spend on infrastructure, education, promoting R&D, or improving health, all things that underwrite long-term growth.

MMT uses iron clad rules of accounting to describe how government finances work, which is a such a radically different approach to conventional wisdom that it is understandably meeting stiff resistance, but if conventional thinking can’t explain what’s going on, then clearly it’s time to think unconventionally. With Australian households unable, or unwilling, to take on more debt to underwrite economic growth, and the Morrison government doggedly insisting it will deliver a budget surplus, the MMT school would be suggesting that does not auger well for a bright near-term outlook.

Inequality: how it happened and what do we do about it?

Inequality: how it happened and what do we do about it?

Simply voting out Donald Trump won’t do it, nor will a soft or hard Brexit. The underlying anger, disillusionment and discontent that’s manifested as a rise in populist politics and boneheaded nationalism across the world is driven by a deep-seated dissatisfaction with the status quo. There are a lot of people pissed off that the world has apparently enjoyed decades of economic growth and they still feel like they’re struggling to make ends meet.

The ’neo-liberal’ philosophy of minimising the role of government and instead allowing free enterprise to unleash the potential of unbridled market forces was adopted by Margaret Thatcher and Ronald Reagan as the solution to another period of economic dislocation. The problem is, once the path toward recovery was established it’s been followed all the way to the other extreme, and extremes are rarely a good place.

Some 30 years after neo-liberalism was seen as saving the developed world, labour’s share of the economic pie has shrunk to 60-year lows in Australia, 70-year lows in the UK and as low as it’s ever been in the US. This has contributed to inequality hitting levels that in the past underpinned social and economic upheaval, elevating it to the current buzz-topic across developed economies globally. However, effecting the change required to even things up again requires coming up with a way to undertake significant redistribution, which is almost always via the tax system, so it will either take brave and foresightful politicians, or some kind of popular revolt.

The start of neo-liberalism: a solution for the times

When Margaret Thatcher was voted in as the leader of Britain’s opposition Conservative Party in 1975, unemployment was super low at about 4% but the inflation rate peaked at an eye-watering 27%, and, after GDP growth had hit 7% in 1973, the country was in recession with growth at -2%. It was a time when unions regularly threw their weight around and paralysing strikes would hold the economy to ransom; the so-called ‘winter of discontent’ in 1978-79 saw almost 30 million working days lost to strikes, the most since 1926, which led to the May election where the Labour government suffered an almost record defeat.

People were demanding change and the new Thatcher government took power on a platform of confronting the unions and allowing markets to flourish by getting government out of the way. After a couple of bumpy years early on, characterised by sometimes violent conflicts over strikes, between 1982 to when her government was voted out in late 1990 GDP growth in the UK averaged 3.3% per annum, GDP per capita had more than doubled, the share market had more than tripled and inflation had fallen from 18% in 1980 to 9.5% in 1990.

Times were good and Thatcher’s neo-liberal philosophies were enthusiastically embraced across the Atlantic by President Reagan, with his now legendary assault on ‘big government’ and the unshackling of corporate and market power. In 1980, the year Reagan was elected, things were grim for the US: inflation was running at 13.5%, unemployment was 7.2% and rising and the economy was in recession. By the time Reagan left office in 1989, having pursued his ‘Reagonomics’ version of supply-side economics (which argues cutting taxes and reducing regulatory burdens leads to more growth and the benefits will ‘trickle down’ from the top all the way to the bottom), inflation was 4.6%, unemployment was 5.4% and GDP had averaged 4.4% per annum since 1983. The US stock market more than doubled during Reagan’s tenure and the go-go, get rich era of the ‘80s was captured by the inimitable words of Gordon Gekko: “greed is good”.

The concentration of money and power

With such a stunning turnaround in economic fortunes, why wouldn’t you continue on the same path? If a bit is good then more has to be better, right? Across the developed world, but especially in the Anglosphere, governments continued to reduce their role in markets by cutting back regulations and selling off publicly-owned assets and enterprises, allowing companies to go on to even bigger and better things.

In the US, hand in hand with the rollback of those pesky market regulations and the increasing concentration of wealth, the ultra-rich built an increasing political influence. In the landmark, and widely criticised, 2010 Citizens United ruling the Supreme Court paved the way for unlimited political donations through “PACs”, or Political Action Committees, not only by individuals but, almost incomprehensibly, by companies as well. According to The Harvard Magazine, so-called super-PACs accounted for 22% of total donations in the 2012 presidential race, but by 2016 it was 37%. What’s more, The Washington Post reported that only 50 donors accounted for almost half the funds raised. While there are a few very high profile left-leaning billionaires, like Warren Buffett, Jeff Bezos, Bill Gates and Michael Bloomberg, in a 2018 paper, academics from Columbia and Harvard concluded the vast majority of America’s top 100 billionaires quietly, but actively, support right-wing organisations. The most notorious of those are the Koch brothers, each worth an estimated $50 billion, and responsible for creating the super conservative Americans for Prosperity (AFP) group, which boasts some three million grass roots members and aggressively promotes a free market, small government agenda.

A key part of AFP’s activities has been campaigning for the emasculation of trade unions, which reaps a double harvest: it strengthens the corporate sector by dramatically improving the stability of labour markets, largely by preventing workers from being able to collectively bargain, plus it undermines one of the principal sources of funding for the Democrats and left-leaning causes. In 1983 more than 20% of US workers belonged to a union, and by 2016 it was less than 11%, and the number of private sector workers in a union had fallen to the lowest level since the Great Depression. This trend has been echoed in the UK, where by 2017 trade union membership had fallen to an all-time low and the 300,000 working days lost to strikes was amongst the lowest since records started in 1899. And in Australia union membership has fallen from 51% of all workers in 1976 to 14% today, the lowest in at least 70 years.

The Pew Research Centre writes that stripping workers of their collective bargaining power has resulted in widespread wage stagnation, with real wages for average workers in the US remaining virtually unchanged since 1979. For a stark illustration of the difference between the pre and post neo-liberal eras, between 1950-1980 real incomes for the bottom 20% of US wage-earners grew at an almost identical rate to the top 5%, but between 2000-2018, the top 10% saw five times the increase in real wages of the bottom 10%. Today in the US, the biggest companies can wield such extraordinary levels of power that 25% of workers are being subjected to non-compete clauses – even fast food workers! The Federal minimum wage has been set at US$7.25 since 1991 and we were reminded during the recent government shutdown that a 2017 survey found 78% of American workers live paycheque to paycheque, and last year a Fed survey found 40% of adult Americans would be unable to come up with US$400 in an emergency.

The story on wages reads quite similarly in Australia, where in the March quarter of 2017 labour’s share of national income fell to its lowest since 1960. Over the 12 months to the end of March 2017, Australian workers received less than 10 cents of each extra dollar in GDP that they produced, which was the slowest rate of flow through ever recorded.

The GFC – a step too far?

It’s possible a turning point came with the Global Financial Crisis in 2008, the epicentre of which lay in the American housing heartland. The finance industry, and most especially Wall Street bankers and the credit rating agencies, screwed up monumentally; outright greed, combined with negligence and fraud, culminated in a near death experience for the world’s financial system. The only way to save it was using the public purse – taxpayers’ money – to bail out the private banks, starting in the US, where the 2009 budget deficit blew out from an original forecast of US$407 billion to eventually hit US$1.4 trillion (these days the word trillion gets thrown around a fair bit and it’s easy to become a bit blasé about it, but to put that amount of money into its mind blowing perspective, one billion seconds is just short of 32 years, one trillion seconds is just short of 32,000 years).

And no sooner was the US economy off life support than Europe took its place with its ‘sovereign bond crisis’, thanks to a combination of either over-indebted governments that had gorged themselves on apparently cheap debt in vote-buying public spending campaigns, or governments that became over-indebted because they felt they couldn’t afford not to bail out private sector banks and property companies teetering on the edge of collapse.

Those people entrusted with the stewardship of entire countries had overseen a gargantuan mess and seemed to be making things up as they went. The result: economies all over the world were slammed into reverse, in 2009 US GDP growth fell to -2.8% and unemployment hit 10%, and EU growth was -5.4%, with unemployment eventually hitting 11% in 2013, while Spain and Greece both reached unemployment rates of 27%.

But despite plenty of evidence, and hundreds of candidates, nobody was found culpable for the greatest financial disaster in three generations. Although US banks were fined and had their lending wings clipped, Wall Street bonuses were back at record levels within a few years. What’s more, the remedy used to keep the markets from falling even further, where central banks from the US, Europe, Japan and the UK pumped unprecedented amounts of liquidity into the financial system, inflated the value of all kinds of assets, from shares, to property, to art collections, to fancy number plates – the kinds of things already wealthy people own.

Is it any wonder the average person was left feeling the system is rigged?

The growth, and growth, and growth of inequality

Inequality has become the topic du jour, but it’s worth revisiting some of the numbers. In the three decades after World War 2 the US enjoyed one of its strongest periods of economic growth as manufacturing took root and blossomed across the country. Households greedily consumed all the new-fangled appliances and most of them were “Made in the USA”, everything from washing machines, to televisions, to cars. An endless string of new factories provided well paid jobs for unqualified workers, and as the nation got richer, everybody benefited.

Then once neo-liberalism took hold things started to change. The US Congressional Budget Office found that between 1979-2011 the ‘market income’ for the bottom 80% of workers grew by 16%, or less than 0.5% per year; for the next 19% incomes grew three and a half times faster, at 56%, and for the top 1%, incomes grew almost 11 times faster, or 174%. In 1965, the average CEO earned 20 times the wage of the average worker, and by 2018 that number had exploded to 361 times for the CEO of an S&P500 company.

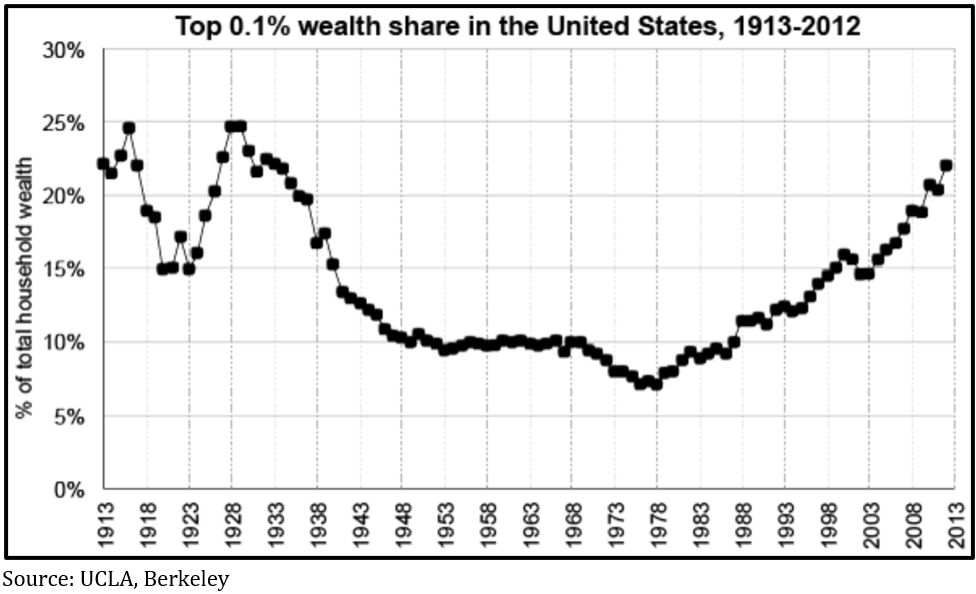
But that’s just income, the richest people also own lots of assets, often interests in companies, and the value of those assets has rocketed as well, especially since the GFC. In 1979 the top 1% in the US owned 24% of the total wealth and by 2012 that had increased to 42%, so not far off doubling. But what is far more telling, the share of wealth owned by the top 0.1% had sat around 10% for most of that glorious post-war period and bottomed out in (you guessed it!) 1979 at 7%, but then more than tripled to 22% by 2012! See chart 1.


Chart 1: The Top 0.1% wealth share in the United States, 1913-2012
Inequality how it happened and what do we do about it_chart1

But it’s more than just a US phenomenon. By 2017 the UK’s top 10% of income earners had increased their share of national income by 50% while all the other cohorts fell, and according to Oxfam, by 2016 the top 1% of UK households held 29 times as much wealth as the bottom 20%.

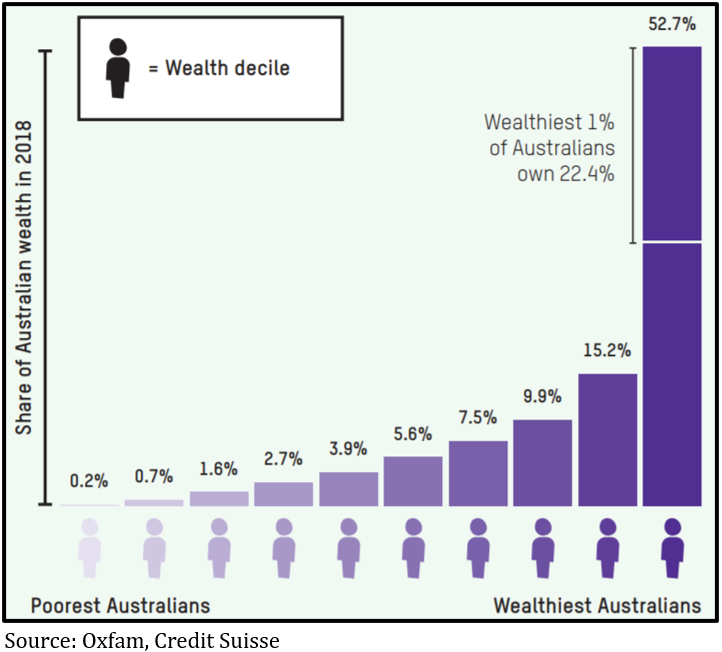
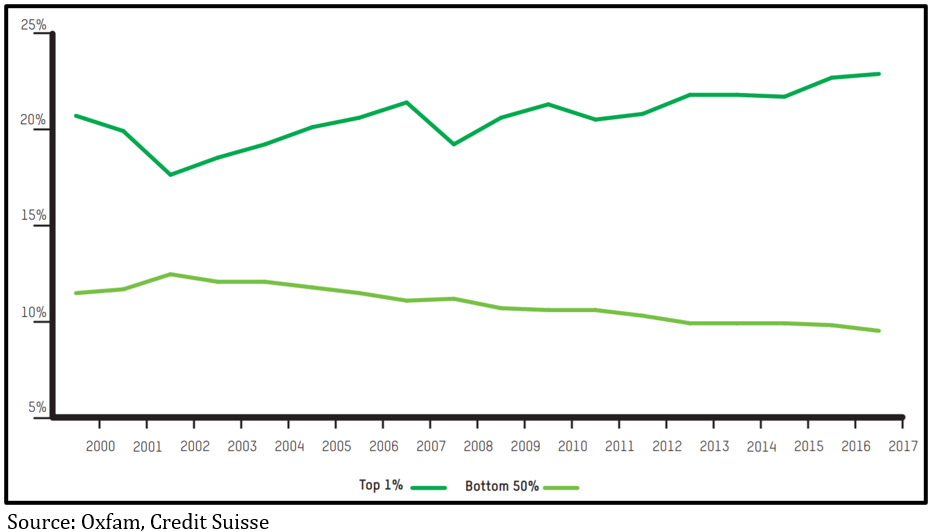
Australia is just as bad: according to Oxfam Australia’s top 1% has more wealth than the bottom 70% – see chart 2, and it has been growing over the past 20 years, while the bottom 50% has been steadily declining and now sits at 9%, the greatest wealth gap in generations.


Chart 2: Australian wealth distribution in 2018

Chart 3: Share of wealth in Australia held by the top 1% vs bottom 50%

And perhaps the most stunning stats of all: in Oxfam’s annual wealth report released to coincide with the Davos conference in January, they concluded the 26 richest people in the world have as much wealth as the poorest 3.8 billion, while in 2016 it took the top 61 billionaires. Fully 82% of the wealth created in 2017 went to the top 1%, and in 2018 their wealth increased by 12% while the bottom half’s went down by 11%.

What do you do when the status quo isn’t working for you anymore?

It can hardly come as a surprise that people started pushing back against the status quo that hasn’t been working for them for decades. It may well have helped Barack Obama get elected on a promise of hope; a promise of building a bridge to cross the political divide that would deliver radical changes; but promises that were ultimately choked by even greater partisan politics.

By the time Trump came along talking about how he’s going to ‘drain the swamp’, the contempt for politics as usual translated into embracing an iconoclast who didn’t talk like the others, and, even better, wasn’t a product of the same political machine. On the other side Bernie Sanders, the Democrat candidate who lost the nomination to Hilary Clinton, captured similar support despite being a self-described socialist. Both managed to push the right hot buttons, albeit in obviously different ways: Sanders talked about improving things for people by redistributing wealth away from the 1%, while Trump appealed to a nostalgia for when America was the undisputed champion and promised to improve peoples’ lives by bringing the factories back home and stopping immigrants from taking their jobs. It didn’t matter they were promises he could never keep, what mattered was he used simple messaging to reassure them he would challenge the status quo.

And so the thirst for change has rolled on, with voters seduced by messages of either radical change to make things better and fairer, like Brexit, or nationalistic scapegoating, like Turkey, Hungary, Poland, Italy, Austria, Sweden, The Philippines and Brazil.

The Shakespearean drama that has been Australian politics over the past five years (or longer) has in part been swept along by similar winds of change. The same resentment of the status quo has given rise to a cluster of far-right parties whose dog-whistle populism threatens to gain such traction in marginal seats that Malcolm Turnbull’s antagonists felt they had to try to outflank them, only to find their misreading of the broader public’s tolerance for screwing with the will of the people was as appalling as their inability to count party room votes.

At some point Australian politicians might realise the quality voters are desperate for is authenticity: the ability to answer a question without sticking to a message; to admit that not everything the other side says is automatically wrong; to acknowledge that compromise can mean progress rather than weakness.

The answer… is going to be hard

Simply voting Trump out of office, or changing all the right wing governments for left wing, or holding politicians to a higher standard won’t solve the underlying problems caused by growing inequality. Ultimately that requires redistribution, and that can only be done through the tax system. Obviously the chance for people to get rich is kind of essential to how capitalism works, but tax is the price we pay for living in a modern democracy where the government is responsible for providing a host of essential services. It’s a question of finding the right balance.

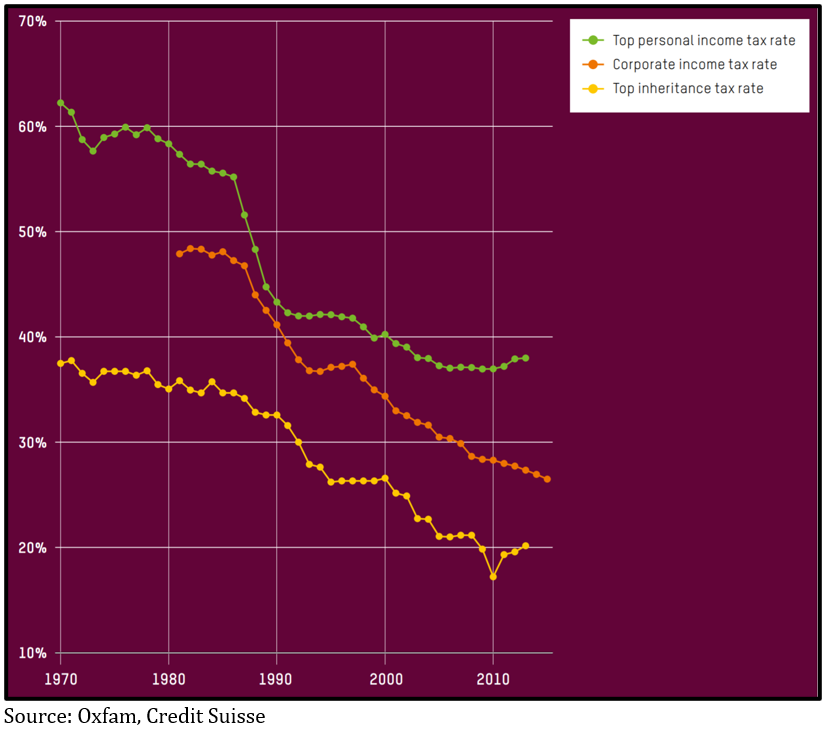
Understandably tax sets off a pretty visceral response in most people, especially those on the top Australian tax bracket who see 47% of their earnings taken out every month, already a high rate by international standards. But perhaps it won’t come as a surprise that over the period when inequality has widened, governments across the developed world have been reducing the top rate of both personal and corporate income tax, with the average top personal rate falling from 62% in 1970 to 38% in 2013 – see chart 4. Oxfam writes in its 2019 report on inequality:

As recently as 1980, the top rate of personal income tax in the US was 70%, whereas today it’s almost half that, at 37%. When you also account for the numerous exemptions and loopholes, the rates the super-rich and corporations actually pay are lower still. As a result, in some countries the richest people are paying the lowest rates of tax in a century. In Latin America, for example, the effective tax rate for the top 10% of earners is just 4.8%. In some countries, when taxes paid on income and consumption (like our GST) are both considered, the richest 10% are paying a lower rate of tax than the poorest 10%.

Chart 4: The declining tax rates for top income earners and companies

Before high income earners scream “not more bloody taxes!”, there is a far better target for their anger: it’s estimated the super-rich are hiding at least US$7.6 trillion from the tax authorities, avoiding an estimated US$200bn in tax revenues. Similarly, multi-national corporations exploit loopholes to avoid paying billions in tax as governments around the world have jostled for position as the lowest taxing country for big companies. Last year Apple reported Australian sales of $8 billion, and, after the money went through a merry-go-round of transfer pricing, a gross profit of $255 million. That works out to a gross margin of about 3%, compared to the average gross margin it reported to the US stock exchange over the four quarters to March 2018 of 38%. The $77 million of tax Apple paid in Australia amounted to less than 1% of turnover. That is not an isolated incident, again, according to Oxfam:

For four consecutive years since 2013-14, more than one in three of Australia’s largest corporations have not paid any taxes in Australia – and 281 companies have not paid a cent in tax for all four years.

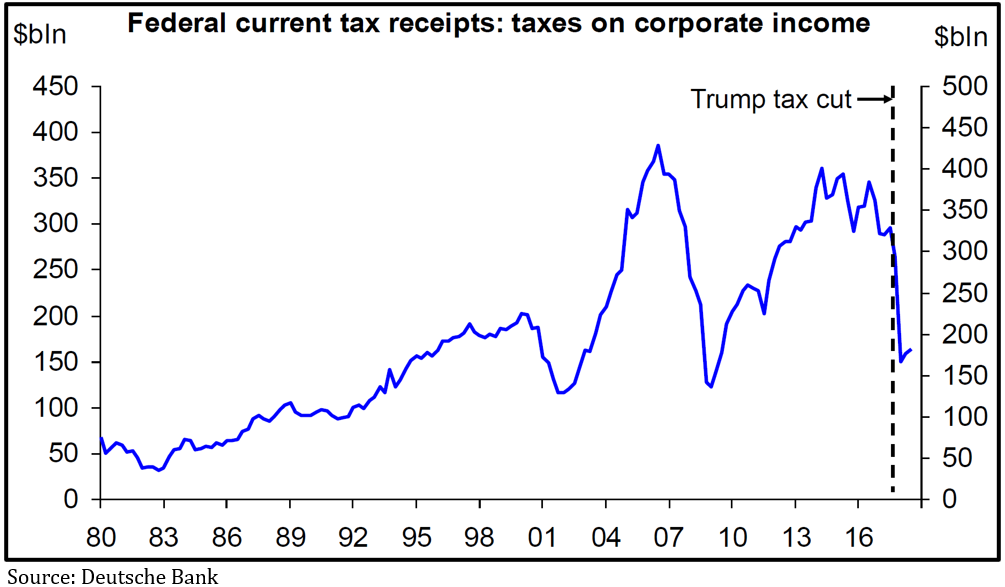
This reduction in company tax has very real consequences for a country’s budget. Chart 5 shows the impact the ill-timed US corporate tax cut is expected to have on government revenues, it’s $150 billion that has to be made up from somewhere else.


Chart 5: Cutting the US corporate tax rate has a very real impact on government revenues

None of what these companies is doing is illegal, but as long as it goes on, governments have to find other ways to plug the giant hole in tax revenue required to run the hospitals, pay the nurses, teachers and firemen, build roads and bridges and pay pensions – all the things expected of a modern, democratic society. The problem is, if they can’t tax companies, then wage earners are the obvious and easiest targets to come after simply because they have far fewer places to hide. So if you don’t want have an even greater tax chunk taken out of your monthly wages, you’d better hope sense prevails with respect to company taxes.

Are we seeing the early signs of change?

Clearly inequality is now commanding a great deal of the political debate, but until recently there hasn’t been a lot of coverage on how to address it. Five years ago, Thomas Piketty caused waves with his book about inequality over the ages, but perhaps not surprisingly an 814 page tome by a French economist with the catchy title of Capital in the Twenty-First Century never really hit the main stream.

That appears to be changing. Elizabeth Warren, one of the almost 30 contenders for the 2020 Democratic Presidential nominee, has proposed a headline grabbing ‘wealth tax’ of 2% per year on those with more than US$50 million in wealth, and freshman congresswoman, Alexandria Ocasio-Cortez, caused conservative commentators’ heads to spin when she recently expressed support for a 70% tax on income above US$10 million per year (by the way, if you haven’t seen her recent dissection of the diabolical state of US politics you really should). Also, Dutch historian Rutger Bregman’s admonition to get serious about tax at last month’s Davos Conference went viral, catapulting him to international in-demand radio and talk show guest.

Re-empowering labour is another step, though it’s in nobody’s interest for a return to the excesses of the 1970s. Sir Angus Deaton, Professor of Economics at Princeton, who won the 2015 Nobel Prize for his work on inequality, acknowledges trade unions are economically inefficient insofar as they stop GDP being maximised, but the extreme alternative is that all the benefits of GDP growth accrue to the owners of the capital – also a recipe for disaster. Again, it’s a question of finding the right balance.

Inequality is an issue for our times (amongst others) and finding a solution will be devilishly complex. It’s taken almost 40 years to have lurched from one extreme to the other, so it’s unlikely anything will happen quickly. As we approach an election here in Australia and the US presidential race starts its amazingly long run up, it would hardly be surprising if inequality assumes a higher and higher profile, leaving the obvious question: what are you going to do about it?

Have we borrowed too much to buy property?

Have we borrowed too much to buy property?

Buying residential property in Melbourne has been a great way to make money, with an astonishing total return over the 31 years to 2016 of 11.2% per year. The problem is, the majority of that return was capital gain, and almost all of that gain was underwritten by buyers taking on more and more debt, to the point that Australian households are now the second most indebted in the world. At some point households simply won’t be able to take on more debt, and then what happens?

I know I’m venturing into an area where emotions can run high, partly because the average Australian has an awful lot at stake when it comes to property values. I’ll say up front I’m definitely not advocating anybody rushes out and sells their property holdings, I’m simply offering some observations about residential property from an investment point of view. They may be right, or they might be way off the mark.

Property prices and debt

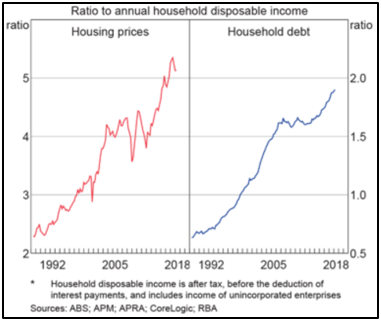
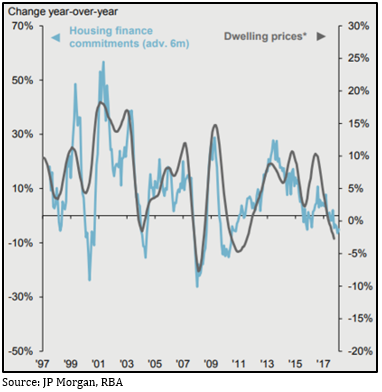
I don’t think it’s especially controversial to suggest there’s a logical relationship between the amount that people are prepared or able to borrow to buy property and how much they end up paying, but I reckon the two charts below kind of prove it.

Chart 1: RBA data suggests house prices have risen in line with the amount of household debt

Chart 1 RBA data suggests house prices have risen in line with the amount of household debt

Chart 2: There’s also a close relationship between loan approvals and house price growth

Chart 2 There’s also a close relationship between loan approvals and house price growth

Investing in property is, by definition, speculative

According to SQM the current ‘gross yield’, that’s the income you receive from rent before accounting for any taxes or costs, on Melbourne residential property is 2.9% per annum.

If you assume the property owner has a marginal tax rate of 37%, that brings it to an after-tax yield of 1.8%. Once you’ve accounted for all the other costs, such as management fees, body corporate fees, land tax, rates, insurances and what have you, you are very lucky to get a 1% ‘net yield’.

That same landlord could put their money in a term deposit paying 2.7% per annum; take out the 37% tax and the net yield is 1.7%, and there are no other costs to pay. Given that return is guaranteed by the government, we can call that the ‘risk-free rate of return’.

It’s a rock-solid law of investing that if the yield on an asset is less than the risk-free rate of return, then the investment is speculative, because the only way you can justify it is through capital gain. In other words, you’re banking on someone paying a higher price than you did.

Over the past 31 years, the capital gain on Melbourne housing has averaged 7.5% per year, so that speculative bet has been well rewarded, and it’s understandable for anybody to think that’s a well-established trend which is likely to keep going. The trouble is, it’s entirely reliant on people taking on more and more debt.

How expensive is residential property?

One way of working out the value of an investment is using what’s called a ‘price to earnings (PE) ratio’. That’s where you take the price of an asset and divide it by the earnings it generates per year; so if a $100 asset generates $10 of earnings per year, it’s $100 divided by $10, which gives you a PE ratio of 10 times.

The PE tells you how many years it would take for that investment to pay itself off and is effectively a measure of sentiment. If you’re pretty sceptical about an asset you’d want to get your money back sooner rather than later, so you might have a low PE of 4-5, but if you’re bullish on an asset you’ll be happier to have a higher PE.

You can use a PE ratio to measure the value of a share (it’s the share price divided by the earnings per share), or a property (the property value divided by the net yield). The current PE for the Australian share market is about 15 times. If we use the 1% net yield on property as above, that’s a PE of 100 (if you had a property worth $100,000 it would yield $1,000; $100,000 divided by $1,000 is 100).

That means Australian shares are currently 85% cheaper than Melbourne residential property. How can they be so out of whack? That would make a great dissertation topic for someone far smarter than me, but my hunch is debt has a lot to do with it. In 25 years in financial services I’ve yet to have a client tell me they’d be comfortable gearing a share portfolio to 80%.

Another comparison is M3 Property estimates the current yield on industrial property in Melbourne is 6.25%. Using similar costs as above you’d end up with a net yield almost four times that of residential property, or close to two and a half times the risk-free rate. Again, they seem way out of whack.

A final indicator of how expensive Melbourne’s residential property market is the Annual Demographia International Housing Affordability Survey, which compares how many multiples of median household income it takes to buy the median family home in 293 separate cities across nine different countries (Australia, US, UK, Japan, Hong Kong, Canada, New Zealand, Ireland and Singapore).

Melbourne is ranked as the sixth most unaffordable city (Hong Kong is the worst and Sydney is the second worst). Demographia rates a multiple of more than 5.1 times as ‘severely unaffordable’, and Melbourne’s is 9.9 (Sydney is 12.9).

Australia’s growing pile of household debt

It’s cliched to talk about how much Australians love their property, and it’s reflected not only in how much they’re prepared to pay for it but that they fund those high prices by going into more and more debt.

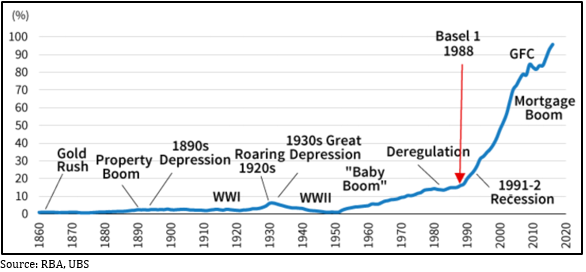
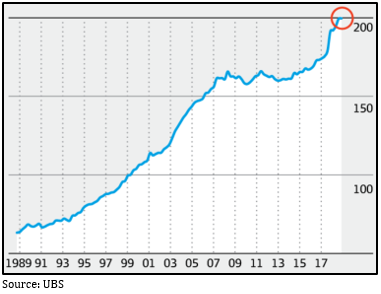
Chart 3 shows the amount of mortgage debt in Australia as a proportion of GDP and clearly shows when housing-related lending activity went parabolic. In 1988 the ‘Basel 1’ banking accord was introduced, which was an international agreement partly designed to make the banking system more stable by prescribing new limits for how much capital banks had to set aside as backing for different types of loans. Australian residential mortgages were considered relatively low risk, which meant the amount of capital required for them was set relatively low, meaning the return on equity for the banks from those loans was relatively high, so not surprisingly our local banks went to town lending to people to buy houses.

Chart 3: Australian mortgage debt as a proportion of GDP

Chart 3 Australian mortgage debt as a proportion of GDP

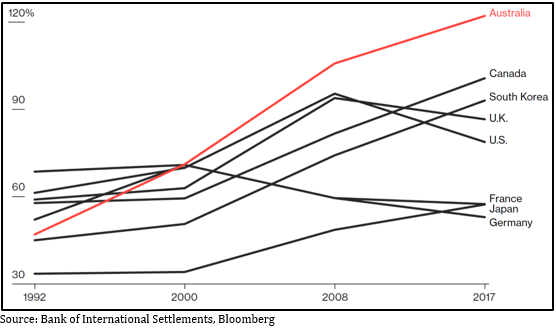
By any measure, Australian households now carry a lot of housing-related debt. The Bank of International Settlements (BIS) ranks Australian households as the second most indebted in the world (behind the Swiss, go figure) and chart 4 compares Australia’s household debt as a proportion of GDP to some other OECD countries and clearly shows the inexorable march upwards.

Chart 4: Household debt as a proportion of GDP

Chart 4 Household debt as a proportion of GDP

Something that strikes me, US household debt peaked at just below 100% of GDP right before the GFC smashed the property market, now it’s retreated to less than 80%. Ours is currently above 120%.

Chart 5 shows another measure: Australia’s household debt to disposable income. The remarkable thing here is it has grown at 10% compound per annum for the past 30 years. As they say, trees don’t grow to the sky; that is a phenomenal rate of growth in debt and at some point households simply won’t be able to gear up any further – everyone has to spend at least some of their income on living expenses.

Chart 5: Australia’s household debt to disposable income (%)

Chart 5 Australia’s household debt to disposable income (%)

The interest only problem

When you take out a mortgage to buy a property, there are two components to the loan repayments: the ‘principal’, which is the actual amount you borrowed, and the ‘interest’ you pay on the principal. It’s been popular for property investors to take out ‘interest only’ loans, meaning for (usually) the first five years they only pay the interest costs and none of the principal.

Why would you do that? There are some sound tax reasons around maximising deductible debt, but it also significantly reduces the monthly repayments. For example, if you take out a $500,000 loan at 4.66% it’s the difference between paying $1,942 versus $2,582 per month. Over five years that $640 per month adds up as a lower drain on your cash flow. The problem is of course, after five years you’ve not made any dent in the principal at all.

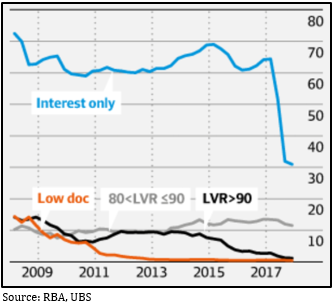
From 2008-2017 interest only loans accounted for about two-thirds of all investment loans and over that time the total amount tripled to peak at about $600 billion. Then in 2017 the Reserve Bank got sufficiently worried about the property market that they instructed the banking regulator, APRA, to cut back the amount of interest only lending. Chart 6 shows the sharp drop off in interest only lending when APRA told the banks to limit it to 30% of all new loans.

Chart 6: the % of interest only investment loans fell away in 2017 after APRA told the banks to cut back

Chart 6 the % of interest only investment loans fell away

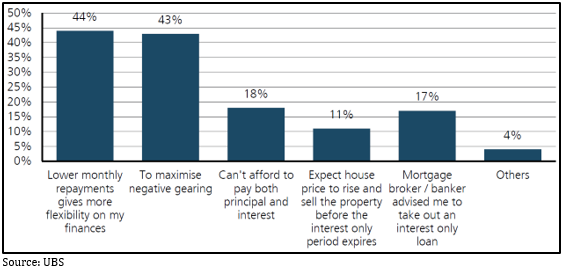
UBS recently did a study on why borrowers took out interest only loans – see chart 7. To begin with, terrifyingly, 5% of respondents didn’t even know whether they had an interest only or P&I loan; but 18% said they opted for interest only because they couldn’t afford P&I and 11% said they intended to sell the property before the loan rolled over to P&I. Also scarily, 17% said they took out an interest only loan because their mortgage broker told them to. All in all, the survey suggests at least half of all interest only borrowers don’t seem to have a solid grasp on what they’re doing.

Chart 7: Reason for taking out an interest only loan

Chart 7 Reason for taking out an interest only loan


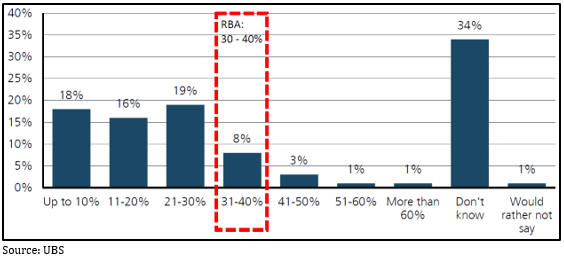
The same UBS survey also asked borrowers how much they thought their loan repayments would increase once it rolled over to P&I – see chart 8. The Reserve Bank reckons the average increase in monthly payments will be 30-40%, but worryingly, more than half under-estimated how much the increase will be, and again concerningly, more than a third had no idea, suggesting they’d not paid anywhere near enough attention.

Chart 8: Borrower’s estimate of the increase in mortgage repayments

Chart 8 Borrower’s estimate of the increase in mortgage repayments

The Reserve Bank estimates there’s a total of about $480 billion worth of interest only loans outstanding and $360 billion of those will roll over to principal and interest (‘P&I’) over the next three years. It also estimates that one-third of mortgages have less than a one month payment buffer. If all those numbers line up, that would imply one-third of the $480 billion of interest only loans have less than a one month buffer, so $160 billion worth. Of that, 18% say they won’t be able to afford the 40% jump in loan repayments when the loan rolls over to P&I, which is about $30 billion worth of loans. In a worst case scenario, that could point to a lot of forced property sales.

The banks have tightened credit standards

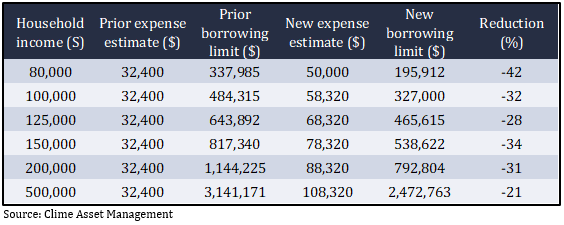
Until recently if you applied for a loan you would have to provide evidence of your income but not your expenditure. If the expenses in your loan application were less than a minimum amount the banks would simply use the so called Household Expense Measurement (HEM), which assumed $32,400 of expenses per year, to work out the amount they’d be prepared to lend to you.

After the recent Royal Commission into the banking and finance industry uncovered dodgy lending practices, the banks have been moving to tighten things up. Now they’re starting to require verification of both income and expenses, insisting on seeing things like bank and credit card statements. The upshot is the amount the banks are prepared to lend is estimated to drop by between 20-40% from previous levels – see chart 9.

Chart 9: New estimated borrowing limits based on revised expense estimates

Chart 9 New estimated borrowing limits based on revised expense estimates

Obviously, that simply translates into less money people can spend on buying a property, which you can only presume will feed straight into lower prices.

The washup

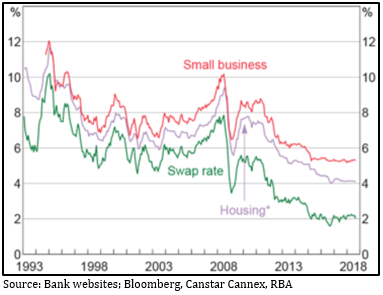
I know there have been calls for years that Australian housing is overvalued and dire predictions that our banking system is overexposed to it. I’m not making any such forecasts, I’m simply pointing out that there’s a limit to how much debt Australian households can take on to buy a house. Chart 10 shows the general trend of Australian mortgage rates has been downward for the last 25 years, which has underwritten a steady increase in borrowing capacity. If interest rates have indeed bottomed, will that cycle reverse?

Chart 10: Australian fixed interest rates have been on a downward trend for 25 years

Chart 10 Australian fixed interest rates have been on a downward trend for 25 years

The Reserve Bank has kept cash rates at a record low of 1.5% for more than two years and there’s no sign they’ll be raising them any time soon. However, Australian banks source a lot of their funding from offshore and rates there have already started to move upwards. We’ve already seen three of the big four banks raise mortgage rates a couple of months ago and there’s every chance they will do the same again. When borrowers are so stretched any tweak to rates has a very real effect.

I should emphasise, I’m not forecasting a crash in housing prices, there are a lot of arguments that the majority of Australian borrowers are well positioned to weather a downturn (though sometimes it’s hard to unravel where those arguments might be pushing someone’s barrow). Also, the Reserve Bank is acutely aware of how important the housing sector is to the overall Australian economy and will almost undoubtedly move to support it if necessary, and as the market adage goes, it’s unwise to argue against a central bank. What I am wondering is how sustainable the increase in household debt is, and if the answer is it has to slow, stop or even reduce, then what happens to house prices?

Death Duties and Super?

Death Duties and Super?

A recent article from Noel Whittaker titled ‘This is Australia’s version of a death tax’ prompted a few questions from some of our elderly clients.

It’s not really a ‘death tax’ as such, but it reminds people about how your superfund may actually pay tax upon your death.

We wrote a more comprehensive article on this very subject earlier in the year titled “What happens to my super when I die?” which you can access here.

To keep it simple, your super doesn’t incur tax on death if it’s passed onto a ‘dependent’, which is defined in this instance as a

  • spouse
  • child under the age of 18
  • any person over 18 years and financially dependent or in an interdependent relationship.

If the beneficiary doesn’t qualify as a ‘dependent’, a tax of up to 15% (plus the Medicare Levy) may apply to the ‘taxable’ component of your super balance. Your super generally consists of both a ‘taxable’ and a ‘tax free’ component, even if you’re in the pension phase.

There are strategies you can consider to reduce the ‘taxable’ component but given everyone’s situation is just that little bit different, it’s important you speak with your adviser, or alternatively call us, and we can work out the most appropriate and tax effective course of action.

Interesting enough, if you are over 65 years of age (or over 60 years and permanently retired from the workforce), you can simply make lump sum withdrawals from your super fund tax free. So, if you know your death is imminent, withdrawing your balance from super can be a way to avoid ‘Australia’s version of a death tax’. But be certain, because if it’s a false alarm, it may be that you can’t get your money back into the super environment, and you’re likely to be paying tax all over again.

As I previously mentioned, if you would like greater detail on superannuation death benefits, simply click here.