Does your portfolio have an airbag?

Does your portfolio have an airbag?

The December stock market correction was a timely reminder to get you thinking about whether your portfolio has enough built in safety features. But just like a car crash, it’s safer and smarter to worry about those features before you find out you really need them.

How much risk you’re prepared to take on in your portfolio is the single most important decision you’ll make. If you take on too much you’ll be lying awake at night worrying about when a market correction’s going to stop and battling the temptation to dump your shares and hide in cash, but if you don’t take on enough risk your portfolio could struggle to support the lifestyle you want.

The ‘risk’ in a portfolio largely comes from its exposure to growth-oriented investments, like shares and property, while the ‘air bags’ come from defensive assets, like bonds, cash and, sometimes, so-called ‘alternative investments’.

Obviously, a portfolio that’s split equally between growth and defensive assets is going to be far less volatile, but over the long-run will be expected to have lower returns, than one that’s 90 per cent growth and 10 per cent defensive.

Even defensive assets have their risks

Cash is pretty much the best air bag available for a portfolio: it has zero volatility; perfect liquidity, meaning you can access it whenever you like and in whatever amount you want; bank accounts up to $250,000 are government guaranteed, and it also has what you might call ‘option value’, in that it enables you to take advantage of opportunities if they arise.

The price you pay for that security is a low return, in fact, money held in an ordinary bank account is usually going backwards after accounting for inflation. Even the average return on a three-month term deposit after accounting for inflation has been only 0.4 per cent per annum over the past 5 years, and less if you’re paying tax on it.

Bonds are the next best defensive asset, but you need to be careful about what type of bonds they are: government or corporate.

Corporate bonds are issued by a company as a way to fund itself instead of going to a bank. Obviously there are big, safe companies that are far less likely to default on their debt obligations and they get a higher credit rating, like A-grade, and there are those that are not so safe and reliable that can get rated as ‘junk bonds’ or ‘high yield’, which is anything below a BBB rating.

It makes sense that the market’s view on a corporate bond will change in line with how that company’s performing. If a company’s struggling investors will demand a higher yield to compensate for the rising risk of default, which means the price of the bond goes down, so it’s entirely conceivable you can lose money on that company’s bond.

The problem is that same struggling company’s shares will probably also be going down at the same time. That means corporate bonds are often ‘positively correlated’ to equities, meaning they go up and down at the same time, which is the opposite of what you want from a defensive asset. Not surprisingly, corporate bonds are normally categorized as a growth, or semi-growth asset – no airbag there.

Government bonds will also have a credit rating, so if you buy the bonds of a steady, developed nation like Australia or the US, the chances of them defaulting are almost nil. Again though, the price you pay for lower risk is a lower return. But think of it like this: if you were told airbag A reduces the risk of injury by 50% and costs $500, whereas airbag B reduces the risk by 90% and costs $1,000, what would you do?

There are a few tricky parts to government bonds: first, to get exposure you’re going to have to use a fund of some sort, either an ETF which just follows an index, or a managed fund that tries to earn a bit extra; second, ‘real’ returns after inflation can be surprisingly low again – over the past five years Australian 10 year bonds have averaged a smidge over 1% – but remember their job is to be defensive; finally, and importantly, over time the correlation of bonds and shares can change.

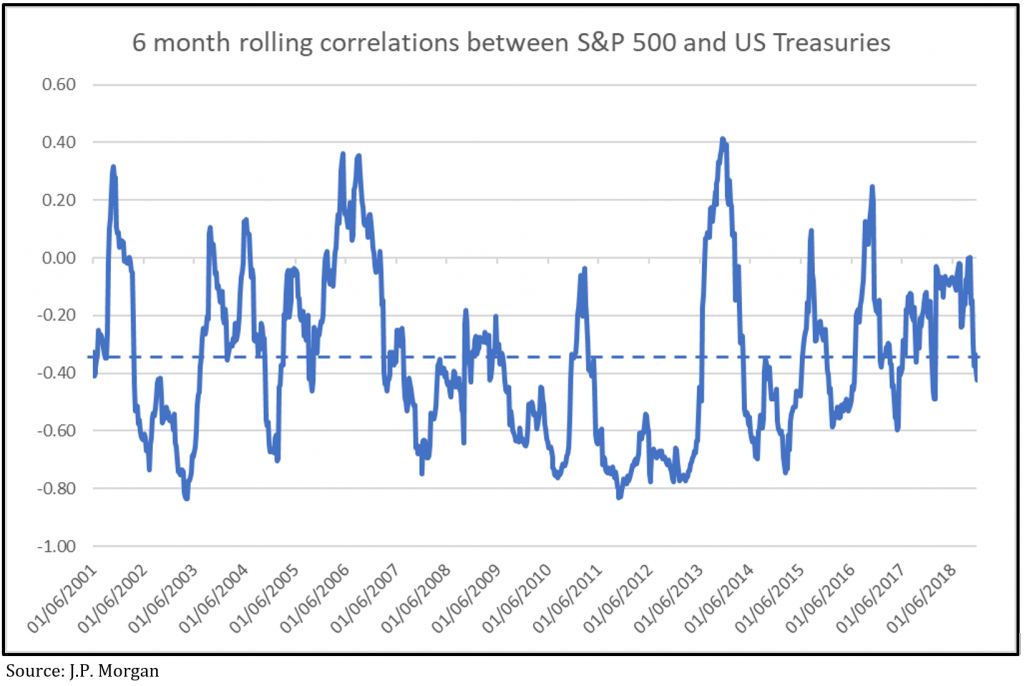
Typically investors presume government bonds are going to zig when equities zag, meaning they are ‘negatively correlated’. A great example was in 2008 when Australian shares fell 38%, while Australian bonds rose 15% and international bonds went up by 9%. But the chart below shows that since 2001, while the average of the rolling six-month correlation between US shares and bonds was -0.35, it never stood still and covered a broad range, from -0.8 to 0.4. In other words, while government bonds tend to perform well during a share market correction, there’s no guarantee.
Does your portfolio have an airbag_chart

How did bonds go over the course of the recent correction?  US shares fell 20 per cent from their peak on 20 September to the December low, while the iShares Core US Aggregate Bond ETF rose 0.5 per cent over the same time.

Here in Australia the Accumulation Index (which includes dividends) fell 13 per cent from its August peak to the late December low, while the iShares Core Composite Bond ETF, which is about 90% government bonds, went up by 1.0 per cent.

As usual in investing, there is no perfect solution to finding an airbag for your portfolio, but the right exposure to the tried and true defensive assets of cash and government bonds should at least help stop you losing sleep worrying about the next crash.

Death Duties and Super?

Death Duties and Super?

A recent article from Noel Whittaker titled ‘This is Australia’s version of a death tax’ prompted a few questions from some of our elderly clients.

It’s not really a ‘death tax’ as such, but it reminds people about how your superfund may actually pay tax upon your death.

We wrote a more comprehensive article on this very subject earlier in the year titled “What happens to my super when I die?” which you can access here.

To keep it simple, your super doesn’t incur tax on death if it’s passed onto a ‘dependent’, which is defined in this instance as a

  • spouse
  • child under the age of 18
  • any person over 18 years and financially dependent or in an interdependent relationship.

If the beneficiary doesn’t qualify as a ‘dependent’, a tax of up to 15% (plus the Medicare Levy) may apply to the ‘taxable’ component of your super balance. Your super generally consists of both a ‘taxable’ and a ‘tax free’ component, even if you’re in the pension phase.

There are strategies you can consider to reduce the ‘taxable’ component but given everyone’s situation is just that little bit different, it’s important you speak with your adviser, or alternatively call us, and we can work out the most appropriate and tax effective course of action.

Interesting enough, if you are over 65 years of age (or over 60 years and permanently retired from the workforce), you can simply make lump sum withdrawals from your super fund tax free. So, if you know your death is imminent, withdrawing your balance from super can be a way to avoid ‘Australia’s version of a death tax’. But be certain, because if it’s a false alarm, it may be that you can’t get your money back into the super environment, and you’re likely to be paying tax all over again.

As I previously mentioned, if you would like greater detail on superannuation death benefits, simply click here.

Four ways to protect your portfolio from another GFC

Four ways to protect your portfolio from another GFC

Ten years ago the world’s financial heartbeat almost came to a stop and the far reaching consequences were felt within every sector and across every economy. Businesses closed down, workers lost their jobs, economic growth stopped dead and many investors watched the value of their life savings plunge. Ten years on those same investors could have made multiples of their money, but the reality for many is the scars of that dreadful experience have left them so suspicious and distrusting that they struggled to reinvest. Looking back, and forwards, what can investors do to protect themselves from another GFC?

1. Your risk profile matters

A critical step in constructing your portfolio is to be mindful of how much risk you’re prepared to take with your money. Financial markets go up and down, it’s a fact of life. We all feel great watching our investments go up but you have to think long and hard about how it’ll make you feel to watch your portfolio drop in value.

Unfortunately the only true test of your attitude to risk is when your portfolio loses a big chunk of its value in a relatively short space of time, like what happened during the GFC. Way too many investors discovered they weren’t able to cope with the stress of watching their wealth disappear, with that horrible knotted feeling in the pit of the stomach leaving them unable to sleep at night.

There are three aspects to risk you need to think about:

  1. Risk requirement: how much risk do you need to take to meet your lifestyle goals?
  2. Risk tolerance: how much up and down (volatility) in the value of your portfolio can you really handle?
  3. Risk capacity: what’s your ability to absorb the risk and bounce back without jeopardizing your future?

These considerations form one of the most important parts of constructing your portfolio: there will inevitably be a point where markets get hit by volatility and the road of miserable financial experiences is paved with people who couldn’t handle the stress of unrealised losses and sell out only to find if they’d held on they would have made their money back plus a whole lot more.

2. Valuations matter

In the years leading up to the GFC some asset classes boasted returns far above their historical average, but higher than long-run average returns usually means lower returns are on their way. For example, between 1983-2001 US house prices rose an average of about 4.5% compounded per annum, but between 2001-2007 the rate of increase was almost double that. Then house prices fell 30% over the next five years.

Likewise, the Australian share market rose at about 8% per annum compounded over the ten years 1995-2004, then jumped to 14% per annum over the period from the end of 2004 to October 2007. Then it dropped 50% in 18 months. Periods of strong returns tend to run headlong into the rule of mean reversion, meaning they’re followed by a period of weak returns. In other words, when markets get expensive they tend to correct. (For some really eye-popping perspective, the Australian listed property trusts index had increased at a compounded rate of 4% per annum between 1995-2003, then hit 33% per annum in the four years to February 2007! It then fell 80% over the following two years.)

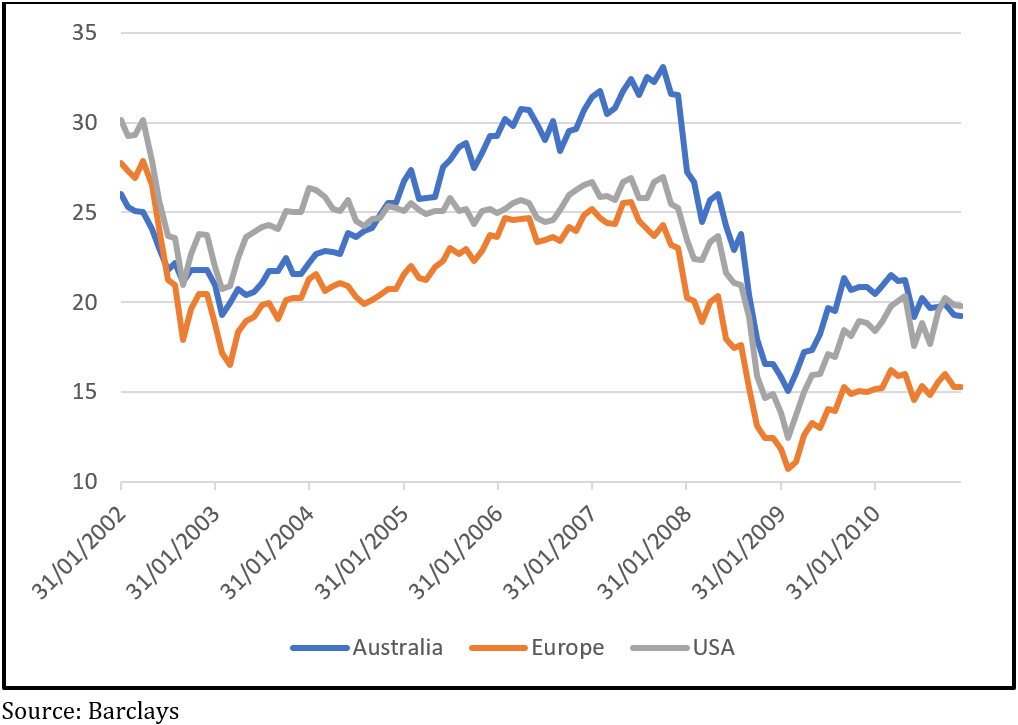
Another way of looking at how pricey the Australian stock market got is the “CAPE ratio”, which is the ‘cyclically adjusted price to earnings ratio’. It’s a way of looking at long-term stock market valuations by using 10 years of inflation-adjusted earnings. Chart 1 shows the Australian market’s valuation was way above its US and European counterparts leading into the GFC. In fact, at 33, the ASX200’s CAPE ratio in 2007 was the highest it’s been in the period from 1982-2018 (the second highest was before the 1987 crash when it hit 29) and compares to the average of 20.

Chart 1: the Australian stock market was expensive going in to the GFC

So investors who were solely exposed to Australian shares were bearing a great deal more risk than they probably expected, or by and large appreciated. The lesson for investors here is that trees don’t grow to the sky: any asset class can get expensive, you need to somehow be able to get a perspective on that.

3. Asset allocation is critical

Asset allocation is simply how much of your portfolio you put into different types of asset classes, like Australian versus international shares, or bonds, or property, or cash. Vanguard analysed 580 Australian retail superannuation funds over 25 years and found that asset allocation accounted for 89% of their returns, while market timing and investment selection was only 11%!

Not only does asset allocation go hand in hand with your risk profile but it’s also a key part of avoiding being overexposed to overpriced markets. With respect to your risk profile, the less you’re able to cope with volatility in your portfolio the more you need to be allocated to defensive assets, like bonds and cash. There were a lot of ‘balanced’ investors who went in to the GFC holding nothing but Australian shares, because some stockbroking houses basically promoted a balanced portfolio as one that just needed to hold both banks and resources.

To be clear, shares are a growth asset, not a defensive one, and so is property. They can both be highly volatile. Bonds often (but not always) go in the opposite direction to shares in a crisis because of the old flight to safety idea; so in 2008 when shares all over the world were doing a swan dive Australian bonds returned 4% and international bonds 9%.

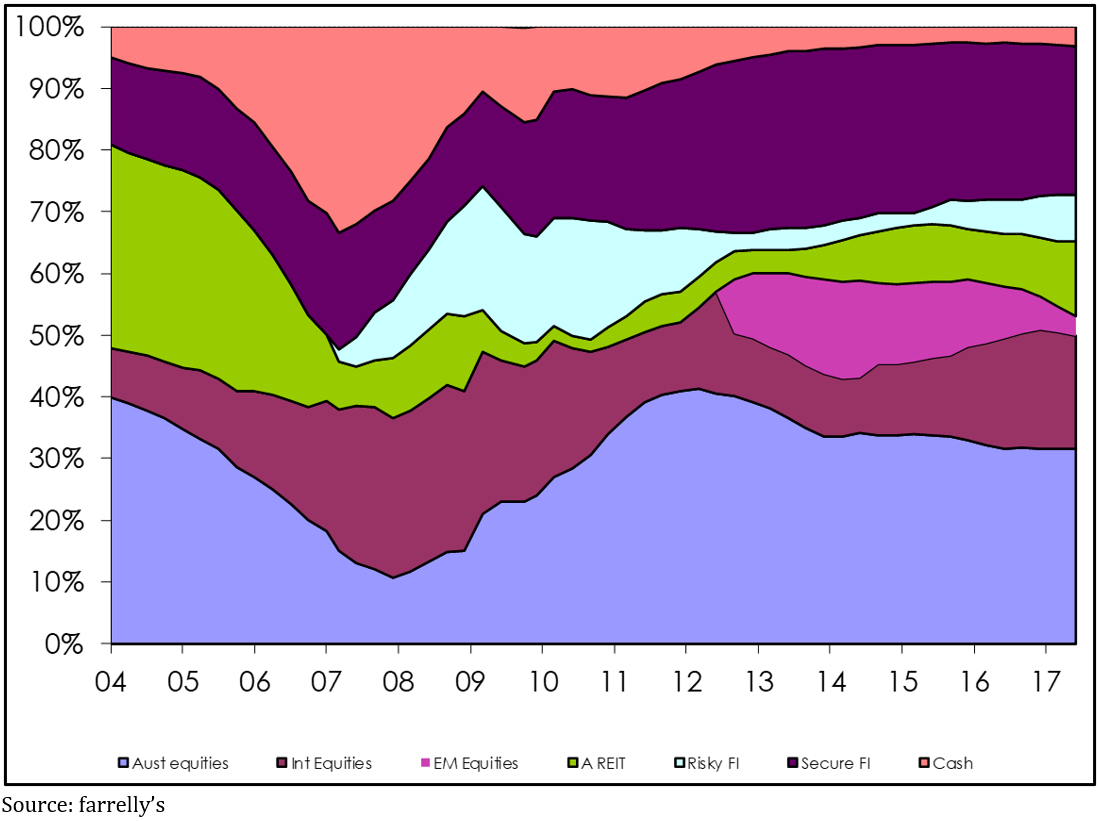
If you’re looking after your own portfolio and don’t know about asset allocation, then learn. We follow what’s called a ‘dynamic’ approach, and we use a consultant to help us decide which asset classes offer the best relative value and, more importantly, which asset classes are expensive. We then allocate more money to those areas that are relatively cheap. Chart 2 shows how allocations change over time. Critically, you can see how the allocation to Australian shares dropped from 40% in 2004 to about 10% in 2008, while fixed income went up from 15% in 2004 to 20% in 2007and cash went from 5% to 35%, so 50% of the portfolio was in defensive assets by the time the GFC really hit.


Chart 2: dynamic asset allocation changes weightings to different

These days most Australian portfolios have at least some diversification into international shares, but given the US has by some measures just hit its longest ever bull market run and its CAPE ratio is now 31, it warrants examining what weighting you have to it.

4. Be wary of the noise

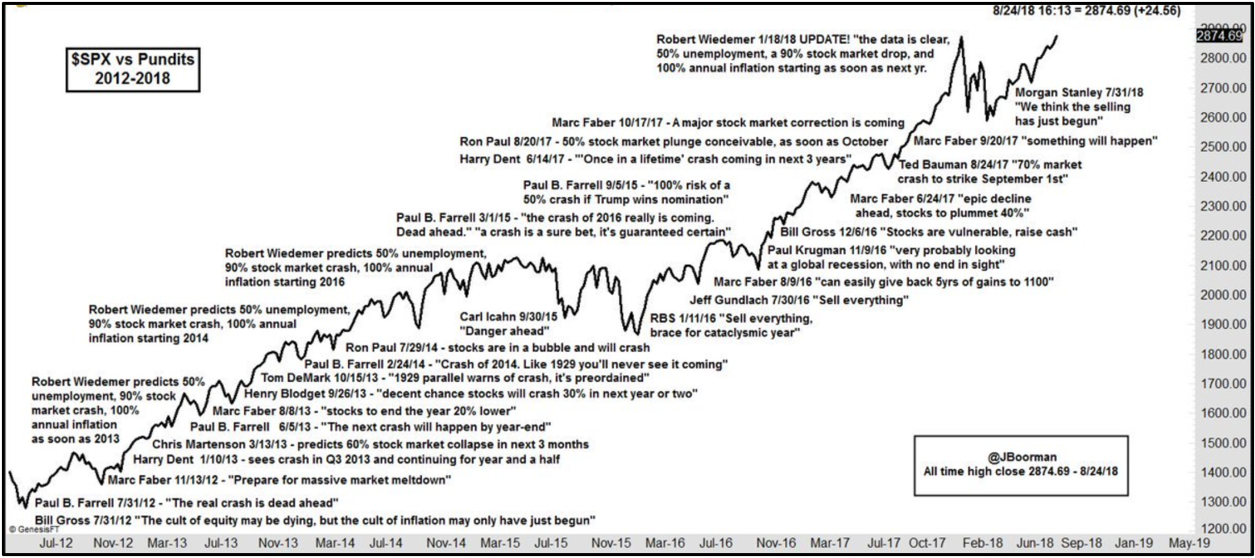
This is more a post-GFC lesson. Since share markets bottomed in 2009 the US has risen more than three-fold, Japan’s more than doubled, the UK’s up 90%, and Australia’s up 85%. Unfortunately though, many investors have missed out, partly because it’s human nature after a life changing scare to worry there could be another one coming any moment and partly because they paid too much attention to ‘experts’ who reinforced those fears through constant warnings of the next imminent crash. Chart 3 highlights some of the atrocious calls these ‘experts’ have made since 2009, there are literally dozens more that could be added to the list.


Chart 3: bad calls by ‘experts’

The post-GFC share market bull run has been called the most unloved bull run ever because of the amount of cash that’s sat on the sidelines and never got invested.

It pays to remember the media knows scary headlines attract more attention than benign ones. Basing your investment strategy on headlines can be a costly strategy.

Should you be worried about central banks unwinding QE?

Should you be worried about central banks unwinding QE?

A couple of weeks ago I attended a lunch where five out of the eight fund managers that presented basically tried to scare people into investing with them by talking about the ‘huge uncertainties created by central banks unwinding quantitative easing’, commonly referred to as QE. This is a common theme, particularly among fund managers trying to convince you the safest thing to do is leave your money with them. As always, it pays to be skeptical.

Tim Farrelly is an asset allocation consultant and one of the clearest thinkers about market issues that I know. He recently wrote the notes below about whether we really do need to worry about the reversal of QE, normally referred to as quantitative tightening (or QT). They appeared on his LinkedIn group, Just Saying and should be enough to have alarmists crawl back from the ledge.

How will we cope with the liquidity squeeze when Quantitative Easing becomes Quantitative Tightening?

This has been a worry for many in the markets – will there be a liquidity squeeze when Central Banks reverse tack and QE becomes QT?

To get a sense of how QT may play out, we need to think about how QE worked. Did you ever wonder what happened to all the cash that the Fed poured into the economy during QE? Where did it all go?

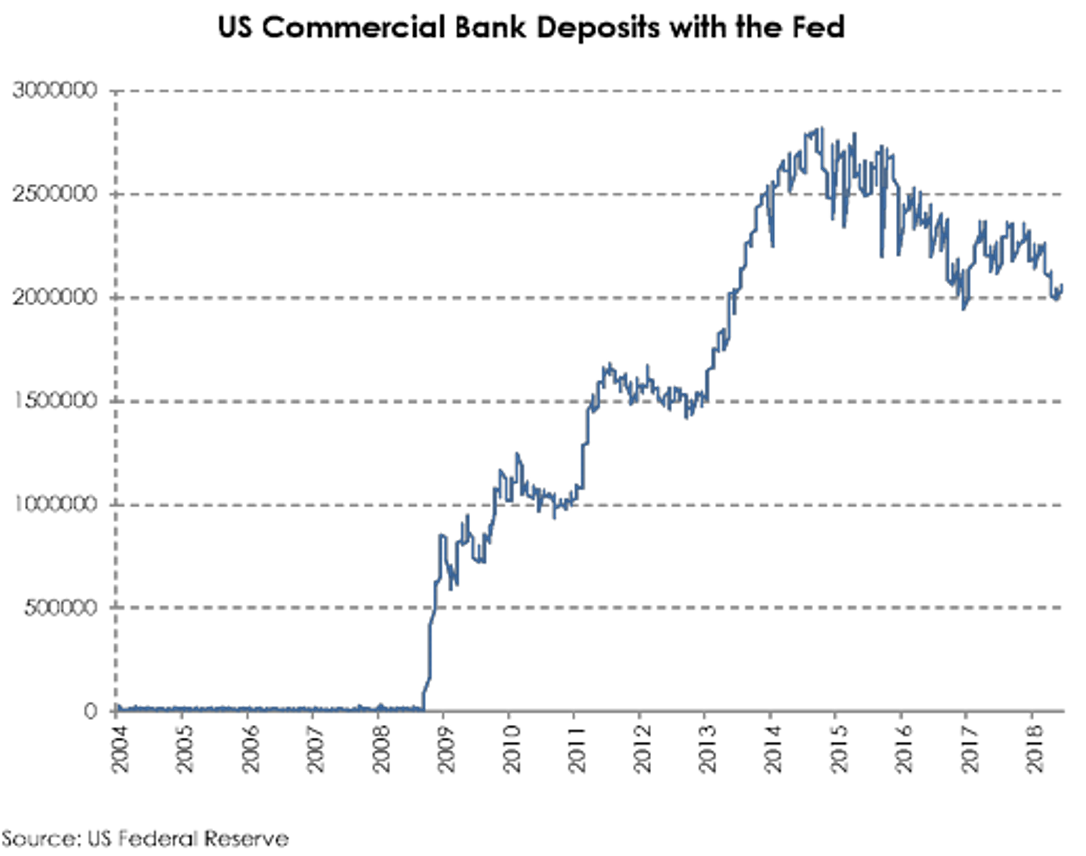
The charts here show both sides of the Fed’s balance sheet and give part of the answer. The new cash mostly ended up back with the Fed in the form of excess deposits from US Commercial Banks. Bond investors swapped their bonds for cash, they invested that cash with the Commercial banks, who then, rather than lend it out, put in on deposit with the Fed. We can see that excess reserves, that green section on the right chart, almost exactly matches the green section on the left chart – which is the amount of bonds bought in the QE process.

Now, excess deposits are just that; deposits that the banks do not want to lend out and do not need for reserves. So, as QE ends, the question the world is asking is what happens when that excess liquidity is removed from the system?

There are two ways of thinking about this excess liquidity. The popular one is thinking of QE as like a deluge which floods the landscape with more water than it needs and QT as a drought that follows after the flood waters recede – equally damaging, but in a different way.

What the chart indicates is that a better analogy is that QE was indeed like a deluge, but rather than one that flooded the landscape, it was one that filled all the dams with decades worth of water – excess reserves. Under this analogy, QT is the gentle emptying of those dams – nothing to worry about as there is more than enough liquidity to go around for years. Even a drought doesn’t worry us.

If the second analogy holds – and I believe it will – then the effects of QT on liquidity are nothing to worry about.

Should you be worried about central banks unwinding QE_chart 1

When Quantitative Tightening starts, who will buy all of the bonds?

In a previous post we showed that the cash created during QE mostly ended up as deposits with the US commercial banks which, in turn, ended up as excess deposits with the Fed. The chart here shows how the deposits of the US commercial banks with the Fed ballooned as QE kicked in and have gently subsided since. They are still a long way above their traditional levels of close to zero. 

While this chart helps answer the question of where all the QE cash went, it fails to answer another, equally important question; who owns all that cash on deposit with the commercial banks and why? This is critically important because when QT kicks in, the amount of cash in the system will reduce, which means that those excess deposits with commercial banks will slowly disappear. This, in turn, means all those entities with cash in the system right now, will need to find another home for their cash.

Let’s assume that those entities – whoever they are – quite like owning assets with cash like qualities. This seems reasonable as no entity is compelled to own vast quantities of cash against its will. If that is true, then they will seek out the closest asset to US cash that they can find. Short-dated US Treasuries or cash management funds that invest in US Treasuries seem to fit the bill. 

So maybe, QT becomes another massive asset swap – cash for short-term securities issued by a gleeful US Treasury. Now, this assumes that the US Treasury is happy to issue lots of short-term securities to fund its growing deficits. If it insists on issuing long-dated securities to a market that wants to buy short dated securities, we might see some interesting twists in the yield curve. 

Nonetheless, we know where much of the money will come from to finance QT – it’s the excess cash already in the system. Again, QT appears much more benign than the alarmists would have us believe.

Should you be worried about central banks unwinding QE_chart 2

Just how dumb are the bond markets?

As QE turns to QT, Central Banks are going to be effectively selling bonds instead of buying them. On top of this, we have the US Tax cuts dramatically increasing the size of the US budget deficit meaning that the US Treasury will also be selling a lot more bonds to finance that deficit. All that selling must push prices lower and bond yields higher.

The big question is: when that will occur? Most pundits suggest that the WHEN is in the future. Effectively, this narrative says that financial markets are really, really dumb. None of this information is a secret, so, unless all bond traders are monumentally stupid, the move should largely have already occurred.

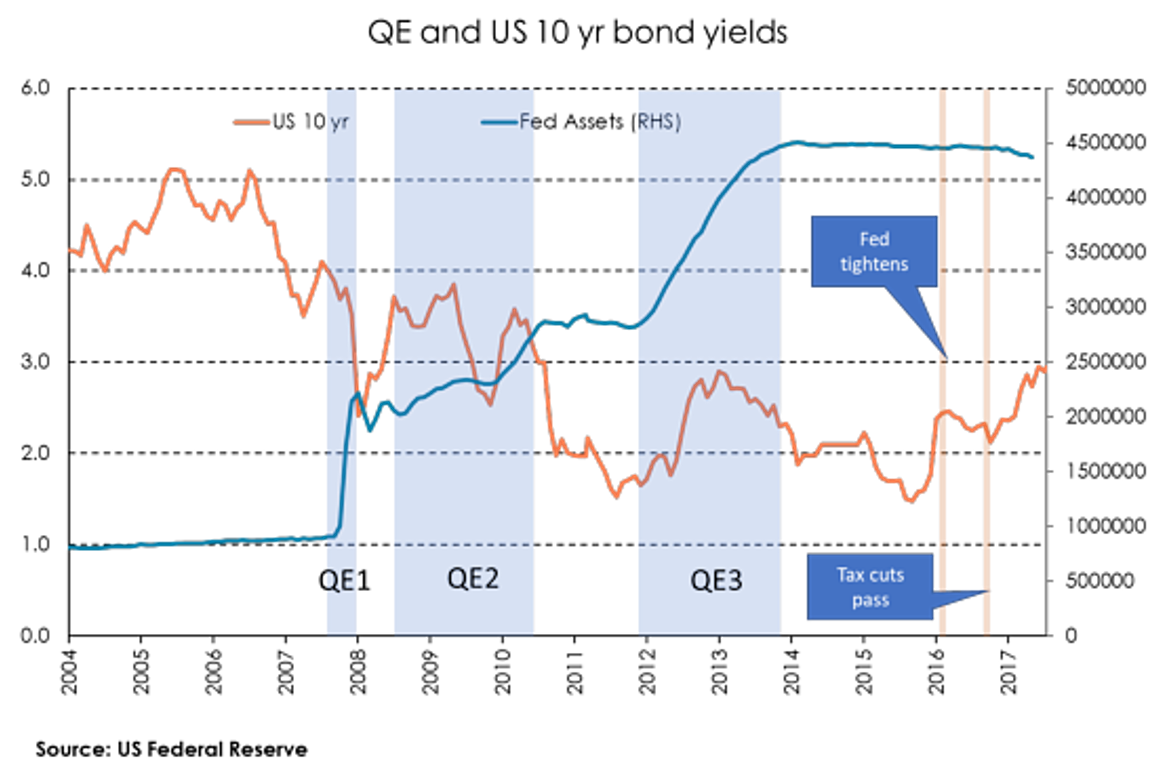
Let’s look at some facts – as shown on the chart of US bond rates and the size of the Fed’s balance sheet. If the “markets are really dumb’ crew are correct, then periods when QE was on (the blue panels) should have coincided with falling bond yields and vice versa. What we see is quite different. During QE1 – in the middle of the GFC – bond yields did fall. However, as those with good memories will recall, there was rather a lot going on in the world at that time. During QE2, yields largely went sideways. Between QE2 and QE3 bond rates fell when the dumb market theorists felt they should have risen. And, during QE3, bond rates rose rather than fell. When QE3 ended, bond rates fell for some time rather than rose as the dumb market guys would have expected.

In recent times, US bond yields have had two major jumps – in October 2015 when the Fed announced that they would start increasing cash rates and again in October 2017 when the US Tax cuts and associated deficits became a reality.

In other words, all the evidence suggests that the dumb market theory is, well, really dumb.

If US Bond rates go higher from here it is likely to be in response to something we don’t yet know, rather than what is already out there. Markets are not perfectly efficient – but they are not nearly as dumb as many would suggest.

Should you be worried about central banks unwinding QE_chart 3
Super contributions – some basics

Super contributions – some basics

We’re fast approaching the end of the 2018 financial year and by now you should have done all your tax planning. If you haven’t there’s time for some last minute stuff, and one of the priorities should be thinking about your superannuation contributions. Just remember though, there were changes introduced last year that you need to bear in mind.

Superannuation is still hands down the most tax effective way to save and invest, so if you’re serious about saving for a comfortable retirement you’d be well advised to maximise your super contributions. But you need to remember that new rules were introduced last year that limit the amount of money you can get into super.

Also, a warning, this article deals with the real basics. The rules and regulations surrounding superannuation are vast and complex. If you have any doubt talk to your accountant or financial adviser.

Do you qualify? To be able to make any super contributions you have to be less than 65 years old, or if you’re between 65-75, you need to meet what’s called the ‘work test’, which means you have to have worked at least 40 hours over 30 consecutive days during the tax year.

Concessional contributions: these are contributions that either you or your employer make to your super fund that you can claim a tax deduction for. As of last year the maximum non-concessional contribution you can make every year is $25,000, and that’s the total contribution, so what your employer puts in plus what you put in.

By way of example, if you’re earning $150,000 per year and you’re receiving the standard 9.5% super guarantee, that’s $14,250. That means you can contribute an extra $10,750 and claim a tax deduction for it, but to do that you have to provide a notice to the trustee of the super fund and the trustee has to acknowledge receipt of the notice. If you’ve made the concessional contribution in F2018, that notice can be given when you lodge your F2018 tax return.

If you’re earning less than $250,000 per year you’ll pay a 15% tax on the concessional contribution, but you claim the difference between that and your marginal tax rate. If you’re earning more than $250,000 you’re up for 30% contributions tax.

Importantly, even if your super fund’s member balance is above the $1.6 million cap that was introduced last year, you can still make concessional contributions into it.

Non-concessional contributions (NCC): are those that are made with your own money that you’ve already paid tax on and they don’t qualify for a tax deduction. With last year’s new rules the maximum you can contribute is $100,000, which means they enable you to get a good chunk of money into super in one hit.

There’s also a thing called the ‘bring forward’ rule, which lets you pay three years’ worth of NCCs in one hit, provided you are under 65 years of age, though it means you can’t make any more contributions for three years. If you’re between 65-75 you can only make one year’s worth of NCCs, so $100,000, as long as you meet the work test.

If you’re under 65 and you’ve got a big stack of money, more than $400,000, available, and you’re happy to lock it up in super, a common strategy is to make a $100,000 NCC just before the end of the financial year and then a $300,000 NCC (bringing forward three years of contributions) a couple of weeks later – that way you’ve just increased your super by $400,000.

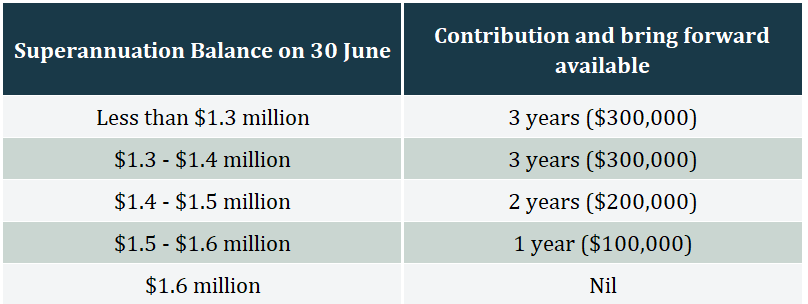
As usual though, there’s a bunch of rules you need to be careful of on top of the age requirements. For a start, last year there was a $1.6 million cap introduced on the amount of super you can use for a tax-free pension. If your super fund’s balance is above that limit as at 30 June the previous financial year then you can’t make any more NCCs at all, and if you’re below it then it works as follows:

Super contributions – some basics table

 Putting money into super is probably the most basic tax and retirement planning there is, unfortunately for something so basic it can be pretty complex because of all the rules surrounding it. The government wants to limit how much you can get in to super, which has got to be the best indication that it’s something you should take seriously.