A couple of weeks ago I attended a lunch where five out of the eight fund managers that presented basically tried to scare people into investing with them by talking about the ‘huge uncertainties created by central banks unwinding quantitative easing’, commonly referred to as QE. This is a common theme, particularly among fund managers trying to convince you the safest thing to do is leave your money with them. As always, it pays to be skeptical.
Tim Farrelly is an asset allocation consultant and one of the clearest thinkers about market issues that I know. He recently wrote the notes below about whether we really do need to worry about the reversal of QE, normally referred to as quantitative tightening (or QT). They appeared on his LinkedIn group, Just Saying and should be enough to have alarmists crawl back from the ledge.
How will we cope with the liquidity squeeze when Quantitative Easing becomes Quantitative Tightening?
This has been a worry for many in the markets – will there be a liquidity squeeze when Central Banks reverse tack and QE becomes QT?
To get a sense of how QT may play out, we need to think about how QE worked. Did you ever wonder what happened to all the cash that the Fed poured into the economy during QE? Where did it all go?
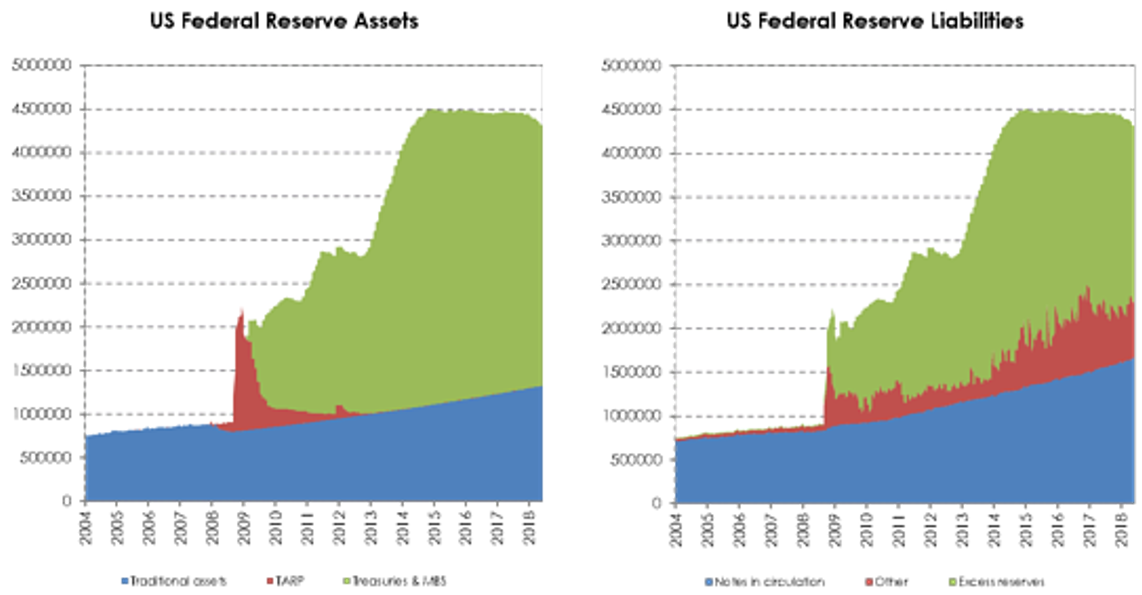
The charts here show both sides of the Fed’s balance sheet and give part of the answer. The new cash mostly ended up back with the Fed in the form of excess deposits from US Commercial Banks. Bond investors swapped their bonds for cash, they invested that cash with the Commercial banks, who then, rather than lend it out, put in on deposit with the Fed. We can see that excess reserves, that green section on the right chart, almost exactly matches the green section on the left chart – which is the amount of bonds bought in the QE process.
Now, excess deposits are just that; deposits that the banks do not want to lend out and do not need for reserves. So, as QE ends, the question the world is asking is what happens when that excess liquidity is removed from the system?
There are two ways of thinking about this excess liquidity. The popular one is thinking of QE as like a deluge which floods the landscape with more water than it needs and QT as a drought that follows after the flood waters recede – equally damaging, but in a different way.
What the chart indicates is that a better analogy is that QE was indeed like a deluge, but rather than one that flooded the landscape, it was one that filled all the dams with decades worth of water – excess reserves. Under this analogy, QT is the gentle emptying of those dams – nothing to worry about as there is more than enough liquidity to go around for years. Even a drought doesn’t worry us.
If the second analogy holds – and I believe it will – then the effects of QT on liquidity are nothing to worry about.

When Quantitative Tightening starts, who will buy all of the bonds?
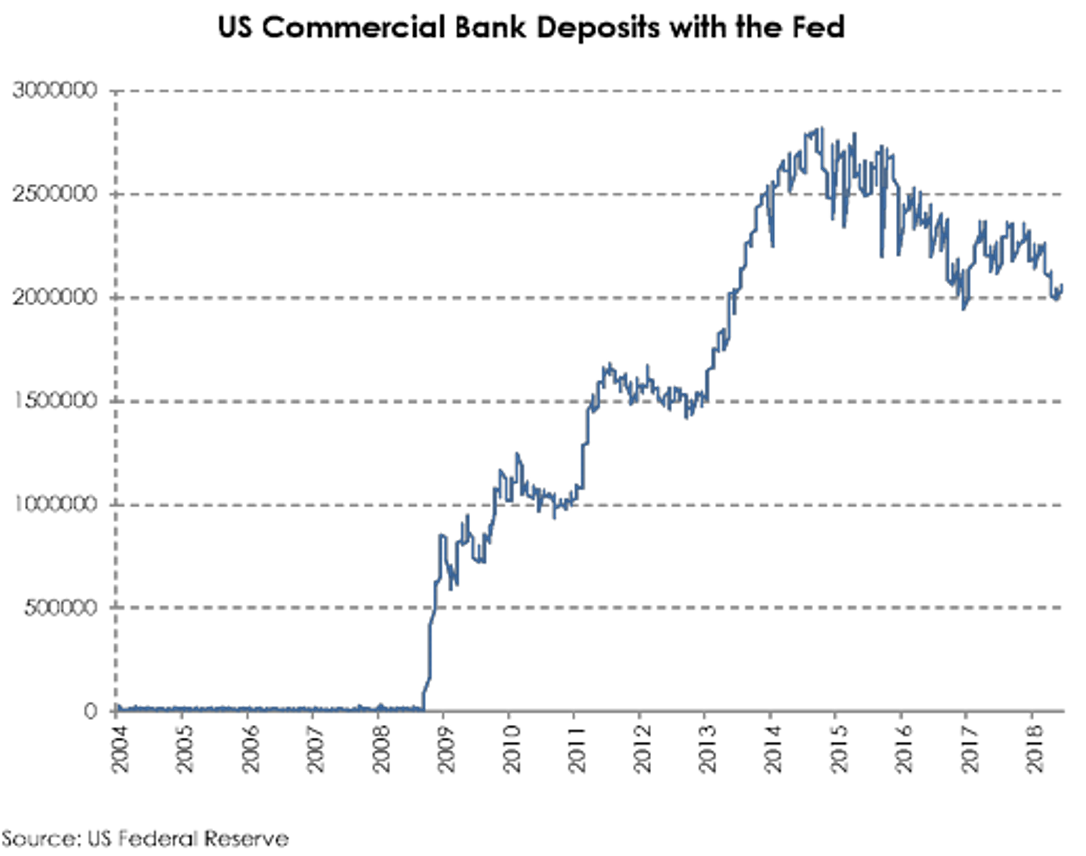
In a previous post we showed that the cash created during QE mostly ended up as deposits with the US commercial banks which, in turn, ended up as excess deposits with the Fed. The chart here shows how the deposits of the US commercial banks with the Fed ballooned as QE kicked in and have gently subsided since. They are still a long way above their traditional levels of close to zero.
While this chart helps answer the question of where all the QE cash went, it fails to answer another, equally important question; who owns all that cash on deposit with the commercial banks and why? This is critically important because when QT kicks in, the amount of cash in the system will reduce, which means that those excess deposits with commercial banks will slowly disappear. This, in turn, means all those entities with cash in the system right now, will need to find another home for their cash.
Let’s assume that those entities – whoever they are – quite like owning assets with cash like qualities. This seems reasonable as no entity is compelled to own vast quantities of cash against its will. If that is true, then they will seek out the closest asset to US cash that they can find. Short-dated US Treasuries or cash management funds that invest in US Treasuries seem to fit the bill.
So maybe, QT becomes another massive asset swap – cash for short-term securities issued by a gleeful US Treasury. Now, this assumes that the US Treasury is happy to issue lots of short-term securities to fund its growing deficits. If it insists on issuing long-dated securities to a market that wants to buy short dated securities, we might see some interesting twists in the yield curve.
Nonetheless, we know where much of the money will come from to finance QT – it’s the excess cash already in the system. Again, QT appears much more benign than the alarmists would have us believe.

Just how dumb are the bond markets?
As QE turns to QT, Central Banks are going to be effectively selling bonds instead of buying them. On top of this, we have the US Tax cuts dramatically increasing the size of the US budget deficit meaning that the US Treasury will also be selling a lot more bonds to finance that deficit. All that selling must push prices lower and bond yields higher.
The big question is: when that will occur? Most pundits suggest that the WHEN is in the future. Effectively, this narrative says that financial markets are really, really dumb. None of this information is a secret, so, unless all bond traders are monumentally stupid, the move should largely have already occurred.
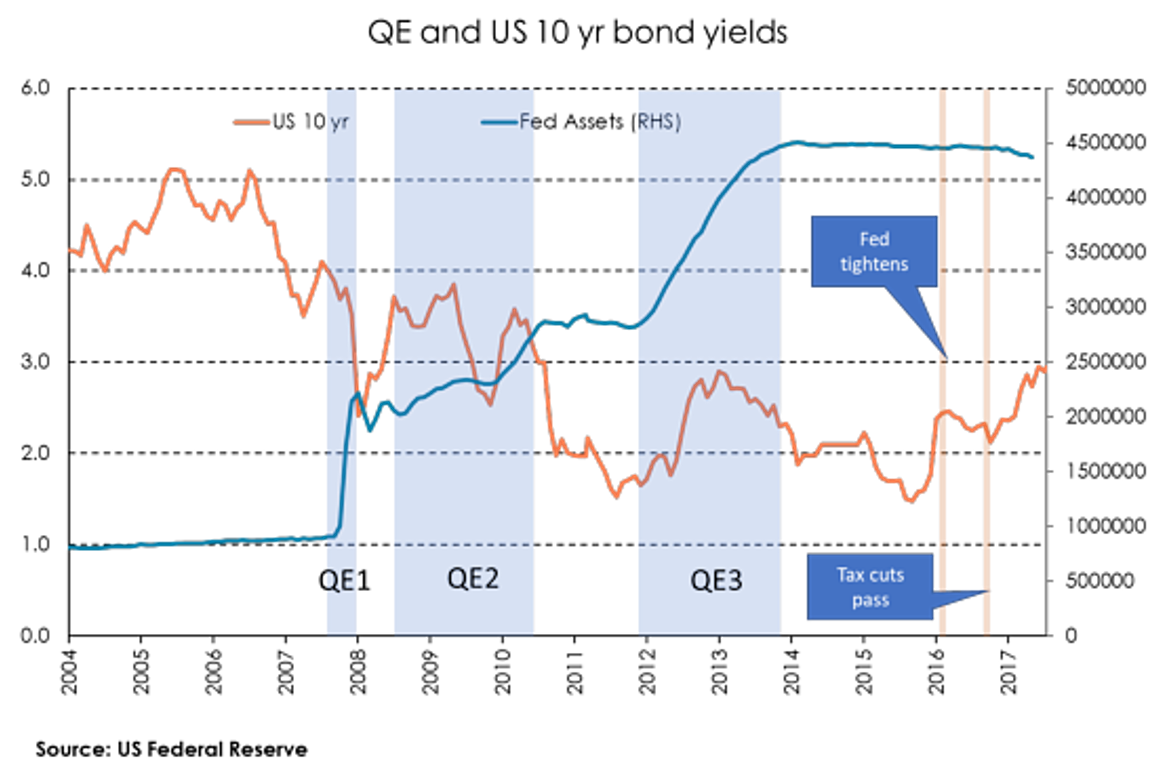
Let’s look at some facts – as shown on the chart of US bond rates and the size of the Fed’s balance sheet. If the “markets are really dumb’ crew are correct, then periods when QE was on (the blue panels) should have coincided with falling bond yields and vice versa. What we see is quite different. During QE1 – in the middle of the GFC – bond yields did fall. However, as those with good memories will recall, there was rather a lot going on in the world at that time. During QE2, yields largely went sideways. Between QE2 and QE3 bond rates fell when the dumb market theorists felt they should have risen. And, during QE3, bond rates rose rather than fell. When QE3 ended, bond rates fell for some time rather than rose as the dumb market guys would have expected.
In recent times, US bond yields have had two major jumps – in October 2015 when the Fed announced that they would start increasing cash rates and again in October 2017 when the US Tax cuts and associated deficits became a reality.
In other words, all the evidence suggests that the dumb market theory is, well, really dumb.
If US Bond rates go higher from here it is likely to be in response to something we don’t yet know, rather than what is already out there. Markets are not perfectly efficient – but they are not nearly as dumb as many would suggest.


