A rocky start doesn’t necessarily mean a bad finish

A rocky start doesn’t necessarily mean a bad finish

Equities markets all over the world have had a horrible start to the year, with the Australian market down 7%, the U.S. market by 8%, Europe 6%, the U.K. 5% and China a whopping 18%. It’s natural for investors to get concerned by that, but there are a few points to remember.

First is that what happens at the start of a year in equities markets does not necessarily bear any resemblance to what will unfold over the entire year. For example, last year saw the ASX200 rise 12% in the six weeks between mid-January and the end of February, yet we ended the year down 2%.

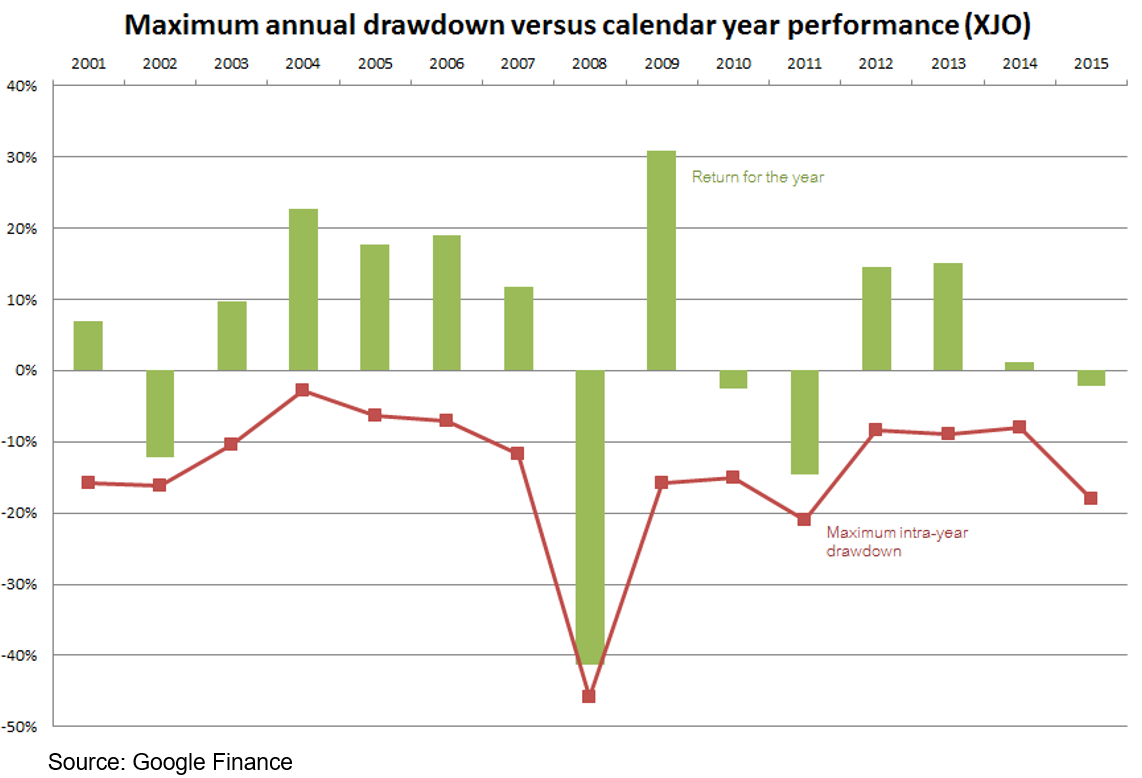
Second, intra-year volatility is part and parcel of share markets. The chart below shows the biggest intra-year declines (also referred to as ‘drawdowns’ or ‘corrections’) for each year going back to 2001, together with the final outcome for each year. Nine out of the fifteen years saw a drawdown of more than 10%, and in fact the average drawdown over the period was 14% (even leaving 2008 out as an outlier the average is still -12%), yet the average return over the whole year was 5%, and 10% including dividends.

A rocky start doesnt necessarily mean a bad finish

It’s a similar story for the United States, where over the 65 years to 2014 the S&P500 saw a 10% correction or worse in more than half the years, yet the annual average return over that period was 11%.

Third, if you’re a long-term investor, or investing to achieve particular goals or outcomes, breaking stock market returns into discrete periods is pretty artificial in any case. You really are better off viewing returns as a continuum that will inevitably have its ups and downs, but which trends upwards over the long run. Selling with the intention of buying back in later, which is effectively trying to time markets, is notoriously difficult.

Fourth, you should always be wary of doomsayers and the media when market volatility spikes up. The media knows bad news sells so they promote those commentators with the grimmest views and who sound the most confident, yet studies have shown those same commentators have the worst track records.

Commodities and capitulation

Commodities and capitulation

There’s nothing like a bit of long-term perspective to put things into context. The chart below is the IMF’s Commodities Index going back 23 years.

IMF Commodities Index

IMF Commodities Index

Source: IMF


The first thing we would point out is that we are not commodities experts, so these comments are from the standpoint of an interested observer. Mind you, the track record of experts’ forecasts in the commodities space beggars belief that they can still be called experts!

A first observation is that before China began to seriously ramp up its industrialization program (China boom Mk I), commodities prices traded in a fairly restricted range. The effects of China’s urbanization program on commodities demand were obviously profound: that’s going to happen when more than 20 million people move from the countryside into cities every year for more than 10 years and they have to be housed, have work places and be able to get to and from them. Just think about that: it’s the equivalent of having to build five Melbournes every year from scratch. One mind blowing estimate is that in the three years to 2013 China used 40% more cement than the US did in the entire 20thcentury, so you can presume the amount of steel and what have you wouldn’t be too different. In fact steel production in China this year was estimated at 823 million tonnes; between them, the US, Japan and Russia never got close to 200 million tonnes.

The second observation is that the period of growth after the GFC (marked above as China boom Mk II) was after the government launched an economic package equivalent to about 6% of GDP aimed almost entirely at investment. That would be the equivalent of Australia launching well over $100 billion worth of construction programs today. That boom in Chinese demand saw a huge increase in commodities production capacity across the world. For example, iron ore supply more than doubled between 2000-2014, an annualised growth rate of more than 6%. The problem is, that rate of increase in demand was never going to last for ever, despite all that talk of the commodities ‘super cycle’, and now overall global economic growth is about half of what that growth is supply has been. In other words, there was a massive structural shift in demand for commodities, supply responded thinking it was a permanent change, but it wasn’t and now we have an oversupply.

And as we’ve written many times before, the composition of China’s economic growth is changing: the government is engineering a deliberate shift toward consumer spending to drive growth rather than fixed asset investment. Moreover, this year marked the first time the number of people moving to the city from the country didn’t grow. All of that means a slowdown in the rate of growth of China’s commodities demand, just at a time when growth in the rest of the world is also very low.

Reversion to mean is one of the immutable laws of financial markets. It is possible that’s what we’re seeing in the commodities space: reversion to a time when commodities prices traded in a fairly restricted range.

Like this article? view more in our News & Learning blog

Who or what has caused this market correction?

Who or what has caused this market correction?

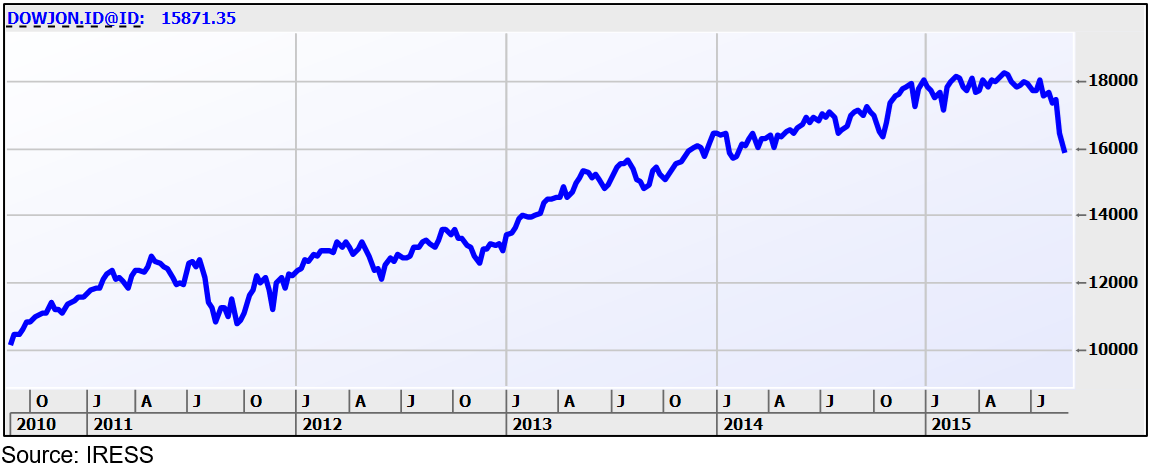
When the U.S.’s Dow Jones index falls more than 1500 points in three trading days you expect to be able to point to some obvious, clear reasons. But there hasn’t been a central bank declare it’s stopping QE, or raising interest rates, there hasn’t been a war start or catastrophic terrorist event. Yet this market correction took a sudden sharp turn (see the chart below) apparently due to reasons that have been around for a while. Let’s look at some of them and see if it makes sense.

The Dow Jones – a sudden sharp turn

Who or what has caused this market correction_chart 1

China

Last week China took markets by surprise and devalued its currency two days in a row by a total of 4.6%. The bears promptly declared it reflected the Chinese government worrying that growth is slower than expected, and since China has been portrayed as the engine of global growth for years that will have negative consequences for the rest of the world. The government’s ham fisted attempts at standing in the way of the market train didn’t win many fans either and left some commentators pointing to that as evidence the government doesn’t exercise the control over the economy they (and perhaps we) thought they do.

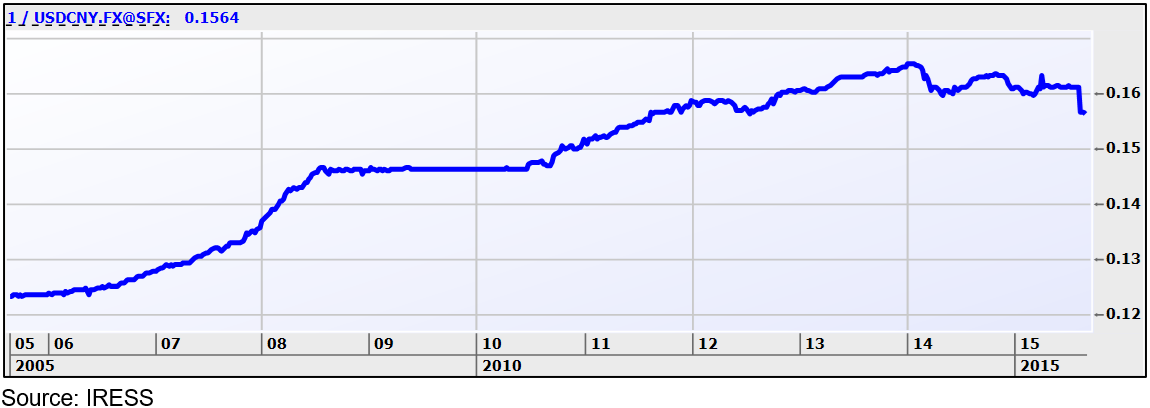
On the other hand, the Chinese have been trying for years to have the Renminbi included in the basket of currencies the IMF uses to calculate Special Drawing Rights (SDR’s), if for no other reason than recognition of its global economic stature. But the IMF has always said China needs to let markets play a greater role in determining its currency. So that’s what China did: allowing the RMB to fall against the U.S.$ was what market forces dictated (there’s a lot of capital locked up in China that would like to find a home elsewhere). Bear in  mind a 4.6% move is nothing compared to the 30% declines in the Euro and the Yen, and is even more inconsequential when you consider the RMB has risen against the U.S.$ by some 20% over the past five years (see the chart below).

How many U.S.$ can be bought by one Chinese Renminbi
Who or what has caused this market correction_chart 2

It seems one of the triggers for last Friday’s selloff was the release of the Caixin PMI (Purchasing Manager’s Index), which fell to a six year low. This is a measure of sentiment in the manufacturing industry, so again is seen as a poor reflection of the manufacturing-dependent Chinese economy.

However, that same index has been falling for six consecutive months, so it’s not new news. Also, something that is often overlooked, manufacturing’s share of the Chinese economy has fallen over the past 10 years from 47% to 43% while the services sector has risen from 41% to 48%. While that doesn’t sound like much, in a U.S.$10tn economy that’s a big deal. We’ve known for years the government wants to transition the Chinese economy away from being reliant on being the world’s factory, and now it’s actually happening.

There has been a bunch of indicators showing the Chinese economy has slowed over the past couple of years. Firstly, that was inevitable and as the economy gets bigger it’s going to be harder to sustain those extraordinary growth rates. Also, again we’ve known that’s been happening for a while, so there’s no clear reason for it to suddenly be a catalyst for a selloff.

A slowing Chinese economy is certainly not great news for the likes of Australia, but it’s not a good reason for the U.S. to be sold off since the external sector accounts for less than 15% of its total economy.

Emerging markets

Who or what has caused this market correction_chart 3

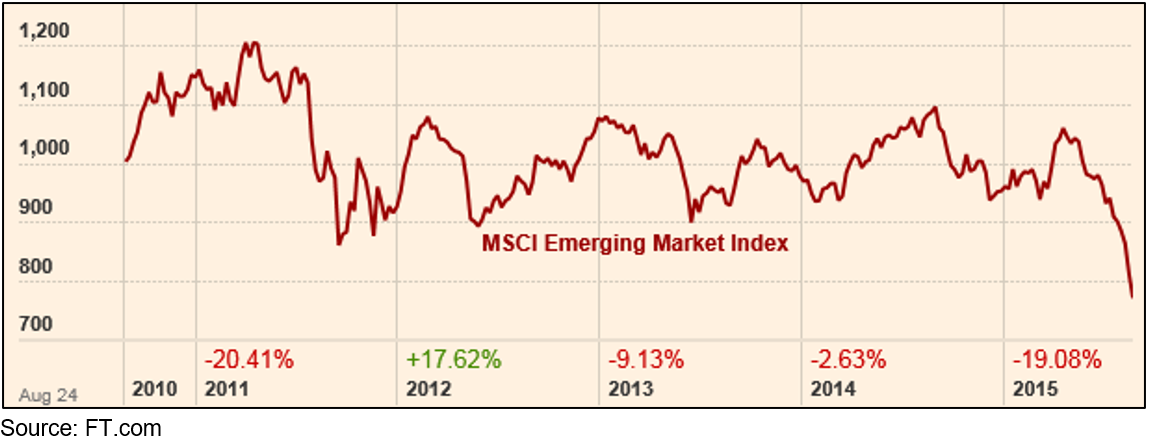
It seems the market weakness started in the emerging markets and spread to the developed. There have been stories recollecting how in 1998 the EM currency crisis spread through the region culminating in the Russian debt default. The reason that happened was because back then most EM debt was denominated in U.S.$. As the downward pressure on their domestic currencies rose and rose it became harder and harder for them to meet their bond repayments.

Nowadays though, most EM debt is denominated in local currencies. Overall, debt levels in the EM countries are lower and growth is higher, so they appear to be in better shape than many of their developed market counterparts. And while there are some political issues that you can rightly point to would be unfavourable for markets, such as Brazil’s government enjoying less than 10% support, or Malaysia’s Prime Minister having to explain how U.S.$700m ended up in his bank account form the nation’s sovereign wealth fund, they are such small markets on a global scale that it’s tough to see how they could be a trigger for global selling.

Undoubtedly, some of the massive liquidity injections from the various DM quantitative easing programs found its way into the EM economies, and there is a risk it will be sucked back out again as U.S. interest rates inevitably go up. To do that obviously requires selling the EM assets, so there will be downward pressure on their values. But we’ve known the U.S. stopped its QE program last October, so it’s unclear why that would suddenly be a strong reason to sell.

Commodities

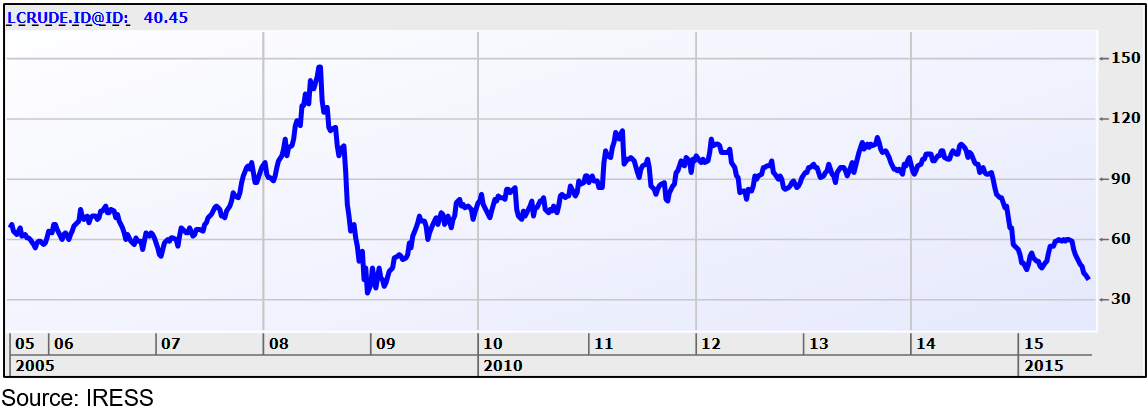
Much has been made that oil is trading at U.S.$40 per barrel. That’s as low as it’s been since the dark days of the GFC (see the chart below), which is bad news for those countries that are reliant on oil revenues and you can understand why their oil-dependent companies would be sold down. But it’s great news for economies that import oil. In fact, it’s estimated that every 10% fall in the oil price adds 1.5% to Eurozone GDP growth, and as a rule most energy savings in those countries tend to turn up in other consumer spending.

Oil price
Who or what has caused this market correction_chart 4

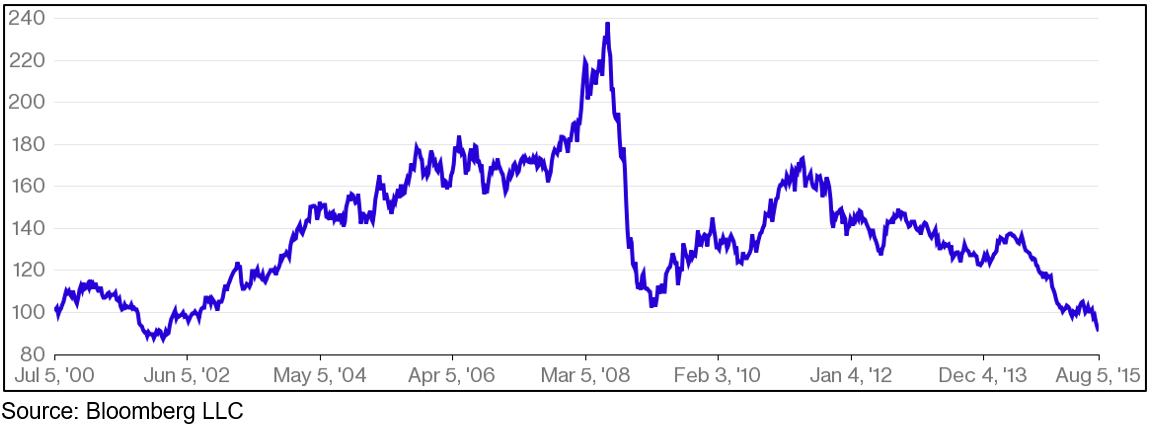
The rest of the commodities complex is also struggling (see the chart below), with overall prices now below where they got to in the GFC.

Bloomberg Commodities Index
Who or what has caused this market correction_chart 5

Again, that’s not great news for those economies that are reliant on commodities for income, like Australia, Brazil, Russia, Canada, etc. But it’s really good news for those countries that have to buy a lot of commodities, like China, South Korea, Japan, etc.

Also, commodities prices have been falling since 2011, why should they suddenly be causing a selloff now? Perhaps the reason lies in what the falling prices reflects: a slowing in demand back to levels that we associate with a time of severe dislocation.

U.S. interest rates

Just last week the U.S. Federal Reserve again confirmed it is inclined to raise interest rates this year. There is consternation this will disrupt capital flows as money floods into the U.S. to take advantage of the higher interest rates. Whilst that might happen, historically it’s been pretty much 50/50 as to whether equities will rise or fall during an interest rate tightening cycle.

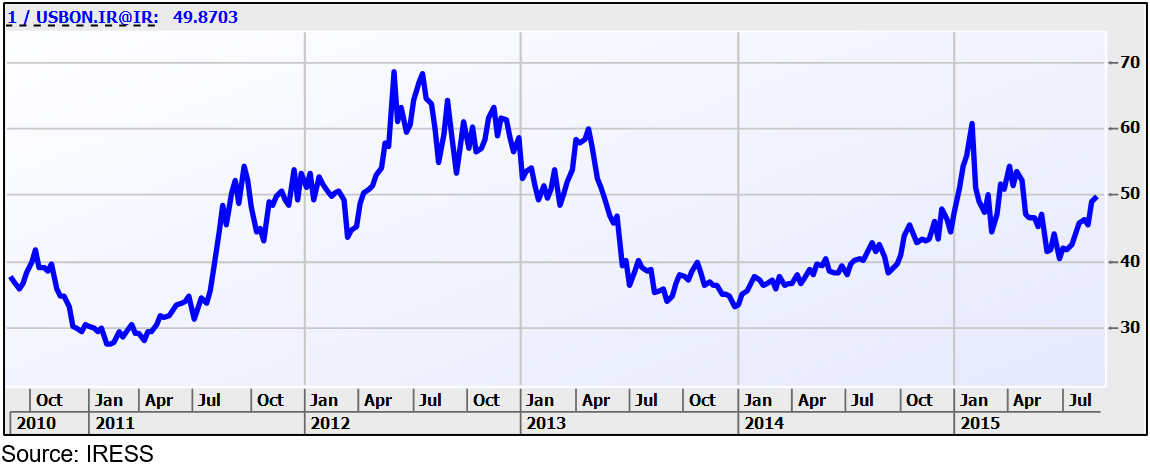
The other great concern is that rising interest rates are bad for bond markets and a large chunk of the liquidity created over the last six years has flowed into bonds. The thing is, if this was driving markets it’s hard to reconcile with bond prices going up over the past few weeks as equities have fallen (see the chart below).

The price of U.S. 10 year bonds has risen – a flight to safety
Who or what has caused this market correction_chart 6

Also, the Fed’s been sending the same message since last year, so why would the markets suddenly be so concerned?

It’s been a long time since we had a correction

We’re not big fans of the almanac approach to investing (you know the sort of thing: ‘63% of years where the market rose in the first week saw a positive year overall’), but a statistic that struck as quite interesting is that we haven’t seen a 10%+ correction in the U.S. equities markets for some 977 trading days, whereas the average gap is 357 days.

Markets climb what’s often referred to as ‘the wall of worry’. That is, the higher a market climbs the more we worry that something will come along to unsettle it, which makes sense. That’s why commentators have found so many things to account for the markets being unsettled: to the list above you can add Greece, geopolitics, even weather.

Furthermore, the rally over the past few years has been one of the lowest volatility periods we’ve ever seen in markets. Not just equities markets, but pretty much all asset classes. The reason for that is the massive amount of liquidity that has been released by central banks through quantitative easing programs has sloshed around the world looking for a return. Whenever and wherever there was relative value, money has found its way there, which kept markets trending in one direction, thus keeping volatility unusually low.

The current bull market (which is technically defined as a continuous run without a correction of more than 20%) has been going for some six years, which is a long time by historical standards. As markets rise further and further it inevitably sees some investors worry more and more about what is going to continue to underpin it.

What we know it isn’t

Hysterical commentators pointing to traders, and particularly the dreaded short sellers, are way off the mark. Short sellers (those who sell shares they don’t own and then buy them back after the price has fallen) do not determine overall market levels. Invariably they are of such small numbers there is no way they can wield that much influence. The misguided attempts by the Chinese to halt their recent market selloff by banning short selling was every bit as ineffective as the same bans by western governments during the GFC.

Market levels are determined by earnings and valuations, not by a few hedge funds or traders.

We also know the selloff is not because the U.S. economy is heading into a ditch. This article provides a cleverly written account of just how good things are in the U.S. right now: record profit margins, companies sitting on record cash balances, unemployment at half the level of the GFC, household and corporate balance sheets at multi year highs. Hardly the stuff of disaster.

The bottom line: it’s everything

Overall, there doesn’t seem to be a single compelling reason that’s suddenly arisen to account for the sharp selloff we’ve seen in the past week or so. Those that have been pointed to we’ve known about for a while. But maybe that’s where the reason lies: U.S. equities markets were at record highs only a month ago despite commodities falling so far, and China slowing down, and interest rates potentially rising, and some emerging market economies struggling and whatever else. The sheer amount of liquidity had happily steamrolled over the speed humps until they all piled up into that wall of worry.

What do you do about it? Just as this correction doesn’t appear to have a single compelling reason for starting, there may not be a single reason for it ending. In other words, it is next to impossible to time markets, but you can know when markets represent attractive long-term value, which is what we believe is the case now. Financial markets go up and down: that doesn’t mean they’re broken, it’s just what they do.

China: what’s going on and should we be worried about it?

China: what’s going on and should we be worried about it?

The Australian economy is accustomed to catching colds from other economies and nervous investors have a natural fear the sniffles will be contagious and spread to the share market. So when your biggest trading partner, which also happens to be the second biggest economy in the world, experiences a collapse in its stock market in a matter of a few weeks, it’s understandable if people ask whether they should be retiring to bed with a long, hot glass of lemon and honey. In this instance, we think it’s pretty safe to soldier on.

The Shanghai Composite Index has fallen about 28% since its recent peak on June 12, a fall that has been likened to the U.S.’s 1929 crash in its ferocity. As it happens, the underlying cause for the sharpness of the selloff is similar as well: margin lending. Debt is fantastic as long as things are going the right way and gains are magnified, but once things turn bad it’s the losses that get magnified and things can get very ugly, very quickly.

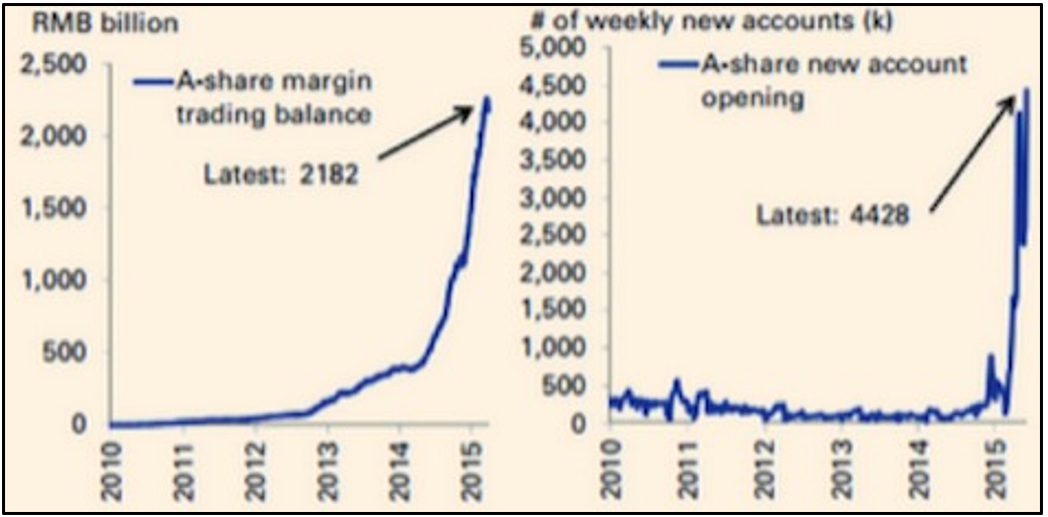
Margin lending was only introduced into the Chinese stock market in 2010, and restrictions were relaxed last year when the government was encouraging people to buy shares and discouraging property investment. The government also lifted restrictions on how many stock broking accounts investors could open. The plan worked really, really well – as you can see from the chart below. Margin loan balances went up more than seven-fold in less than 18 months and the market shot up.

Chinese investors opened a lot of stock broking accounts and margin loans
China whats going on and should we be worried about it
Source: Goldman Sachs

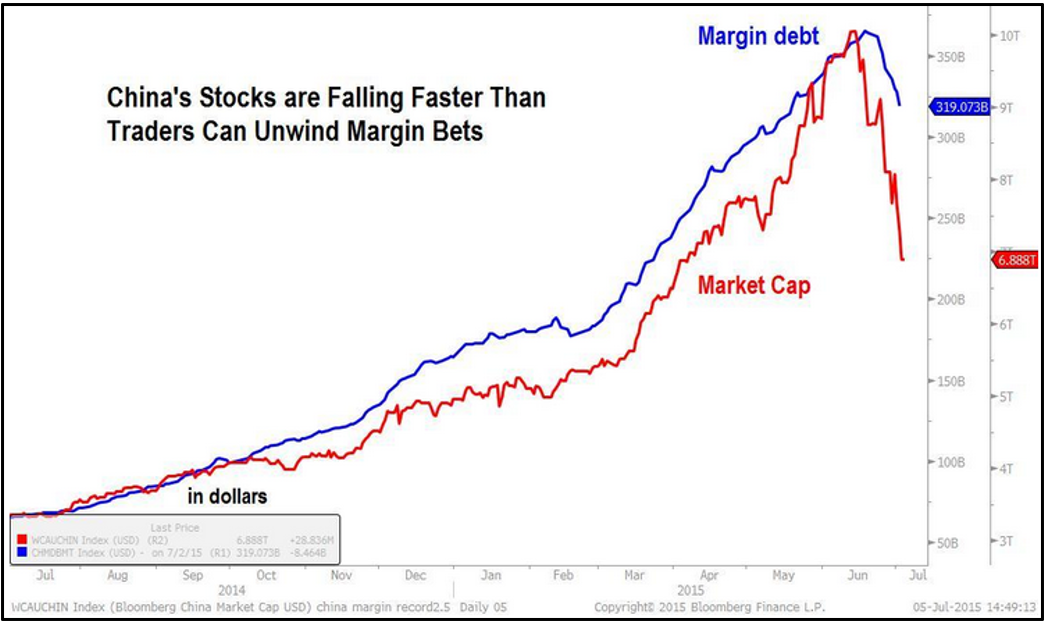
At the start of 2014 the Chinese stock market was cheap, trading on a price to earnings ratio of less than 9 times, compared to the U.S.’s S&P500 on about 17 times. By June of this year the market had gone up by about 145% and the median PE of mainland stocks was trading at 73 times. The chart below appears to indicate margin lending had a lot to do with that astonishing rise.

China whats going on and should we be worried about it_image 2
Source: Bloomberg LLP

There’s a bit of a learning curve for the Chinese authorities on margin lending though: whilst stock broking companies are more easily regulated and typically require RMB500,000 of capital, enterprising and (more importantly) unregulated online lenders started offering the equivalent of low doc loans to punters with as little as RMB2,000 and the promise of being able to leverage up five times – all for the bargain cost of up to 22% p.a. interest rates. Eventually, it’s estimated that margin loan balances were equivalent to between 9-12% of the stock market’s total value, compared to about 4% in the U.S.’s dot com boom of 1999-2000. What could possibly go wrong?

In a classic case of selling begetting more selling, margin traders have been closing out positions for a record 10 straight days, and they’re still going. In an effort to shore up the market the Chinese government has allowed companies to buy their own shares and encouraged pension funds to buy shares. But who wants to stand in the way of an oncoming train? In their efforts to find a scapegoat the authorities have blamed foreigners and short sellers, but in fact short positions were at their lowest level since June 2014 at an almost meaningless 0.03% of the market, and foreign managers have been buying on weakness.

This is a great illustration of how dangerous a combination debt and momentum investing can be. But do investors, particularly those here in Australia, need to worry? In our view, not a lot.

The gyrations of the Chinese stock market don’t have much to do with anything other than debt and internal factors. Yes, it’s caused some short-term volatility on the ASX, which has been exacerbated by what’s happening with Greece and the Eurozone, but that too is unlikely to have much consequence for Australia. It’s a well-established fact that share markets have pretty much zero correlation with GDP growth, so we shouldn’t take this as an indication that our exports to China are in danger of falling off a cliff. Valuations on the Australian market are cheap right now, with our models forecasting a ten year annualized return of more than 10%. Likewise, European shares are also cheap.

How are the Steward Wealth portfolios being affected by the Chinese selloff? We use two emerging markets funds. The first is the Robeco Emerging Conservative Fund, which has 15% of its portfolio in Chinese shares, compared to the index weighting of more than 25%. The other is the Aberdeen Emerging Opportunities Fund, which holds 7% in China. On a combined, weighted basis we are at about half the benchmark weighting to China, plus both have strict policies of only investing in quality companies, so we can safely presume there were no holdings on PE’s of 73 times. Whilst they won’t be immune to the gyrations, they won’t be as exposed.

Overall, we’re keeping a close eye on what’s going on but we see nothing to panic about. Not that the media would have you believe that’s the case. But as we’ve said many times, the media knows their audience is far more likely to read an article with a headline screaming “CRISIS!” than one that says “relax, things aren’t as bad as they seem”.

Unforeseen U.S. Oil Boom Upends Markets

Unforeseen U.S. Oil Boom Upends Markets

Source: Bloomberg: Asjylyn Loder Jan 9, 2014 “link to full article” When drilling for oil and gas in US shale first emerged a few years ago it was projected to be a game changer for US energy costs and consequently for global oil and gas markets. This article from Bloomberg confirms the impact it has had, with US oil production rising by a record 39% in the last three years and refined oil exports hitting a record in December. Indeed, the US is on pace to become the world’s largest oil producer by 2015! The impact has been far reaching: obviously US industry is benefiting from cheaper energy prices, but 15 European refineries have been closed in the past five years and talk of exporting gas to Asia could put Australia’s lucrative LNG exports at risk. On the flip side, more and more countries from China to the UK are exploring the possibilities of their own shale production. There could even be political ramifications from the reduced reliance on Middle Eastern production.

Unforeseen U.S. Oil Boom Upends Markets as Drilling Spreads

The U.S. oil boom has put European refineries out of business and undercut West African crude suppliers. Now domestic drillers threaten to roil Asian markets and challenge producers in the Middle East and South America. Fifteen European refineries have closed in the past five years, with a 16th due to shut this year, the International Energy Agency said, as the U.S. went from depending on fuel from Europe to being a major exporter to the region. Nigeria, which used to send the equivalent of a dozen supertankers of crude a month to the U.S., now ships fewer than three, according to the U.S. Energy Information Administration. And cheap oil from the Rocky Mountains, where output has grown 31 percent since 2011, will soon allow West Coast companies to cut back on imports of pricier grades from Saudi Arabia and Venezuela that they process for customers in Asia, the world’s fastest-growing market. “I don’t really think anyone saw this coming,” said Steve Sawyer, an analyst with FACTS Global Energy in London. “The U.S. shale boom happened much faster than people thought. We’re in the middle of a new game. There’s nothing in the past that predicts what the future will be.” Advances in extracting oil from shale rock drove a 39 percent jump in U.S. production since 2011, the steepest rise in history, and will boost output to a 28-year high this year, according to the EIA. While drilling in shale is more expensive than other methods and poses environmental challenges, the prospect of a growing supply is encouraging analysts to predict a more energy-independent nation.

Crude Exports

With U.S. exports of gasoline and other refined products hitting a record last month and the country on pace to become the world’s largest oil producer by 2015, five years faster than the IEA’s earlier predictions, industry advocates such as Senator Lisa Murkowski of Alaska are calling for an end to 39-year-old restrictions on U.S. crude exports. In a measure of just how quickly the oil market has changed, President Barack Obama unveiled in March 2011 a goal considered so outrageous that correspondent Christopher Mims wrote on the environmental news website Grist that it could be accomplished only by “an economic crash bigger than any ever seen in U.S. history, or perhaps an alien race forcing all of us to take to our bicycles.” Obama said that by 2025 the U.S. would cut crude imports by one-third. It didn’t take 14 years. It took less than three.

End Restrictions

The country is so flush with crude that imports are plunging and drillers are challenging export limits imposed after the 1973 Arab oil embargo. Murkowski, the top Republican on the Senate Energy Committee, called on Obama yesterday to end restrictions and vowed to introduce legislation if he doesn’t. Easing controls would have been unthinkable just three years ago, when uprisings in Arab countries such as Libya pushed crude prices over $100, said Philip Verleger, a former director of the office of energy policy at the Treasury Department and founder of the Aspen, Colorado-based consultant PKVerleger LLC. The boom has been led by drilling in the Permian Basin in West Texas and the oil-rich Bakken shale, which stretches from North Dakota into Montana and Canada. North Dakota and Texas have more than doubled crude output since Obama’s 2011 speech, with Texas pumping more than Iran, according to the EIA, the statistical arm of the U.S. Energy Department, and a Bloomberg survey of producers, oil companies and analysts.

Bone Springs

Drilling is spreading in emerging oil fields in the Rocky Mountain region such as the Niobrara in Colorado and the Bone Springs in New Mexico and spurring a revival of crude extraction around Wyoming’s Teapot Dome formation, home of the first U.S. reserves and the namesake of a 20th century political scandal. Colorado’s production jumped 17 percent in the first 10 months of 2013, Wyoming rose 16 percent and New Mexico added 10 percent, according to the EIA. A record amount of crude is already riding the rails from oil fields in North Dakota, Colorado and New Mexico to California’s fuel makers, according to the California Energy Commission. Companies looking to ship even more include Tesoro Corp., Valero Energy Corp. (VLO) and Plains All American Pipeline LP (PAA), which are planning to build train terminals in California and Washington state, according to company statements and regulatory filings. Plans are awaiting permits or in the planning stages to handle capacity roughly equal to the amount of crude sent to the region by Saudi Arabia.

Asia Demand

If the railway networks on the U.S. West Coast are completed, the region’s refiners will be able to use domestic crude supplies to boost exports to meet rising needs in Asia, where demand for new cars, electricity and air conditioning is boosting energy consumption. China, already the world’s largest importer, will rely increasingly on crude from the Middle East and refined fuels from the U.S. to meet its consumers’ growing demand. An increase in the number of U.S. cargoes to Asia might force Saudi Arabia to cut its output to head off a worldwide glut, Verleger said. As the de facto leader of the Organization of Petroleum Exporting Countries, the kingdom is monitoring signs of potential oversupply as Iraq and Libya try to boost output and Iran increases exports as international sanctions are loosened, he said. “It’s another outlet for North American oil products and means more supply for the rest of the world,” said Andy Lipow, president of Lipow Oil Associates LLC, an energy consultant in Houston. “The West Coast is behind the rest of America as far as getting crude by rail. It will increase supply and help the consumer.”

Hydraulic Fracturing

The U.S. gains were made possible by innovations in horizontal drilling and hydraulic fracturing, or fracking, that have unlocked fuel trapped in underground rock. The technology allows producers to bore horizontally, then use explosives and a high-pressure stream of water, sand and chemicals to blast open fractures that free the oil. The process comes with environmental risks. A 2011 U.S. government report found fracking chemicals in groundwater in Pavillion, Wyoming, and in June, 47 people died when an unmanned train carrying Bakken crude derailed and exploded in Lac Megantic, Quebec. Crude from the Bakken may be more flammable and more dangerous to ship than other types of oil, the U.S. Transportation Department said Jan. 2. Fracking is also more expensive than traditional extraction. Drilling a horizontal shale well in the Bakken can cost 10 to 20 times what a vertical well might cost, according to Austin, Texas-based Drillinginfo Inc. Production from shale wells declines by 60 percent to 70 percent in the first year, while output from traditional wells diminishes by as much as 55 percent in two years before flattening out, according to Drillinginfo.

Import Need

One reason the U.S. still depends so much on imports is that demand continues to outstrip domestic supply. Another reason is the quality of crude its refineries can handle. Many of them performed expensive upgrades in the past decade so they could process oil from overseas that was more difficult to turn into transportation fuel. Gasoline users and diplomats benefit from the surge in U.S. production. While the 2011 Libyan uprising had U.S. consumers paying almost $4 a gallon for gasoline, pump prices declined 1.3 percent last year and averaged $3.31 a gallon yesterday, according to AAA, the largest U.S. motoring organization. That was even after sanctions cut off more than 1 million barrels a day of Iranian oil exports. Starved of their primary source of cash, the Islamic republic’s leaders in November reached an agreement to curb its nuclear program. “It took time to realize how significant this transformation was going to be,” said Jason Bordoff, who was an energy adviser to the National Security Council and helped draft Obama’s 2011 speech. “We were able to impose pain on Iran without imposing pain on ourselves.”

Rail Routes

New rail routes and pipelines are carrying increasing supplies of crude from North Dakota, Oklahoma and elsewhere to refiners in New Jersey, Louisiana, Texas and Pennsylvania. They are in turn sending cargoes of diesel to London, Rotterdam and Antwerp, Belgium. U.S. fuel exports to the Netherlands, a major import hub for the region, reached a record in September, according to the EIA. The one-two punch of declining crude imports followed by rising fuel exports hit the refining industry in Europe and the U.K. particularly hard. That’s because refiners outside North America typically buy oil based on the price of Brent crude, a North Sea grade that last year cost an average of almost $11 a barrel more than West Texas Intermediate, the U.S. benchmark. WTI futures on the New York Mercantile Exchange settled at $92.33 a barrel today, $14.82 below the Brent price of $107.15 on ICE Futures Europe in London. It was the widest spread at the close since Dec. 3. The spread widened to a record $27.88 a barrel in October 2011. “When historians write this story 10 or 20 years from now, they are going to look at a very different U.S.,” said Verleger, the former Treasury Department official. “Everything has changed.”