Equities markets all over the world have had a horrible start to the year, with the Australian market down 7%, the U.S. market by 8%, Europe 6%, the U.K. 5% and China a whopping 18%. It’s natural for investors to get concerned by that, but there are a few points to remember.
First is that what happens at the start of a year in equities markets does not necessarily bear any resemblance to what will unfold over the entire year. For example, last year saw the ASX200 rise 12% in the six weeks between mid-January and the end of February, yet we ended the year down 2%.
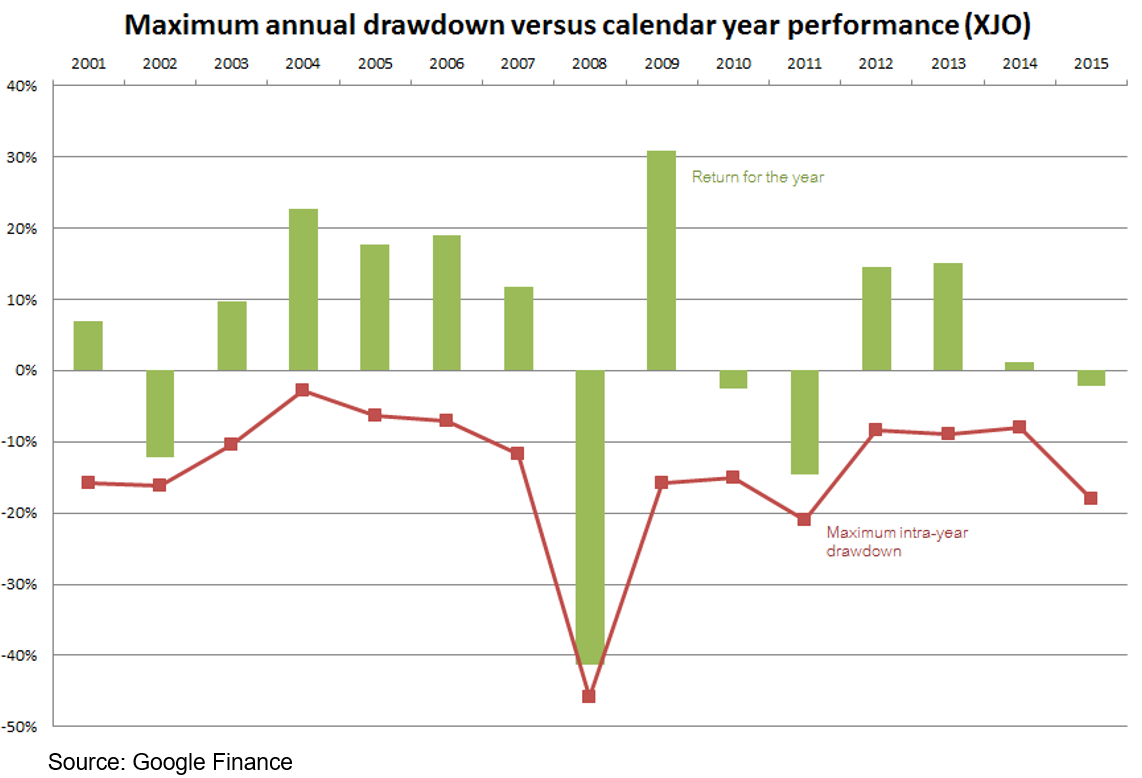
Second, intra-year volatility is part and parcel of share markets. The chart below shows the biggest intra-year declines (also referred to as ‘drawdowns’ or ‘corrections’) for each year going back to 2001, together with the final outcome for each year. Nine out of the fifteen years saw a drawdown of more than 10%, and in fact the average drawdown over the period was 14% (even leaving 2008 out as an outlier the average is still -12%), yet the average return over the whole year was 5%, and 10% including dividends.

It’s a similar story for the United States, where over the 65 years to 2014 the S&P500 saw a 10% correction or worse in more than half the years, yet the annual average return over that period was 11%.
Third, if you’re a long-term investor, or investing to achieve particular goals or outcomes, breaking stock market returns into discrete periods is pretty artificial in any case. You really are better off viewing returns as a continuum that will inevitably have its ups and downs, but which trends upwards over the long run. Selling with the intention of buying back in later, which is effectively trying to time markets, is notoriously difficult.
Fourth, you should always be wary of doomsayers and the media when market volatility spikes up. The media knows bad news sells so they promote those commentators with the grimmest views and who sound the most confident, yet studies have shown those same commentators have the worst track records.


