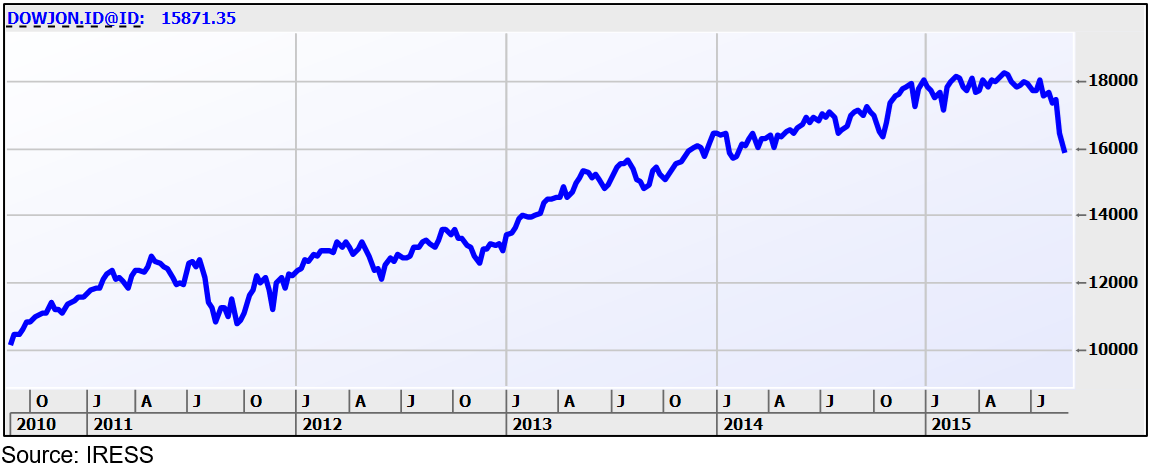
When the U.S.’s Dow Jones index falls more than 1500 points in three trading days you expect to be able to point to some obvious, clear reasons. But there hasn’t been a central bank declare it’s stopping QE, or raising interest rates, there hasn’t been a war start or catastrophic terrorist event. Yet this market correction took a sudden sharp turn (see the chart below) apparently due to reasons that have been around for a while. Let’s look at some of them and see if it makes sense.
The Dow Jones – a sudden sharp turn
China
Last week China took markets by surprise and devalued its currency two days in a row by a total of 4.6%. The bears promptly declared it reflected the Chinese government worrying that growth is slower than expected, and since China has been portrayed as the engine of global growth for years that will have negative consequences for the rest of the world. The government’s ham fisted attempts at standing in the way of the market train didn’t win many fans either and left some commentators pointing to that as evidence the government doesn’t exercise the control over the economy they (and perhaps we) thought they do.
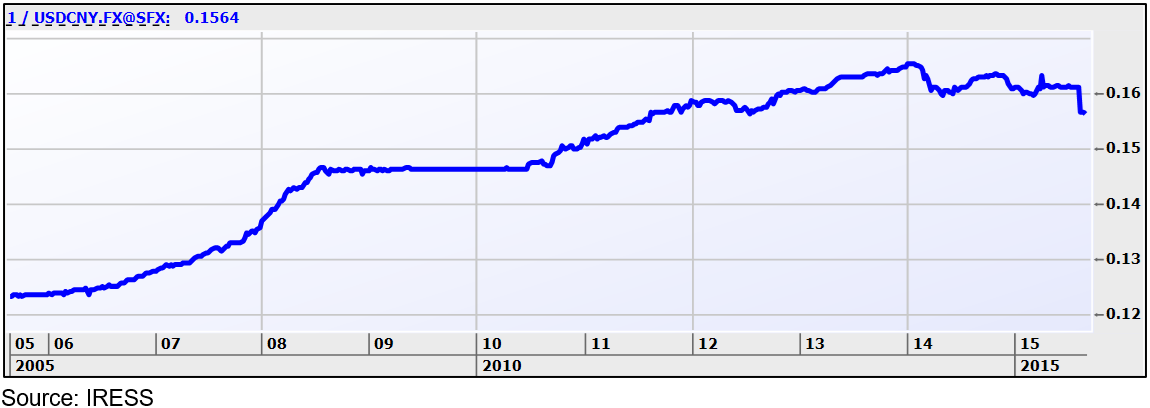
On the other hand, the Chinese have been trying for years to have the Renminbi included in the basket of currencies the IMF uses to calculate Special Drawing Rights (SDR’s), if for no other reason than recognition of its global economic stature. But the IMF has always said China needs to let markets play a greater role in determining its currency. So that’s what China did: allowing the RMB to fall against the U.S.$ was what market forces dictated (there’s a lot of capital locked up in China that would like to find a home elsewhere). Bear in mind a 4.6% move is nothing compared to the 30% declines in the Euro and the Yen, and is even more inconsequential when you consider the RMB has risen against the U.S.$ by some 20% over the past five years (see the chart below).
How many U.S.$ can be bought by one Chinese Renminbi
It seems one of the triggers for last Friday’s selloff was the release of the Caixin PMI (Purchasing Manager’s Index), which fell to a six year low. This is a measure of sentiment in the manufacturing industry, so again is seen as a poor reflection of the manufacturing-dependent Chinese economy.
However, that same index has been falling for six consecutive months, so it’s not new news. Also, something that is often overlooked, manufacturing’s share of the Chinese economy has fallen over the past 10 years from 47% to 43% while the services sector has risen from 41% to 48%. While that doesn’t sound like much, in a U.S.$10tn economy that’s a big deal. We’ve known for years the government wants to transition the Chinese economy away from being reliant on being the world’s factory, and now it’s actually happening.
There has been a bunch of indicators showing the Chinese economy has slowed over the past couple of years. Firstly, that was inevitable and as the economy gets bigger it’s going to be harder to sustain those extraordinary growth rates. Also, again we’ve known that’s been happening for a while, so there’s no clear reason for it to suddenly be a catalyst for a selloff.
A slowing Chinese economy is certainly not great news for the likes of Australia, but it’s not a good reason for the U.S. to be sold off since the external sector accounts for less than 15% of its total economy.
Emerging markets
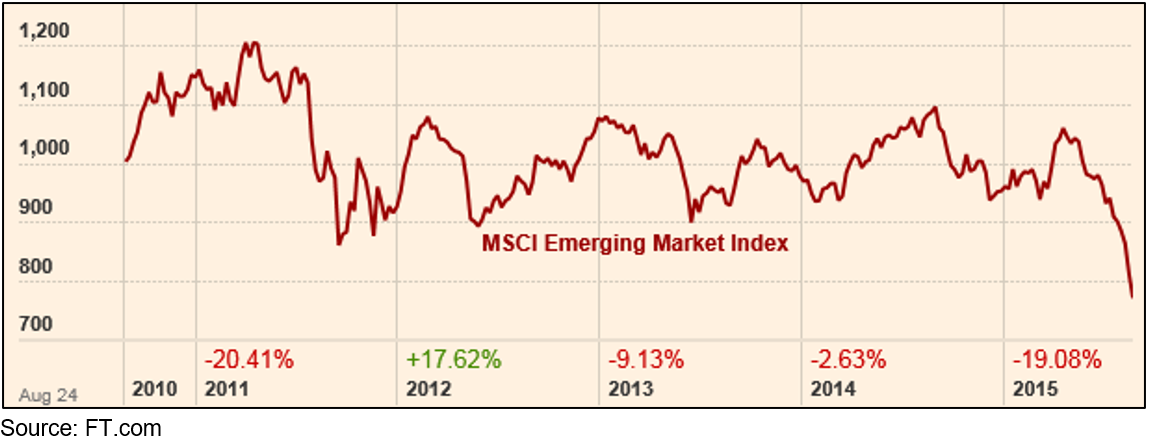
It seems the market weakness started in the emerging markets and spread to the developed. There have been stories recollecting how in 1998 the EM currency crisis spread through the region culminating in the Russian debt default. The reason that happened was because back then most EM debt was denominated in U.S.$. As the downward pressure on their domestic currencies rose and rose it became harder and harder for them to meet their bond repayments.
Nowadays though, most EM debt is denominated in local currencies. Overall, debt levels in the EM countries are lower and growth is higher, so they appear to be in better shape than many of their developed market counterparts. And while there are some political issues that you can rightly point to would be unfavourable for markets, such as Brazil’s government enjoying less than 10% support, or Malaysia’s Prime Minister having to explain how U.S.$700m ended up in his bank account form the nation’s sovereign wealth fund, they are such small markets on a global scale that it’s tough to see how they could be a trigger for global selling.
Undoubtedly, some of the massive liquidity injections from the various DM quantitative easing programs found its way into the EM economies, and there is a risk it will be sucked back out again as U.S. interest rates inevitably go up. To do that obviously requires selling the EM assets, so there will be downward pressure on their values. But we’ve known the U.S. stopped its QE program last October, so it’s unclear why that would suddenly be a strong reason to sell.
Commodities
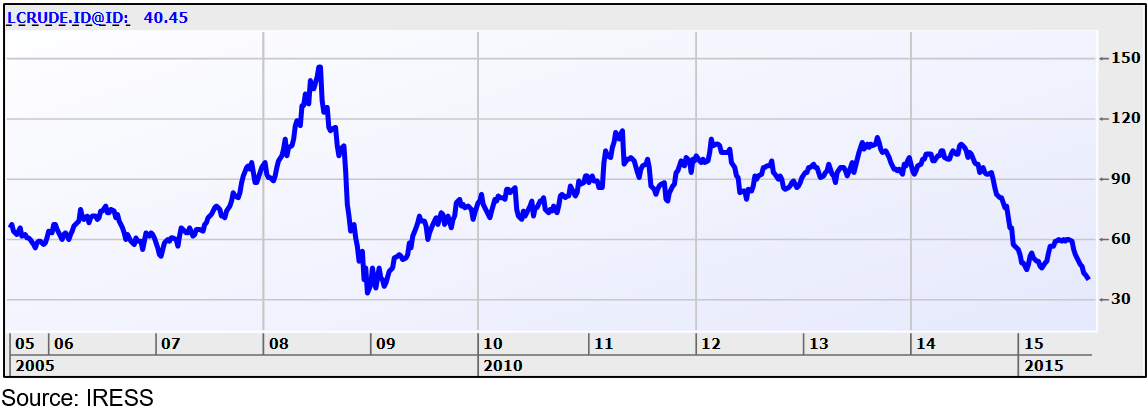
Much has been made that oil is trading at U.S.$40 per barrel. That’s as low as it’s been since the dark days of the GFC (see the chart below), which is bad news for those countries that are reliant on oil revenues and you can understand why their oil-dependent companies would be sold down. But it’s great news for economies that import oil. In fact, it’s estimated that every 10% fall in the oil price adds 1.5% to Eurozone GDP growth, and as a rule most energy savings in those countries tend to turn up in other consumer spending.
Oil price
The rest of the commodities complex is also struggling (see the chart below), with overall prices now below where they got to in the GFC.
Bloomberg Commodities Index
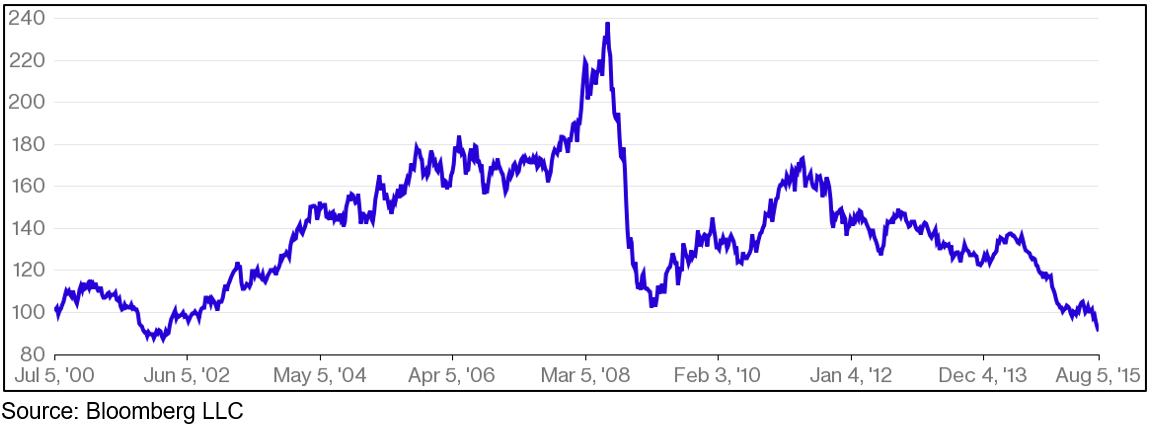
Again, that’s not great news for those economies that are reliant on commodities for income, like Australia, Brazil, Russia, Canada, etc. But it’s really good news for those countries that have to buy a lot of commodities, like China, South Korea, Japan, etc.
Also, commodities prices have been falling since 2011, why should they suddenly be causing a selloff now? Perhaps the reason lies in what the falling prices reflects: a slowing in demand back to levels that we associate with a time of severe dislocation.
U.S. interest rates
Just last week the U.S. Federal Reserve again confirmed it is inclined to raise interest rates this year. There is consternation this will disrupt capital flows as money floods into the U.S. to take advantage of the higher interest rates. Whilst that might happen, historically it’s been pretty much 50/50 as to whether equities will rise or fall during an interest rate tightening cycle.
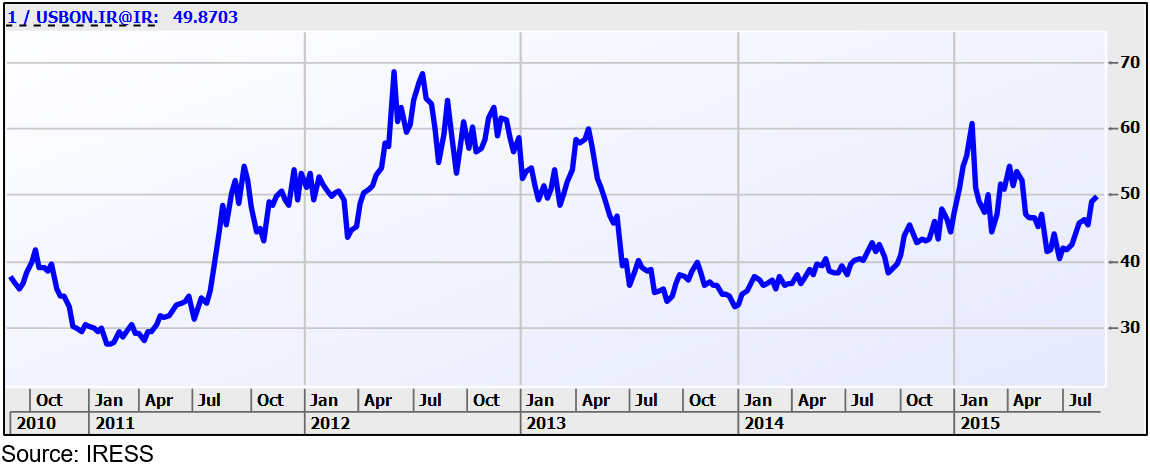
The other great concern is that rising interest rates are bad for bond markets and a large chunk of the liquidity created over the last six years has flowed into bonds. The thing is, if this was driving markets it’s hard to reconcile with bond prices going up over the past few weeks as equities have fallen (see the chart below).
The price of U.S. 10 year bonds has risen – a flight to safety
Also, the Fed’s been sending the same message since last year, so why would the markets suddenly be so concerned?
It’s been a long time since we had a correction
We’re not big fans of the almanac approach to investing (you know the sort of thing: ‘63% of years where the market rose in the first week saw a positive year overall’), but a statistic that struck as quite interesting is that we haven’t seen a 10%+ correction in the U.S. equities markets for some 977 trading days, whereas the average gap is 357 days.
Markets climb what’s often referred to as ‘the wall of worry’. That is, the higher a market climbs the more we worry that something will come along to unsettle it, which makes sense. That’s why commentators have found so many things to account for the markets being unsettled: to the list above you can add Greece, geopolitics, even weather.
Furthermore, the rally over the past few years has been one of the lowest volatility periods we’ve ever seen in markets. Not just equities markets, but pretty much all asset classes. The reason for that is the massive amount of liquidity that has been released by central banks through quantitative easing programs has sloshed around the world looking for a return. Whenever and wherever there was relative value, money has found its way there, which kept markets trending in one direction, thus keeping volatility unusually low.
The current bull market (which is technically defined as a continuous run without a correction of more than 20%) has been going for some six years, which is a long time by historical standards. As markets rise further and further it inevitably sees some investors worry more and more about what is going to continue to underpin it.
What we know it isn’t
Hysterical commentators pointing to traders, and particularly the dreaded short sellers, are way off the mark. Short sellers (those who sell shares they don’t own and then buy them back after the price has fallen) do not determine overall market levels. Invariably they are of such small numbers there is no way they can wield that much influence. The misguided attempts by the Chinese to halt their recent market selloff by banning short selling was every bit as ineffective as the same bans by western governments during the GFC.
Market levels are determined by earnings and valuations, not by a few hedge funds or traders.
We also know the selloff is not because the U.S. economy is heading into a ditch. This article provides a cleverly written account of just how good things are in the U.S. right now: record profit margins, companies sitting on record cash balances, unemployment at half the level of the GFC, household and corporate balance sheets at multi year highs. Hardly the stuff of disaster.
The bottom line: it’s everything
Overall, there doesn’t seem to be a single compelling reason that’s suddenly arisen to account for the sharp selloff we’ve seen in the past week or so. Those that have been pointed to we’ve known about for a while. But maybe that’s where the reason lies: U.S. equities markets were at record highs only a month ago despite commodities falling so far, and China slowing down, and interest rates potentially rising, and some emerging market economies struggling and whatever else. The sheer amount of liquidity had happily steamrolled over the speed humps until they all piled up into that wall of worry.
What do you do about it? Just as this correction doesn’t appear to have a single compelling reason for starting, there may not be a single reason for it ending. In other words, it is next to impossible to time markets, but you can know when markets represent attractive long-term value, which is what we believe is the case now. Financial markets go up and down: that doesn’t mean they’re broken, it’s just what they do.


