China – time to buy?

China – time to buy?

From its peak in early February 2021, China’s share market went through a grinding three-year decline of 40 per cent, while over the same period the MSCI World index was up 20 per cent. When one of the world’s largest stock markets underperforms by 60 per cent it makes sense to see if there’s a bargain to be had.

Chart 1: there’s real money going into IT spending in the US

What’s happened to China?

The fabled China growth miracle hit a couple of huge speed bumps in the form of COVID and a serious shakeout in the property sector.

In the six years to the end of 2019, China’s annualised GDP growth rate declined in a very smooth, if not controlled, path from a ridiculously high 7.5 per cent to a still astonishing 5.8 per cent. Then COVID wreaked havoc. Between stringent lockdowns and the government’s refusal to make similar fiscal injections as western governments, the Chinese economy didn’t bounce out of COVID in the same way Australia and the US.

Chart 2: the S&P 500’s PE ratio with and without the MegaCap 8

The COVID slowdown triggered an almighty reckoning in the property market, which accounted for a whopping 30 per cent of China’s GDP in 2022. The government finally tried to deflate a classic speculative property bubble, which led to two of the biggest property developers in China, Evergrande and Country Gardens, which between them had more than USD520 billion of debt, spiralling toward oblivion.

Recent data showed housing starts in China fell 30 per cent year on year and completions were down 20 per cent, while sales dropped 21 per cent and property values got crunched by 29 per cent.

While those numbers are very messy, the government was determined to avoid the banking catastrophe the US experienced in 2008. Dr Joseph Lai, of Ox Capital, reckons that although there will be significant bad debts, they appear to have already peaked and the banking system has proven to be resilient.

Positive signs?

There was general surprise when China’s 2023 GDP growth came in a bit better than expected at 5.2 per cent, and Citibank notes the February data contained some positive signals, with industrial production rising 7 per cent year on year, in stark contrast to the US where it was slightly negative over 12 months.

Investment was also “way higher than consensus”, with manufacturing investment up an impressive 9 per cent for the first two months of the year and infrastructure 6 per cent, much of it actively encouraged by Beijing as a way of reducing the economy’s dependence on property.

The government is actively promoting decarbonisation industries, with the usual head spinning results you get when China puts its mind to something. For example, electric vehicle production has risen about seven-fold from pre-COVID levels, and now China produces about one-quarter of the world’s EVs and accounts for more than half of registered EVs worldwide. Similarly, solar battery production has risen more than three-fold and it accounts for more than 80 per cent of global solar cell exports and 50 per cent of lithium batteries.

The santa claus rally

Although the critical consumer sector is still not as optimistic as it was pre-COVID, retail sales rose a healthy 5.5 per cent compared to a year ago.

The share market

If share markets directly reflected economic growth, the Chinese share market would have been the world’s biggest a long time ago. The fact is, economic growth can be generated by government spending that doesn’t necessarily benefit private companies, or come from sectors that aren’t represented in the index.

Having said that, the Chinese market does look cheap. After that 40 per cent crash and bottoming in early February, the CSI 300 bounced more than 13 per cent in seven weeks, but at a time when markets across the world are hitting new all-time highs, China is still 38 per cent away from theirs. That bounce caught the attention of a lot of technical analysts, but consensus is that it’s still early days given there have been false starts over the past couple of years.

Aggregate weekly payrolls deflated by PCE inflation

China’s price to earnings ratio for the next year snuck below 10x and is still about half the US’s and way below Australia’s 17x, while earnings growth over the next year is forecast to be about 14 per cent, compared to Australia’s very pedestrian 0-3 per cent.

All eyes will be watching for signs the Chinese government will increase its support for either the economy, or the share market, or both. There had been hopes the government would repeat the massive spending package of 2008 that helped drag the world out of the GFC, but it never came. There has been some easing of borrowing rates and ham-fisted restrictions on selling Chinese stocks by local financial institutions, but no killer package.

There is no telling if the Chinese stock market crash is over, but smart investors know that in carnage can lie opportunity. For those looking to access China, VanEck has two ETFs listed on the ASX: CETF invests in the 50 largest mainland companies, and CNEW uses an algorithm to invest in 120 quality companies across IT, healthcare, consumer staples and consumer discretionary.

2024: What just happened and what lies ahead

2024: What just happened and what lies ahead

2023 – the scorecard

2023 started off with all kinds of dire forecasts, there had never been such an overwhelming consensus that the US economy would slump into recession and take share markets with it. But not only did the economy power through, so did share markets, and despite a choppy start to the year, they finished with a powerful rally that saw respectable returns across the board – see chart 1.

As well as a strong performance out of the US, Japan had a storming year on the back of solid earnings growth, finishing at the highest since its legendary boom of the 1980s, and Germany, where the economy continues to flirt with recession, is also trading at all-time highs, as is India.

Chart showing bond yields trended down, resulting in a 40-year bull market, which went into reverse in mid-2020

The story of last year was pretty much the mirror image of the previous year: 2022 saw markets fall because of negative sentiment, known as “PE compression”, whereas 2023 was largely about PE expansion, or positive sentiment. What that means is that theoretically share prices should go up (or down) by the same amount as earnings growth + dividends, and anything more or less than that is attributable to sentiment, that is, whether investors are feeling bullish or bearish, which is measured by changes in the price to earnings (PE) ratio that people are willing to pay. The grey bars in chart 2 show just how much of a contribution that positive change in sentiment added to returns in 2023.

Chart showing the Australian government bond, GSBG33, has experienced higher<br />
volatility than what many would associate with a defensive investment

It was all about inflation

The positive change in sentiment was all driven by changes in the outlook for inflation and interest rates, or more specifically, the market’s perception of whether central banks have finished increasing rates and, if so, when will they start cutting them?

Inflation rates across the world have indeed fallen considerably, but how much of that is attributable to central banks increasing interest rates is unclear. It’s pretty conspicuous that, despite the variability in when and how different central banks responded, the cycle we’ve just experienced has played out similarly across the developed world: inflation rates started rising sharply in 2020, peaked for most countries around the middle of 2022, and have been falling at a pretty similar pace since – see chart 3.

Chart showing the Australian government bond, GSBG33, has experienced higher<br />
volatility than what many would associate with a defensive investment

There’s a school of thought that disruptions to the supply chain were a significant contributor to inflationary pressures. The New York Federal Reserve Bank compiles an index that tracks pressure across global supply chains, see chart 4, and it traces a similar path to the inflation chart above. For a little context, the COVID-induced bottlenecks in the supply chain saw the index peak at almost 4.5 standard deviations above the average, which puts it so far out of the norm that the theoretical likelihood of it happening is close to zero. That kind of event is inevitably going to have serious consequences.

Chart showing the Australian government bond, GSBG33, has experienced higher<br />
volatility than what many would associate with a defensive investment

Likewise, raising interest rates aims to control inflation by reducing demand, but in the US, demand has remained very strong, indeed, GDP growth was 5.1% in the September quarter! So with demand going up, it’s hard to argue inflation coming down is because of higher interest rates.

Critically, in its last meeting for 2023, the US Federal Reserve acknowledged they think rates have peaked and the next move will be down. That lit a fire under financial markets, with both share and bond prices jumping, and kicking off furious speculation as to when the first cuts will come and how deep they’ll be.

Here in Australia, speculation is rife as to whether the Reserve Bank has also finished with rate rises, with some economists forecasting rate cuts before the end of 2024.

Lessons from 2023

As always, there are lessons to be learned (and perhaps relearned) from what happened in financial markets last year.

Macroeconomic forecasting is really hard (if not useless): at the end of 2022, there had never been such an overwhelming consensus among economic forecasters, and central bankers, that economies across the developed world were headed for recession. Forecasts for inflation were uniformly high, and for GDP growth, uniformly low. They weren’t even close.

There were dark mutterings from economists and central bankers reaching for the orthodox textbooks that unemployment rates were way too low for inflation to fall, and our new RBA Governor, Michelle Bullock, suggested Australia would need a jobless rate of 4.5% to relieve inflationary pressures, or a lazy 140,000 workers losing their job. Yet inflation rates have come down and unemployment rates remain at multi-decade lows.

The takeaway: the US Fed has hundreds of PhD economists and still can’t guess where inflation, unemployment or GDP growth will be less than a year out, but they continue to dominate headlines. You’re better off ignoring them, and certainly don’t let them influence your financial decisions.

It’s also worth bearing in mind, given markets have rallied on speculation of rate cuts, for that to happen implies not only that central banks believe inflation is under control, but that economic growth is softening to the extent it needs a boost from lower interest costs. There’s no guarantee on that.

Geopolitics is noise: there has been no shortage of geopolitical headwinds for financial markets to negotiate over the past couple of years. The Russian invasion of Ukraine was supposed to crush economic growth because of higher commodity prices, tension between the US and China had the media in a froth, and then another war in the middle east threatens to escalate. Yet markets have gone onwards and upwards.

The fact is, while wars are tragic and terrible and sabre rattling might keep us up at night, markets will only suffer enduring effects if corporate earnings take a hit.

Market concentration is not necessarily a bad thing: by the middle of last year, the US market had risen about 20%, but it had come entirely from the top 10 stocks. Bearish commentators were warning that investors in the US market were taking bigger and bigger risks because the weighting of the top 10 companies in the S&P 500 had never been so high, hitting 32%. By the end of the year, those 10 stocks had risen 62%, while the bottom 490 had gone up by a far more pedestrian 8%.

Australian investors should have no concerns about market concentration, given the top 10 companies in the ASX 200 account for more than 46% of the index.

It’s entirely possible the top 10 companies in an index could underperform or even fall, but if the rest of the rest of the companies in the index perform strongly, it will generate a good return. If a portfolio was comprised of nothing but the top 10 companies, obviously the risks are different, but some simple diversification can address those problems.

Bonds can be just as volatile as shares: traditional portfolio construction includes an allocation to bonds based on the theory that they reduce portfolio volatility and can act as a counter-correlated airbag to share markets.

While 2023 was nowhere near as bad for bonds as the record losses of 2022, they were still far more volatile over the year than shares, indeed, as chart 5 shows, the intra-year drawdown for US, German and UK 10-year bonds was around 40%, more than four times the drawdown of the S&P 500 and ASX 200 at their worst.

Chart showing the Australian government bond, GSBG33, has experienced higher<br />
volatility than what many would associate with a defensive investment

The outlook for 2024

While there are still a few bears growling about potential recessions, most forecasts are for equity markets to rise in 2024, and it’s even easier to find bond market bulls (though a lot of them are bond fund managers, so you have to be wary).

Australia

Australian company earnings dropped by more than 8% in 2023, having gone up by 16% the year before. One of our asset allocation consultants, farrelly’s, estimates long-term trend earnings growth for Australian companies at 3% per year, so given the recent fluctuations, it’s hardly surprising the current forecast is for about 1.2% earnings growth for 2024.

Of course, Australian shares typically pay a generous dividend by international standards, of about 4.4%, add 1.2% to that and you’d get a 6.6% return, which compares to a 30-year average annual return of 9.2%. We could reach that higher number if the PE ratio continues to expand, or if earnings are better then forecast. Of course, for those who benefit from franking credits, you can add an extra 1.4% to those numbers.

The ASX 200 finished 2023 on a forward PE ratio of 16.4x – see chart 6, which compares to a 20-year average of 14.6x. On that basis, it looks a little expensive, but it could simply be the market factoring in an earnings recovery.

Chart showing the Australian government bond, GSBG33, has experienced higher<br />
volatility than what many would associate with a defensive investment

United States

This is where things get really interesting. As noted above, in 2023 the US market was dominated by a handful of mega-cap tech companies, while the ‘bottom’ 490 stocks were pretty pedestrian by comparison.

The S&P 500 finished 2023 on a PE ratio of 19.5x, a hefty 17% premium to the 30-year average of 16.6x – see chart 7. However, if you break that down, the top 10 companies were on a PE of 27x, while the rest were on 17x. In other words, the ‘rest’ of the market is not expensive by historical standards.

Chart showing the Australian government bond, GSBG33, has experienced higher<br />
volatility than what many would associate with a defensive investment

J.P. Morgan argues the market is not especially expensive given companies reported free cash flow margins 30% higher than they were only 10 years ago, with a lot of that growth coming from the big tech companies. US funds management group, GMO, also points out that US corporate profitability, as measured by return on sales, has averaged 7% since 1997, compared to 5% before that – that’s a whopping 40% higher.

For 2024, the average forecast for the US market across 20 different international financial groups is a gain of 10.2% – for what that’s worth (which isn’t much). Of more relevance, corporate earnings are forecast to grow by 11.5%, plus the S&P typically pays a dividend yield of around 1.5%, which comes to 13%, roughly in line with the last 15 years average return of 13.8%, but comfortably above the 30-year average of 10.1%.

Something that plays on every asset allocator’s mind is chart 8 – which shows how extreme the US’s outperformance compared to the rest of the world has been since the GFC. Not surprisingly, most allocators look at that chart and immediately reduce the weighting to US shares. There are many explanations for the outperformance, not the least of which is that areas like Europe have been mired in an austerity mindset since 2009. There are, of course, two ways the gap could close: the US could fall heavily, or the rest of the world could make huge gains – or the trend could keep going. Unfortunately, there is no way of knowing.

Chart showing the Australian government bond, GSBG33, has experienced higher<br />
volatility than what many would associate with a defensive investment

Notably, in terms of valuations, the rest of the world (ex the US), is trading on a PE ratio of 12.9x, compared to a 20-year average of 13.1x, so fractionally on the cheap side. However, that’s a 34% discount to the US, which is the highest in at least 20 years.

Here are a few interesting observations, based on historical return for the US:

  • In late November last year, the S&P 500 made a new high since January 2022, i.e. it had been more than a year, and on the 14 previous occasions that’s happened, the market rose by an average of 14% over the following year and was positive 93% of those times
  • Since 1928, when the S&P has gone up by more than 20% in a calendar year, the average gain the following year was 11.4%, and it was positive 65% of the time
  • Since 1933, the fourth year of the presidential cycle has seen an average return of 6.7%, and is positive around 70% of the time
  • Deposits into money market funds last year were 13x more than what went into equities, taking total deposits to a record US$6 trillion, which on their own are expected to generate US$300 billion in interest income

Emerging markets

With a forward PE ratio of only 11.9x, the emerging markets look cheap compared to developed markets, however, that number is bang on the 25-year average and they’ve looked cheap for years and have underperformed the developed markets badly since the end of the GFC – see chart 9.

Chart showing the Australian government bond, GSBG33, has experienced higher<br />
volatility than what many would associate with a defensive investment

At a 26% weighting in the EM index, China is the 600-pound gorilla in the asset class, and it had a miserable 2023, falling almost 13%. Much of that is because the government refused to inject COVID stimulus at the household level, unlike western governments, forcing families to draw on their savings to get through extended lockdowns, and leaving consumers reluctant to spend once restrictions were lifted.

On top of that, the property sector, which was estimated to have contributed as much as 20% to GDP growth, is in disarray. The government has actively supported the rapid development of the electric vehicle industry, and now China makes more EVs than the rest of the world combined. It is possible that will be a strong new source of growth for the economy over the coming years.

By contrast, India, which is 17% of the index, is shooting the lights out, returning 20.3% in 2023 and hitting a new all-time high, and 15.8% per annum for the last three years. A combination of favourable demographics and a booming tech sector has proven to be a terrific tailwind.

Emerging markets returns tend to go in long cycles and appear to be linked to long-term trends in the US$, and trying to guess where currencies are going is even harder than share markets. The bottom line is that when an asset class is as cheap as EM is at the moment, it makes sense to have at least some weighting.

Real assets

Traditionally one of the more interest rate sensitive sectors, real assets, like property and infrastructure, have been beaten up badly over the course of the current interest rate cycle, but they turned sharply at the first hint that rates have peaked. In late October last year, the VanEck Global REIT ETF (REIT) was down by almost 40% from its peak, but then rallied more than 40% by the end of the year.

Chart 10 shows the relative earnings multiple that global REITs is trading on compared to equities puts them very much on the cheap side relative to the long-term average. The level of EBITDA hasn’t changed significantly, but the multiple it’s trading on has been derated to levels similar to the GFC and the COVID sell off, which is all sentiment-driven.

Chart showing the Australian government bond, GSBG33, has experienced higher<br />
volatility than what many would associate with a defensive investment
Small cap companies

Small cap companies is another asset class that has been brutalised over the past couple of years, both in Australia and internationally, to the point where they are now trading at multi-decade lows relative to large caps – see chart 11.

Chart showing the Australian government bond, GSBG33, has experienced higher<br />
volatility than what many would associate with a defensive investment

Notably, the US small cap index, the Russell 2000, jumped 26% from its lows at the end of October. Once again, since the index’s inception in 1979, there have been 21 previous occasions where it has rallied more than 20% in 50 days, and the average increase one year later was 16.5%, and it has never been lower. That compares to the average 12 month return of 10.5%.

Again, given how relatively cheap small caps are, it makes sense to have at least some allocation.

Fixed income

One of most popular sayings in financial markets recently has been, “Bonds are back!” The argument is that investors are now receiving a yield to invest in government bonds, unlike a few years ago where yields were approaching zero and, in many cases, actually went negative!

The prospects for bonds depends entirely on what happens with interest rates and inflation. Being paid to hold them is a start, but bond prices can be quite volatile – as discussed above.

Private credit continues to grow its share of the commercial lending market in the US, Europe and Australia. We remain strong supporters of well managed private credit backed by strong levels of security and low LVRs, with returns comfortably above those offered by bonds and, typically, zero volatility in the underlying unit price.

Conclusion

Financial markets have a knack for surprising, and 2023 was a great example of that. The headwinds that caused mayhem a couple of years ago have dissipated, but whether they become the tailwinds the market is hoping for is yet to be seen.

After what turned out to be a year of good returns in 2023, there are sound fundamental arguments to support a positive view on share markets for 2024, and there are certainly asset classes and sub-sectors that look relatively cheap.

The 2020 recession, why this time is different.

The 2020 recession, why this time is different.

There are number of things that make the global economic recession of 2020 different to any other we’ve seen, and while you’d never wish to go through an experience like it, there are definitely some silver linings.

The government forced the economy into recession

This was the first time in living memory that governments deliberately threw economies into recession. If you close down all but a few sectors and tell workers to stay home, obviously economic activity is going to crash.

Previous recessions have been attributable to the business cycle: typically there is a speculative build up which causes an imbalance that eventually tips over, and the worst recessions are those fueled by debt.

The standout example of this is, of course, the GFC. Building activity reached frenziewd levels in the US because buyers were able to access debt way too easily. The adjustment process was long and painful because credit, which is the lifeblood of a modern economy, all but seized up.

This time there were no baddies

When a recession is caused by excess building in some part of the economy, there is normally going to be a culprit you can point to. It might be banks, or it might be investors, but there’s a group that cops the blame and derision for crashing the economy.

That’s when the philosophy of ‘moral hazard’ argues if the culprits just get bailed out there’s no lessons learned to stop the same thing from happening again. Politicians and the media will often argue the responsible group should somehow be punished, perhaps with tighter regulations or even criminal charges.

This time (ignoring arguments about how COVID started and who or what is responsible), there is no real culprit to punish.

No holds barred support program

Because the government was responsible for switching off the economy and there was no concern about moral hazard, both they and central banks were able to throw the proverbial kitchen sink at supporting the economy.

Central bankers learned valuable lessons from the GFC that they had to make sure credit could continue to flow. The range of measures undertaken was unlike anything we’d seen before, and while things were ugly for a short time, markets were once again reminded how powerful central banks can be.

Remarkably, US financial markets have clearly recovered strongly despite the Federal Reserve barely tapping a range of the programs they announced – see chart 1 below.


Chart 1: US financial markets have recovered despite many of the Fed’s announced measures barely being utilized
Chart 1

The Bazooka

By far the most important support measures were from governments. One after another, governments wre throwing massive amounts of newly created money into their economies. Programs like JobKeeper in Australia and its equivalents overseas were critical in supporting families that otherwise would have been in dire financial circumstances.

The critical part is that it was newly created money, which governments can do directly, but central banks can’t. The central bank programs can help create new money by encouraging people to borrow (loans also create money) but that was going to be tough when the media was full of stories about the global economy crashing.

This is the opposite to what happened after the GFC, where, especially in Europe, governments preached from the gospel of austerity. Spending cutbacks sucked money out of economies and saw them slow to a grinding crawl.

Economies are on fire

Some of the data showing how sharply economies are bouncing back is remarkable. Here in Australia, we’re seeing restaurant bookings up to 50-80% compared with the same time last year, new car sales leaped 12% from last year and Commonwealth Bank credit card sales were up 11%. They are huge numbers and it’s not just because lockdown restrictions were eased.

The Australian government’s COVID support programs amounted to 13% of GDP. It’s hard to overstate how massive that is. In the wake of the GFC, the Chinese government ‘rescued’ much of the developed world by announcing a spending package equivalent to 12% GDP (clearly the absolute amounts are hugely different, it’s the proportion that’s significant). The early withdrawal of superannuation adds anotehr 2% to that. The household savings ratio hit almost 20% in the June quarter, only a fraction less than the highest it’s been in the past 60 years.

That’s an awful lot of pent-up spending power.

The silver lining

Ever since the end of the GFC, central banks have pleaded with governments to raise fiscal spending to help increase economic growth. But most governments, including Australia’s, were obsessive about balancing budgets and instead were more intent on reducing spending (the obvious exception to that was $1.2 trillion Trump tax cuts, which helps explain why the US economy was doing so much better than most others).

It’s taken the unique circumstances of the pandemic to show the power of fiscal spending to drive economic activity: low income families suddenly had enough money to go to the dentist and get the car fixed, and the money they spent doing that got spent again and again.

If governments take the lessons on board, it’s possible it could be the first step toward abandoning the flawed dictums of neoliberalism and addressing the massive wealth inequalities that lie at the heart of so many other problems we face. That would be a great silver lining.

Want to take advantage of the expected economic growth?

Call Steward Wealth today on (03) 9975 7070 to learn how.

China – big and getting bigger

China – big and getting bigger

(notes from a conference)

For fear of sounding like a real nerd, anyone even remotely interested in financial markets will appreciate how exciting it is to have an audience with three international central bankers. I got that opportunity, amongst other things, this week at the twentieth anniversary of UBS’s Greater China Conference, held in Shanghai over Monday and Tuesday.

It was my first time in China, and while suggesting Shanghai is representative of China is like saying the same thing about Sydney and Australia, I did come away with a changed impression and understanding of the country; but I’ll come back to that, first the exciting stuff.

 ‘The new normal for the global economy’

Full credit to UBS that they were able to get three rock star central bankers for this presentation: Dr Bill Dudley is the President of the New York Federal Reserve, Dr Raghuram Rajan was the 23rd Governor of the Reserve Bank of India and the former Chief Economist and Director of Research at the IMF, and Dr Min Zhu is a former Deputy Governor of the People’s Bank of China. One thing to bear in mind, however, while these guys are super smart and extraordinarily well connected, they don’t possess a working crystal ball and what they say is still a (very well informed) best guess.

Their respective views of the ‘new normal’ were extremely close to each other: an ongoing environment of slow growth, low unemployment and low inflation – in other words, no meaningful change from what we’ve experienced over much of the past 10 years. Given the similarity of their outlooks, I can only presume that, for now at least, they don’t see anything on the horizon that’s going to cause things to change much.

To me, the most interesting part of Dr Dudley’s message was his candid acknowledgement that if interest rates are as low as they are now when the next recession hits, there’s obviously not much room to cut them in order to support a recovery. While he acknowledged central banks do have other (read unconventional) tools at their disposal, such as quantitative easing, he argued monetary policy alone will not be sufficient to pull the economy out of recession and reiterated several times they will definitely need fiscal policy, so changes in government spending, to do some, if not a lot, of the heavy lifting.

That is an identical position to most central bankers, including Australia’s Dr Philip Lowe, who have collectively been saying that monetary policy is reaching the limits of what it can do and have been pleading with governments to open their wallets and spend. Dr Rajan also said that while unemployment is very low across the world, job dissatisfaction is relatively high because the quality of a lot of those jobs is poor, and this is something fiscal policy is far better placed to address than monetary policy.

Importantly, and as you’d expect, Dr Dudley also stuck with the Fed’s current script that they are in no hurry at all to raise rates, and will be happy to let inflation in the US run above its 2% target level before they increase from the current 1.75%. That sits well with the market’s current view of where interest rates are headed and is considerably more optimistic than UBS’s US Chief Economist, who spent 14 years at the Fed, and is forecasting three rate cuts this year in response to a weakening economy.

Dr Rajan gave his rundown of what he considers to be the five major influences on economies, none of which will surprise anyone:

  1. Technological innovation, which is increasing productivity but is also changing the nature of jobs that are available to those without higher education
  2. Demographics, which he sees as presenting threats and opportunities
  3. The rise of emerging nations and the need to find ways of accommodating their growth and aspirations
  4. Inequality, which underpins the rise of populist politics
  5. Climate change, which he also sees as presenting threats and opportunities.

Dr Min commented that all technological change is disruptive to the extent that it usually means an existing system is changed in favour of the new, and he pointed to the possibilities that 5G brings with the ‘internet of things’. It took China five years to reach some 3.7 billion 4G devices and it’s targeting all of those to be switched to 5G within 2.5 years, bringing with it the benefits of bigger, faster, fatter pipes of data.

He also believes that ageing demographics and the gradual reduction in the proportion of working age people across the developed world, which is baked in and cannot be changed quickly given it takes 18 years to make a worker, has helped to usher in an era of lower growth (the formula for growth is very simple, it’s the number of workers times how much they produce. If the number of workers goes down, you have to improve productivity if growth is to be sustained). While most commentators refer disparagingly to Japan’s decades of low growth as an example of what must be avoided, he argued it’s a miracle Japan has managed to grow at all give its demographic challenges, and the fact it has is testimony to what fiscal spending can achieve.

As to whether China can sustain its growth rate, he reckons the key is to improve the productivity of the services sector, which is now 52% of GDP. China’s industrial sector’s productivity is world class, but services productivity is about 30% below world’s best practice. In his view the solution is simple: open China’s market to more international service companies so they can learn from them. Interestingly, we heard from Dr Weng Mingbo, the Deputy Secretary General of the Shanghai Municipal Government, that Shanghai had issued 1600 new licences to financial services firms in 2019.

When asked about inflation, they tacitly acknowledged that, the thing is, we don’t really know what causes inflation to rise and fall; all the old models have had to be rethought, so it could very well return at any time, though each indicated they don’t see that being the case. Dr Dudley said he’d been surprised that US wages growth hadn’t been stronger given unemployment is at 50-year lows (there goes the Phillips Curve?), but he expects it will happen at some point and that could underwrite higher inflation. Dr Rajan responded that for a long time many economists argued inflation was led by expectations, that is, if people expect prices will rise it becomes a kind of self-fulfilling prophecy. But, once again, Japan was referenced as dispelling that myth and could serve as a leading indicator.

Again, all three of the central bankers agreed that inflation is more of a mystery than we’d thought, and Dr Dudley said the Fed is giving thought to changing to targeting a range of, say, 1.5-2% per annum, or an average of 2% over the a cycle. Both would be subtle but significant changes, quietly admitting central banks cannot control inflation with any level of precision (again, the Japanese example was raised where the Bank of Japan has failed to reach every inflation target it’s set itself over the past 20 years despite throwing everything but the proverbial kitchen sink at it).

One final interesting point from Dr Dudley, he reminded us that everyone tends to presume the next recession will look just like the last one, but it rarely ever does.

 The trade war

Frankly, there was less focus on the current trade war between China and the US than I’d expected. That’s not to say people were dismissive, but it certainly didn’t dominate conversations and my sense was it’s been going long enough that we’ve probably reached the point of fatigue. Several speakers, including the central bankers, mentioned the level of uncertainty created by President Trump’s unpredictability, where a random tweet could change the course of things without warning, and while we all know markets don’t like uncertainty, there comes a point where it becomes the status quo.

Those who attended last year’s conference said the Chinese message then was ‘we’ve got to work this trade war out’, whereas this year the only dedicated session, which included Madam Fu Ying, a former Vice Minister of Foreign Affairs, saw a more assertive Chinese stance. Madam Fu more or less said it’s pleasing the two governments are finding areas of agreement, as evidenced by the ‘Phase 1’ deal that’s just been signed, but if the US wants the benefits of leadership then it has to lead.

Dr Barry Naughton, Chair of Chinese Studies at the School of Global Policy and Strategy at UCLA, all but admitted the US had underestimated the ramifications of China’s rise when he used the analogy that when China was admitted into the World Trade Organization in 2001 it was like they had a pet baby tiger they could leave the kids to play with, and they’ve come back almost 20 years later to find they have a full grown tiger on their hands.

Madam Fu said the Chinese feel the US doesn’t want China to grow and the US needs to find ways to reassure them that’s not the case, meanwhile, Dr Naughton said the US feels confused because it appears China wants to supplant the US rather than work with them.

It was Dr Rajan that raised some interesting potential consequences that could arise if a resolution or compromise isn’t found: it’s conceivable there could be a split in key areas of technology where two distinct standards develop, one Chinese sponsored the other US. That potentially means countries could be forced to choose, which then becomes a question that carries both political and commercial significance, and if that’s about something as important as, say, 5G, there could be far reaching consequences. What if the US 5G standards are inferior to China’s or years behind, where does that leave a country like Australia?

 Climate change

Every presentation I listened to included references to climate change and explicit acknowledgement of the effects it’s already having, but also the necessity of addressing it and what the consequences might be from doing so. It was clear the Chinese government sees it as a really big deal, or at least they talk like they do, with climate change strategies incorporated into the government’s five-year plans.

One panel discussion included Dr Li Junfeng, the First Director General of the National Centre for Climate Change Strategy and International Cooperation, who took a reasonably pragmatic approach saying China appreciates the economic challenge of transitioning away from fossil fuels, nevertheless it has set a goal of 75% renewable energy by 2050, from about 24% currently (much of which is hydro).

In terms of practical steps China is taking, it has the most electric vehicles in the world and accounts for some 90% of global production and it’s the biggest producer of PV panels and is embracing wind power too. There were signs of the commitment to its climate change strategy around Shanghai, with lots of EV’s on the road (they don’t have to pay annual licence fees) and electric Vespa-style scooters just everywhere (I saw one, admittedly far more utilitarian in its styling than a Vespa, selling for about $300 brand new).

 Other observations

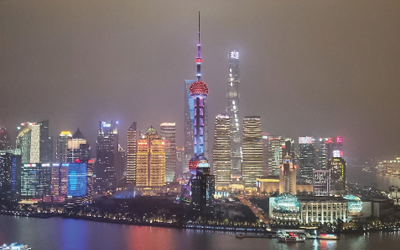
Possibly the biggest thing that struck me was the ‘can do-ness’ of China, thanks largely to the benefit of having an autocratic government that doesn’t have to worry about being re-elected. For example, the area on the far side of the river in the photo below, which is the iconic shot of the Pudong area of Shanghai, was rice fields 30 years ago. One of the delegates, who used to work in Hong Kong, told me he’d been at a conference in Shanghai around 1990 and a government official discussed their plans to turn those rice fields into a city over the following five years. He said he laughed at the suggestion, only to find five years later the area was covered in plain, rectangular skyscrapers. What you see in the photo is, in fact, the second generation of buildings on the site, and it is now Shanghai’s financial district, boasting, amongst other things, the second highest tower in the world.

China - big and getting bigger
Shanghai’s Pudong financial district – it was all rice paddies 30 years ago

While the Australian government frets about ‘picking winners’ to back, and consequently resorts to ‘letting the market decide’, the Chinese government picks industries it wants to lead the world in and backs them with the full resources of the State. Thus, years ago a struggling IT company called Huawei was picked as the Chinese 5G champion and now leads the world (yes, with all the attendant controversy). While climate change was probably the single most mentioned topic at the conference, with possibly the trade war second, the advent of 5G and the implications for tech industries would have been next.

Dr Chen, of the Shanghai Municipal Government, explained they had installed 14,000 5G stations around Shanghai in a single year, with plans to accelerate that. They had also built Tesla’s new mega-factory in 12 months and the first cars have been rolling off it recently. The next target is to establish Shanghai as one of the world’s leading financial centres, thus the 1,600 new licences mentioned before. Already, Shanghai’s stock market is the fourth biggest in the world at US$4 trillion, but Hong Kong is number five at US$3.9 trillion and Shenzhen is eighth at US$2.5 trillion. If you add them together, the Chinese markets are worth a combined US$10.4 trillion, which would put it second behind the US (which admittedly dwarfs it, for now, at US$33.7 trillion for the NASDAQ and NYSE combined).

Obviously there are dark sides to the Chinese government as well. It’s confronting not to be able to pick up your phone and Google something at will and watching the BBC or CNN news involves any story on China simply disappearing from the screen. The surveillance is frightening, and what’s happening to the Uighurs is simply appalling, and the Wall Street Journal reported this week that it estimates the Chinese government has given Huawei some US$75 billion worth of subsidies, tax breaks and benefits.

Clearly there’s no way western democratic companies can compete without significant state support as well, which involves overcoming the established neo-liberal doctrine that governments should keep out of the way of the market. No doubt this will continue to be an issue for a long time to come.

One final thing I learned: I went on a guided walk of Old Shanghai, a feature of which was seeing the 400-year-old home of Madam Goh, which was on 2,300 square metres of land. The buildings are in ruins and the government has been negotiating with Madam Goh’s family for years to buy it off them. Bear in mind, this part of Shanghai is so crowded I saw an ad to rent out 4 square metres of space for about A$265 per month! I said to the guide I’d have thought the Chinese government would have just said ‘We’re taking your land’, but she looked quite shocked at the suggestion and explained the government recognises her family owns the land and they need to compensate her accordingly. Like everything though, it’s a matter of reaching agreement as to what it’s worth.

 Conclusion

There was, of course, plenty more covered at the conference, including plenty on the financial outlook for China. Overall, I came away with a stronger conviction that China’s influence on the world is only going to grow and western companies and governments need to take notice of what can be achieved with proper government support. I’m far from starry-eyed about how that growth has been achieved in terms of the consequences for personal liberties and the environmental effects, but from a pragmatic point of view the China story is a long, long way from over.


A picture speaks a thousand words…

A picture speaks a thousand words…

Sometimes it’s easier to see things in pictures and the charts below give a basic but effective illustration of just what a purple patch most of the world’s major economies are in right now. After years of post-GFC stimulation, sweating over potential sovereign bond defaults, stressing about deflation and fretting about the risks of populist politics, basically all the charts are heading in the right direction at the moment… except maybe Australia’s.

They tell a reasonably consistent story of slow but positive GDP growth and strong consumer sentiment – what should be good conditions for financial markets.


US

A picture speaks a thousand words_chart1v2
A picture speaks a thousand words_chart3

European Union

A picture speaks a thousand words_chart4
A picture speaks a thousand words_chart5

Japan

A picture speaks a thousand words_chart6
A picture speaks a thousand words_chart7

China

A picture speaks a thousand words_chart8
A picture speaks a thousand words_chart9

Australia

A picture speaks a thousand words_chart10
A picture speaks a thousand words_chart11

UK

A picture speaks a thousand words_chart12
A picture speaks a thousand words_chart13

One thing to remember about charts: they’re great for showing where we’ve been, but they don’t necessarily tell us where we’re going.