An offset account, do I really need one?

An offset account, do I really need one?

When searching for a property loan the first thing people tend to look for is a low interest rate but getting the right features with your loan can be just as important. Most people have heard of an offset account, but do you really need one and, if so, are you getting the most out of it?

How does an offset account work?

An offset account is an everyday transaction account that you can deposit all your spare money into and is linked to your mortgage. When interest on your loan is calculated, the balance of this account is combined with your loan to ‘offset’ the amount charged. For instance, if your mortgage was $500,000 and you had a balance of $100,000 in your offset account, interest would be calculated based on a balance of $400,000. Over the life of your home loan, placing any additional savings into your offset account can significantly reduce the time taken to pay off your loan.

There are generally two types of offset account, partial and 100%, which, as the names imply, offset different proportions of the mortgage balance. Also, the majority of offset accounts are linked to variable home loans with only a small number of lenders offering this feature with a fixed rate.

Offset account vs redraw facility?

While each lender tends to label them differently, most lenders offer you the choice of loans. A ‘basic loan with a redraw facility’ allows you to make extra repayments towards your loan which you are then able to withdraw at any time. It is important to read the fine print as some redraw facilities limit the amount or frequency you are able to access these funds and some even charge a fee for the privilege.

‘Packaged loans’ generally include an offset account together with other features such as a credit card and provide more flexibility around making changes to your loan without additional cost, for example fixing your rate at a future date. This usually attracts a flat annual fee of between $200-$400 and some lenders even offer a reduced interest rate compared to their basic product.

If both an offset account and unlimited redraw facility allow you to make extra repayments, whilst maintaining access to the funds, then which one do you need?

Home loan offset accounts

If you are purchasing the property to live in, or a holiday house that you do not intend to rent out, then applying for a ‘basic’ loan with a redraw facility may be appropriate for you. It will save you any ongoing fees associated with a packaged loan and in some cases you may even receive a better rate.

An offset account becomes attractive if you prefer instant transaction access to the funds, including BPAY and EFT, rather than being limited to the terms of the redraw. This works well for people who receive higher levels of income who can pay their salary, and any commissions or bonuses, directly to the account offsetting interest whilst expenses are then periodically paid from the facility.

Remember that you generally receive a credit card with the packaged loan so cancelling your current one, and the annual fee often associated with it, could net the extra cost. A common strategy is to select a credit card that provides an interest free period on your purchases and use this to pay your everyday expenses. The credit card is then paid down in one monthly payment thus maximizing the balance of the offset account whilst not accumulating any interest on your expenses. This approach requires discipline to ensure credit card repayments are made on time and may not be for everyone.

Several lenders also offer the ability to have more than one, often up to 8-10, offset accounts linked to the same home loan. The cumulative balance of all offset accounts then acts to reduce the interest accrued. This can be a useful budgeting tool where you separate your income into different categories or ‘buckets’, helping you to save while still reducing interest and paying off your loan more quickly.

 Investment loan offset accounts

 Offset accounts attached to Investment loans are where the real benefits become apparent. Investment loans are lending for properties, or other investments, from which you draw an income usually in the form of rent. Due to the transaction capabilities of an offset account, it provides a great way to keep all your investment property-related income and expenses together in the same account.

The interest on the loan, and other related expenses, are generally tax deductible, which is one of the significant benefits of owning an investment property. If you access the extra repayments from a redraw facility, the redrawn amount is treated as a separate loan to you and would prevent you from claiming this as a tax deduction, unless you can demonstrate that you are using those funds for investment purposes. Issues can arise, for example, when you withdraw money to take the family on a holiday or buy a new car. If your extra repayments are accessed directly through an offset account, the ‘fund purpose’ test would not apply, and all interest accrued on the loan would continue to be deductible.

This benefit can be significant when you purchase a second property to move into and convert your current one to an investment. In most cases you would benefit from reducing the loan on the new owner-occupied property and maximise the investment loan for tax purposes. If you transferred extra repayments to the new loan from a redraw facility, those repayments would fail the ‘fund purpose’ test and would not be deductible. By accessing the funds from an offset account, you can therefore maximise your deductions. Its important to note that these examples can significantly vary depending on your personal circumstances and you should always consult an accountant for personal tax advice.

Finding the best rate combined with the most appropriate loan features can be a complex, time consuming task that Steward Wealth can help you with. Feel free to get in touch.

Forgot to make that super contribution? Don’t despair, you may ‘catch-up’

Forgot to make that super contribution? Don’t despair, you may ‘catch-up’

It’s not uncommon to meet prospective clients who either forgot to make a concessional super contribution the previous year, or didn’t feel it was necessary.

However, all is not lost, with a little understood strategy which, in some circumstances, allows you to make ‘catch-up’ contributions.

So what are ‘catch-up’ contributions?

The rules around catch-up, or more accurately known as ‘Carry-forward’ contributions, simply allow super fund members to use any of their unused concessional contributions cap (or limit) on a rolling basis for five years.

So, if you didn’t make the maximum concessional contributions ($25,000 in 2019/2020), you can carry forward the unused amount for up to 5 years. After 5 years, any unused concessional contributions will expire.

The first year these rules came into force and concessional contributions could be accrued from was the 2018/2019 financial year.

Why were they introduced?

The Federal Government introduced carried-forward contributions to help those who have had interrupted working lives to get more money into superannuation. Those who had time off work to have children, care for children or loved ones, or even those who previously didn’t have the financial capacity to contribute to superannuation all benefit from these rules.

Who is eligible to make carry-forward contributions?

Anyone who has a total superannuation balance under $500,000 as at 30th June in the previous financial year is eligible to make catch up contributions.

What are concessional contributions again?

Concessional contributions are those made from pre-tax dollars. It includes:

  • employer contributions of 9.5% pa of your salary
  • Salary sacrifice contributions.
  • Lump sum contributions to superannuation which you notify your superfund provided that you intend to claim a personal tax deduction.

There is an annual $25,000 limit for concessional contributions.

How does it work?

This can best be illustrated with an example.

Tina has a total superannuation balance of $300,000. After taking a couple of years leave, she returned to work in July 2019.

During the 2019/2020 financial year, Tina was eligible to carry forward her concessional contributions she didn’t make in 2018/2019, however, she chose to not make an additional contribution above her employer contributions of $10,000.

So, for the 2020/2021 year, Tina has a total of $65,000 of eligible concessional contributions. She has done particularly well from her holding in Afterpay shares and decides to sell them giving rise to a significant capital gains tax liability. Tina has a meeting with her adviser at Steward Wealth about how she may reduce this tax liability. Her adviser recommends making full use of the carry-forward provisions and advises her to make concessional contributions totaling $65,000 (including her employer contributions). Not only will she receive a tax deduction for the contribution, but she will also grow her superannuation balance.

Forgot to make that super contribution Dont despair you may catch-up

In summary

Carry-forward provisions are a real opportunity for those who haven’t been in a position to make contributions to superannuation, or who have simply forgotten to do so.

While it can assist in building up your retirement benefit, as you can see from our case study above, careful planning can also make it a very effective tax planning tool.

Superannuation can be very complex and advice really needs to be tailored to each individual. If you would like to discuss further, the Steward Wealth team are more than happy to assist you.

Want an assessment as to how this strategy could work to maximise your financial well-being?

Call Steward Wealth today on (03) 9975 7070.

Sharemarkets driven by fundamentals, not central bank liquidity

Sharemarkets driven by fundamentals, not central bank liquidity

This article appeared in the Australian Financial Review.

Last week, Seth Klarman, a US-based billionaire hedge fund manager, launched another of his many attacks on the US central bank, claiming that by treating financial markets like children the Fed has created “surreal” conditions that are detached from reality. Klarman is just one of many fund managers who complain so frequently that markets are being propped up by central bank liquidity that it has become all but accepted as a fact.

It’s a seductive narrative: the central banks are printing money, which has to go somewhere; asset prices have risen, especially in the US, so that must be where the money’s gone. However, the evidence simply doesn’t support it.

The usual culprit these critics point to is Quantitative Easing, which is typically referred to as QE. First, it helps to understand how QE works: take an investor that sells $1 million of government bonds to the Fed, which in turn pays them $1 million in cash. Even if the investor hangs on to the money instead of putting it in the bank, there’s no net change in the amount of money available to the investor. One government issued asset has been swapped for another government issued asset, and in fact, to the extent that cash doesn’t pay any yield like a bond does, the investor is slightly worse off.

The critics assert that because the central banks are buying government bonds and consequently keeping yields lower than what they otherwise would be, those freshly cashed up investors have been forced to buy riskier assets, like shares, to get the required return.

However, this overlooks two points. First, it would be highly unusual for a bond investor to switch to shares, regardless of the return, since bonds are considered a defensive asset while shares are a growth asset. Second, equity funds have been suffering net outflows for years, to the point where last October US equity funds reported more than $100 billion of outflows over the calendar year while bond and cash funds had seen $790 billion of inflows.

The three biggest central banks undertaking QE over the ten years to the end of 2019 were the Fed in the US, the European Central Bank (ECB) and the Bank of Japan (BOJ). The Fed increased its balance sheet by 178% over the decade, during which time the S&P 500 went up by 290%, so the share market went up by a factor of 1.6 compared to the balance sheet. The ECB’s balance sheet increased by 237%, but its shares only rose by 154%, so a factor of 0.6, and the BOJ’s balance sheet rose by a whopping 483%, but its shares increased by only 187%, a factor of 0.4. In other words, there is no clear relationship at all between the level of central bank activity and share market returns.

Share markets are driven by fundamentals, not central bank liquidity-table1
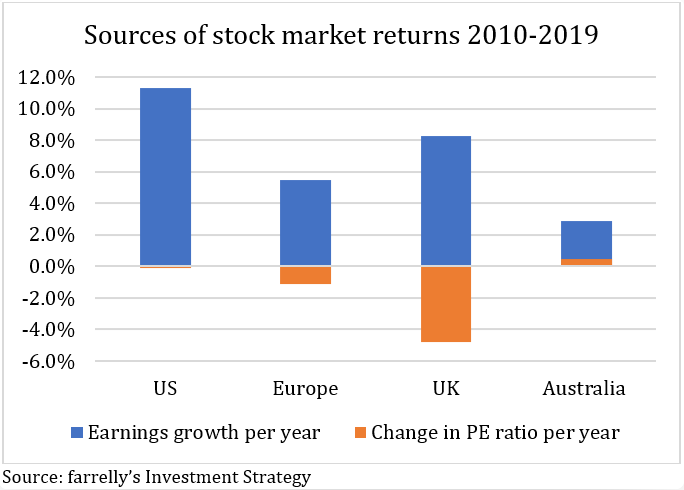
Within that ten-year period, the Fed’s balance sheet peaked at $4.5 trillion in January 2015, after which it was allowed to run off as some of the bonds it was holding matured, declining to $3.8 trillion by September 2019. If the S&P 500 was being driven by central bank liquidity it would have fallen over that period, but instead it rose by 45%. Global asset markets are enormous and share markets alone grew 90% over the same 10-year period to be worth US$70 trillion, an increase of $33 trillion, let alone the increase in property and other assets. The numbers just don’t add up to suggest that about US$9 trillion worth of central bank balance sheet expansion could be responsible for almost four times the amount of growth in just the value of shares. So what explains the rise in share markets? Quite simply, earnings growth. For example, US companies reported annualised earnings growth of 11.2% per year over the 10 years to the end of 2019, while the share index rose by 11.1%. That tiny difference is explained by the change in the price to earnings (PE) ratio, which is a measure of sentiment toward owning shares, which actually fell by 0.1% per year. If the share market had been ‘artificially propped up’ by central bank liquidity, and detached from fundamentals, it would have shown up as a much higher PE ratio. If earnings growth is the most fundamental measure of share market value, then the US could hardly have been more fundamentally driven! And that was not a one off. Europe and the UK, two other markets where central banks undertook QE, also both saw a fall in their PE ratios, while Australia, which didn’t see any QE during that period, saw its PE ratio rise.
Share markets are driven by fundamentals, not central bank liquidity-graph1

Tim Farrelly, of farrelly’s Investment Strategy, points out that, “The idea that central bank liquidity drives markets has a sliver of truth to it in that keeping interest rates a little lower than they otherwise would be assists valuations. But all the evidence suggests earnings explain much more about market returns.”

There is no doubt central bank activities have been critical to markets recovering in March this uear, but that was by unclogging the credit markets and allowing that essential corporate lifeblood to flow again.

So why does the false narrative persist? Partly because it’s intuitively appealing, but mostly because it’s repeated endlessly by fund managers looking for excuses as to why they’ve underperformed their benchmarks. It’s much easier to blame central banks for markets being detached from fundamentals, than to admit you’ve got it wrong for 10 years. The important lesson for investors is to ignore the conspiracy theories and stick to fundamentals.

Micro bubbles

Micro bubbles

After my first ride in a Tesla, climbing back into my diesel car felt very much like I’d gone back in time – noisy, slow, and those fiendish fumes coming out of the exhaust. I only know a few Tesla owners, but they all swear by them and claim they will never go back to an internal combustion driven car.

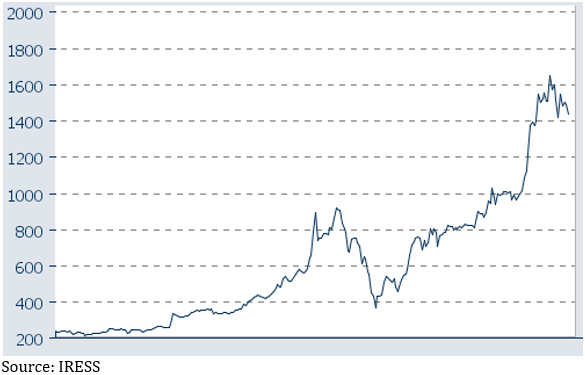
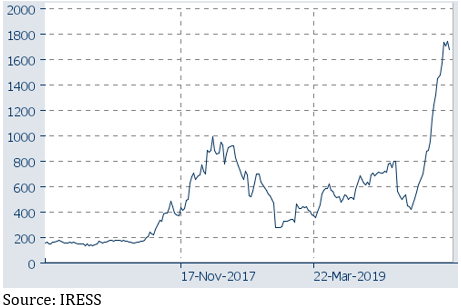
I don’t think there’s any doubt Tesla is at the forefront of an inexorable change in the auto industry, and that we are on the way to a car market dominated by electric vehicles. What I am far less certain about, is whether the seven-fold increase in the share price over the past nine months, which includes a 50% jump in the past five weeks, makes sense.

Chart 1: Tesla’s share price has risen 7x in 9 months
Micro bubbles image1

I make absolutely no claim to any expertise about Tesla as an investment, and if you own the shares I’m sure as hell not suggesting you should sell them. What I am wary about, though, is that there are pockets of the share market, in particular the tech-heavy NASDAQ index, that appear stretched at the moment, to the point where you could say they have the whiff of bubble about them. To be clear, by no means the whole of the market – it’s like there are micro bubbles.

I certainly don’t think it’s reminiscent of the dotcom bubble that popped so spectacularly in early 2000, when the NASDAQ index fell 78% between March 2000 and October 2002, the biggest tech companies are reporting phenomenal earnings and sales growth that are clearly backing their astonishing performance. However, there’s no shortage of bears among the commentariat, and I recently listened to a conversation between two US-based bloggers whom I respect, because they are generally level headed and not prone to hyperbole, where they straight up called the book going on in parts of the NASDAQ a bubble,

Here are a few of the things that have caught my eye:

  • In the US there are a few online trading firms that charge zero brokerage, and they have apparently ignited a retail (as in private investors) trading boom. In its earnings report last week, TD Ameritrade reported average client trades per day had risen to 3.4 million during the June quarter, a 65% increase on the March quarter, and more than three times higher than a year ago. Its top 15 trading days had all happened in the June quarter and 10 of those were in the month of June.
  • Probably the best known of the free trading platforms is Robinhood. It has gone from 1 million users in 2016 to now 10 million, more than half of all accounts are opened by first time investors and its median customer age is 31. It too has seen trading activity triple in 12 months, with reports abounding about young investors punting their COVID stimulus cheques, and others drawn to the stock market through boredom because casinos were closed and sports betting has all but stopped.
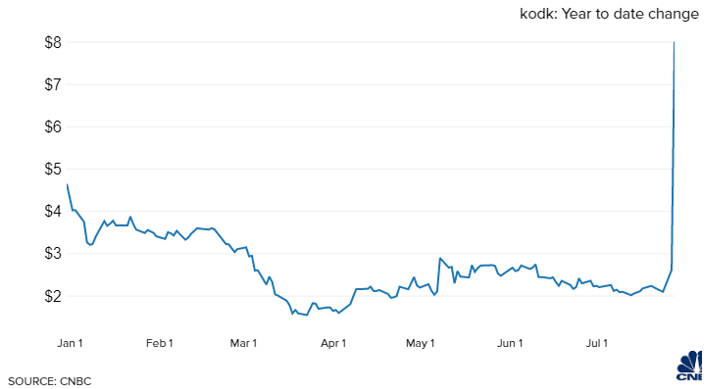
  • Robinhood investors are becoming recognised for chasing fads. A recent example is Eastman Kodak, which announced it had been given a $765 million loan from the government to produce pharmaceutical components, and 60,000 account holders bought into the stock on a single day in which the price soared as much as 500%, having already risen 200% the day before. The shares were up 1,430% over the week.
Chart 2: Shares in Kodak jumped more than 1,400% in a week after Robinhood investors piled in
Micro bubbles image2
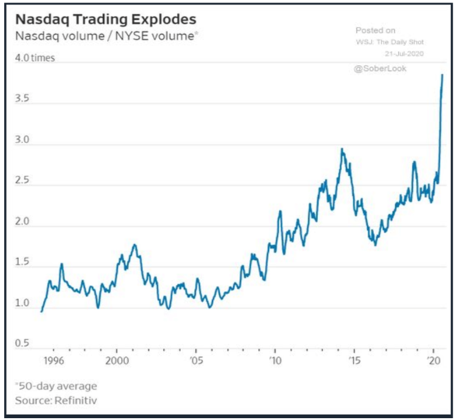
  • As an indicator of the level of retail trading activity, trading volumes on the NASDAQ compared to the New York Stock Exchange (NYSE) have recently rocketed.
Chart 3: trading volumes on the NASDAQ compared to the NYSE have rocketed
Micro bubbles image3
  • Michael Batnick, one of those US bloggers, points out there are 170 names in the Russell 1000 index that are up by 100% or more from their March bottom. Some of those include:

Wayfair, 835%
Tesla, 326%
Wendy’s, 211%
Docusign, 194%
Zillow, 165%
Chipotle, 144%
Roku, 140%
Beyond Meat, 140%
GrubHub, 130%
Zoom, 124%

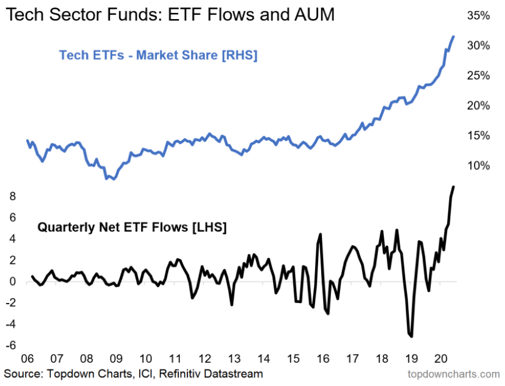
  • It’s not all just retail investors punting individual stocks, inflows to tech sector ETFs and managed funds has also exploded higher:
Chart 4: tech ETFs and managed funds are seeing huge inflows as well
Micro bubbles image4
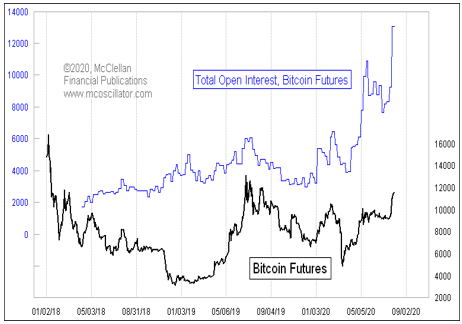
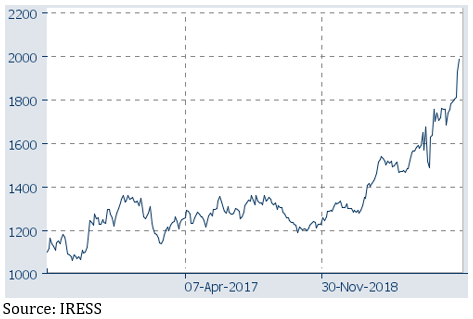
  • There are other assets that have been associated with speculative bubbles in the past that are once again attracting punters, such as Bitcoin and gold, which has just hit a new all-time high.
Chart 5: Bitcoin futures have attracted speculators
Micro bubbles image5
Chart 6: gold has just hit a new all-time high (in US$)
Micro bubbles image6
  • Another favourite US blogger of mine, Josh Brown, recently pointed to the re-emergence of Special Purpose Acquisition Companies (SPACs) as a sign of a bubble, or, as he put it, an excess of credulity on the part of investors. A SPAC is where investors hand over money to someone who promises to invest it in an acquisition, but there are no details whatsoever of what they’ll buy, or when. It’s pretty much investing on a wing and a prayer. Just recently one SPAC attracted US$4 billion.
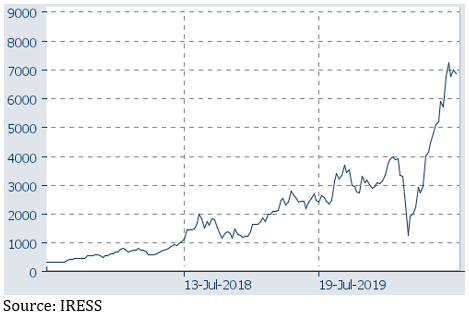
  • Australia, of course, doesn’t have anything like the number of tech companies, but there have been some eye-popping rises among the few we do have. For example, Afterpay has risen 125% so far this calendar year, and Kogan is up 120%. Yes, I get there are strong reasons as to why, and I agree a company like Afterpay looks set to grow its international user base numbers enormously, it’s just how far forward is it reasonable to drag earnings?
Chart 7: Afterpay has risen 125% so far in 2020 alone
Micro bubbles image7
Chart 8: Kogan is up to 120% in 2020
Micro bubbles image8

To reiterate, I don’t include the five tech giants, Facebook, Apple, Microsoft, Amazon and Google, in this. While there is growing consternation that they represent an historically high proportion of the S&P 500 at 22%, they also represent 18% of total earnings, and their earnings are growing way faster than the rest of the market. So while they have seen spectacular rises since the March correction, it is, I believe, much easier to rationalise, especially in an environment of super low interest rates.

I also readily concede the basis of the US dotcom boom of 1999-2000, that the internet would be transformative of how we live and do business, was dead right, it was just wrong about how they should be valued and retail investors ended up getting carried away – and then carted out backwards. This time around it’s again entirely possible the market is right about the impact of electric vehicles, small pharmaceutical companies and other online business models, it’s again a question of what valuation you put on them now, and there are signs some retail investors are once again getting carried away.

As unusual or extreme some of the above stories and examples might be, the thing about a bubble is it can go up a lot higher, and last for a lot longer, than you would ever think possible. Alan Greenspan, who at the time was the Chairman of the US Federal Reserve (their central bank), famously referred to the ‘irrational exuberance’ of the stock market in November 1996, more than three years before it peaked. It’s entirely possible if there is a correction it’s confined to a specific part of the market, leaving the rest of it largely unaffected.

As I said, this is not a suggestion to sell your tech shares, but it is a recommendation to be very careful.