Addressing inequality would be good for the whole economy

Addressing inequality would be good for the whole economy

Inequality of incomes and wealth continues to be a well-deserved point of focus across the developed world. The US produces the best data, and by 2016 the top 1% of households held 29% of the country’s wealth, while the entire middle class owned 21% and real median income has fallen over the past 40 years. This inequality of wealth and income is actually reducing growth for the overall economy.

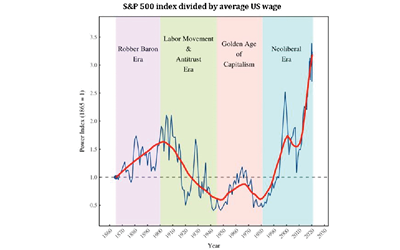
The chart below uses a simple, but insightful, method to argue inequality really took root under the ‘neo-liberal’ economic era. If it’s correct, that premise throws up some suggestions as to how it can be addressed.

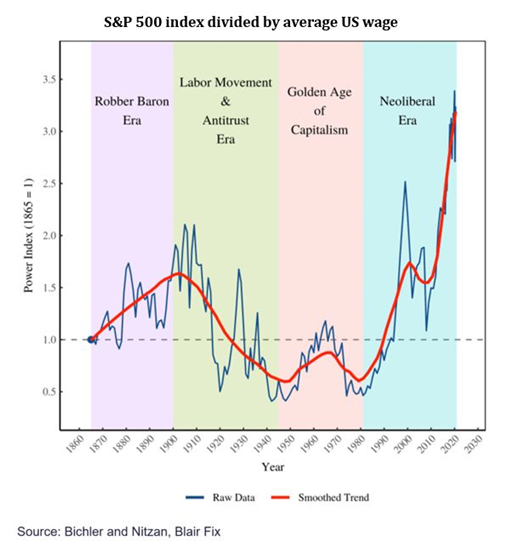
First, what is the chart telling us? It effectively traces the relative strength of labour versus capital. When the line is trending upwards, share prices, as measured by the US’s S&P 500, are rising faster than the average wage. That means there is a greater share of the economic pie going to the owners of capital than to labour.

After WW2 the US became the world’s factory and there was a relative scarcity of workers, so wages were strong. The next bottom in the chart, around the 1970s, was when unions were throwing their weight around and the US and UK lost a record number of days to strikes. Wages were commonly indexed to inflation, which created the classic wage-price spiral: as wages rose, so did prices, which again caused wages to rise, and so on.

Then came the era of Thatcher and Reagan, and the wholehearted embrace of neo-liberalism. This philosophy, which was largely founded on the work of Milton Friedman, argued markets are best at determining the allocation of resources so the best thing governments can do is get out of their way. It coincided with the crushing of unions, and the highest interest rates ever recorded as central banks around the world followed the US Fed Chairman, Paul Volcker, in his efforts to stomp out inflation.

Neo-liberalism is also called ‘supply side economics’, the premise of which is that reducing regulation and government interference would enable markets to flourish and encourage economic growth, and the benefits of all that growth would trickle down and be shared broadly. Indeed, Paul Volcker predicted that “wages for all Americans will improve as we achieve greater productivity and moderation in the demand for nominal wage increases.”

Well, that hasn’t happened. In his terrific book, The Economists’ Hour, Binymain Applebaum writes that “the median income of a full-time male worker in 1978, adjusted for inflation, was $54,392. That number was not matched or exceeded at any point in the next four decades. As of 2017, the most recent available data, the median income of a full-time male worker was $52,146. Yet, over those same four decades, the nation’s annual economic output, adjusted for inflation, roughly tripled.”

Likewise, economist Thomas Piketty argues that, in fact, the whole of the US is worse off under the neo-liberal model: between 1910-1950 national income per capita grew at 2.1% per year, from 1950-1990 it was 2.2%, and 1990-2020 only 1.1%.

In other words, as income and wealth inequality has worsened, so too has overall economic prosperity.

The solution? On the face of it, economies would be collectively better off if there was some equalisation of power between labour and capital. It also suggests there is indeed a role for government in areas like regulating labour markets and controlling corporate power.

Beware of experts on yesterday

Beware of experts on yesterday

This article appeared in the Australian Financial Review.

The amazing events of 2020 have been a great reminder that no two share market cycles are the same. The word ‘unprecedented’ has come to be all but worn out, whether it’s to describe the worldwide sell off in February and March, or the rebound in April and May, or the level of government and central bank support doled out along the way.

One thing that doesn”t change, however, is there is no shortage of experts competing to use history as a guide to explain why things just don’t make sense right now or will all end badly. Whether it be warnigns that valuations are too high, share markets are too reliant on a handful of companies, or market signals are being confused by central banks and governments, smart investors need to be wary of what have been called “experts on an earlier version of the world.”

Of course, there are some rules of investing that will always apply, but you also need to allow that markets are a constantly shifting mix of factors. Like ingredients in a recipe, if they are mixed in different proportions, you’ve got a whole new dish on your hands. Some new factor can seem to come out of nowhere and exert such profound influence that it all but squashes the last big trend into insignificance.

Take, for example, the common warning that share markets are expensive based on current price to earnings (PE) ratios compared to long-term historical averages. The price you pay for a share divided by how much that share will earn next year gives you a basic measure of how expensive it is: the higher the number the higher the valuation.

Based on earnings forecasts for the next 12 months, global shares are trading on a PE of 21, versus a 32-year average of 16. Likewise, Australian shares are on 18 versus 14, and the US is 23 vs 16. Nobody likes paying too much for something, and it can take years to recover from overpaying for investments.

However, it’s long been accepted that low inflation is supportive of higher PE ratios, and right now, inflation is much, much lower than it has been over the last 38 years. In fact, inflation and interest rates peaked around 1980 and have been in decline ever since. So it makes perfect sense that PE ratios would be higher now than they were over that long-term average.

 One of the most commonly used techniques to value a company’s share is to do a discounted cash flow, or DCF, valuation. To do that you apply a ‘discount rate’, which is usually based on bond yields, against forecast earnings to see what they’re worth in today’s dollars. The lower your discount rate, the higher will be the present value of those future earnings and thus the higher the share’s valuation.

Right now, 10-year bond yields across the world are about the lowest they’ve ever been. So, again, it makes sense that valuations are higher today than they would have been at any time over the past 40 years.

What about those over-stretched US tech companies we keep hearing about? Again, the comparison needs to be kept in context. Once upon a time the market was dominated by companies whose costs went up in proportion with their sales. Industrial companies required bigger factories, supply chains and distribution networks to sell more widgets.

But now some technology-based businesses can expand their sales enormously without their costs increasing at all. That means the return on equity, which is a basic measure of profitability, for those businesses can be exponentially higher than their industrial counterparts, so it makes sense they will trade on vastly different metrics.

The problem here is an investor with a forty year career of investing in stocks with low PEs, because that’s what worked best for the previous 40 years, will understandably struggle to accept those high PEs are anything but an aberration from sensible valuations. Such an investor is almost undoubtedly an expert in an earlier version of the world.

They would never have bought Amazon shares five years ago when they were on a PE of 741, yet over that period the shares have risen more than six-fold and are still on a PE of 119. Evidently, when it comes to a company like this, a PE ratio is not the right valuation measure to use, and it’s ridiculous to argue the market has got it wrong for five years.

That doesn’t mean those investors won’t make money, it’s just that they’re unlikely to make as much money in today’s version of the world. With bond yields so low, an investment that offers apparently huge scope for growth with high profits becomes extremely attractive.

2020 will be remembered as an extraordinary year, with lessons for both the short and long term. The short-term lesson is just how difficult it is to second guess the market. No matter how certain we might be that something doesn’t make sense, Mr Market really doesn’t care what you think. The long-term lesson is that structural shifts in markets, like inflation and interest rates grinding lower and lower, can be hard to see while they’re happening, but the effects on markets can be profound.

While it’s smart to take on board the lessons from each cycle, we’ve seen time and time again it’s not so smart to presume history will simply repeat itself.

The 2020 Federal Budget

The 2020 Federal Budget

 The 2020 Federal Budget (postponed from May), has been characterised by spending and bringing forward tax cuts to get the economy moving again. Make no mistake, the numbers are big! However, COVID has been seen as a great a threat to the global economy has faced in a very long time (many suggest since The Great Depression), and so requires equally strong and unprecedented measures.

The Treasurer, Josh Freydenberg has said that once the economy recovers and unemployment falls comfortably below 6%, he will then look to tackle the deficit. This is forecast to be in 2023-2024.

Unlike other budgets where we find major changes to superannuation requiring more strategic assessment and planning, this budget is relatively straight forward.

  • Personal tax cuts have been brought forward 2 years. This means many of you earning over $50,000 pa will have at least an additional $41 per week in your pockets. This will be back dated to 1st July 2020.
  • Further support for pensioners, low income earners and job seekers. This includes two cash payments and incentives for employers to hire unemployed workers.
  • Making it easier to choose a super fund. There will be an interactive online comparison to assist you in making a decision on where to invest your super, as well as making it easier to have your new employer contribute to your existing fund.
  • First home buyer purchase caps lifted to assist an additional 10,000 first home buyers.
  • Business tax changes for small business including immediate tax write-off, and applying tax losses from 2019 – 2022 against previously taxed profits.
  • Increased business investment with $1.3bn for initiatives in ‘modern manufacturing’ and $5.7bn for new and accelerated infrastructure projects.

 The attached article provides a comprehensive summary from Westpac Economics.

Massive international tax scam

Massive international tax scam

The ACCC recently told Google and Facebook they have to negotiate with Australian media sources to effectively pay them for their news. This has sparked a furious response from both companies because they are conscious governments all over the world are watching very carefully, and if they give in to Australia it could well open the proverbial floodgates – much like the fight over plain paper packaging for cigarettes.

As well as sucking a huge amount of advertising revenue out of domestic media franchises, these transnational companies are renowned for utilising every legal loophole they can to avoid paying tax, especially the tactic of attributing revenue to low tax, offshore locations like Ireland, the Netherlands or Cayman Islands.

According to Neil Chenoweth of the AFR, Google’s CY2019 Australian ‘customer receipts’ were reported as $5.2 billion, but ‘revenue’ was $1.2 billion, so $4 billion of sales made in this country were somehow attributed to offshore offices.

Google reported pre-tax earnings of $134 million and ended up paying tax of $49 million. Chenoweth writes that if its Australian division is as profitable as the rest of the company’s non-US businesses, pre-tax earnings would have been $2.2 billion, which means Australian tax should have been more like $660 million, or 13 times more than what it paid.

Facebook reported CY2019 Australian revenue of $167 million and paid tax of $14 million. Chenoweth calculates revenue was probably more like $2.2 billion. Again, using average non-US earnings rates, pre-tax profit should have been $1.1 billion, which should have resulted in tax of $330 million, or 24 times more than what it paid.

Massive international tax scam

Michael West compiles an annual list of the worst tax dodging companies, and interestingly neither Google nor Facebook make the top 40.

These are but two example of what is a farcical international tax regime. A classic example of just because it’s legal doesn’t mean it’s right.

P.S. For anyone curious about the ramifications of social media, The Social Dilemma on Netflix is an interesting take on it.

The risks of relying on dividends

The risks of relying on dividends

John D. Rockefeller, once the world’s wealthiest man, claimed that nothing gave him more pleasure than watching his dividends come in. Many Australian investors feel the same, giving rise to a popular strategy of investing in companies that pay high dividends that will hopefully fund the cost of living while preserving the underlying capital – that way you hopefully don’t outlive your savings.

While it seems like a conservative approach, the upheaval caused by the COVID19 lockdown has exposed the multiple risks of this strategy and should prompt those investors to consider the benefits of a different way of looking at how a portfolio can fund your lifestyle.

Reduced dividends = a pay cut

Leading Australian small cap fund manager, Ophir Asset Management, quotes research by MST Marquee that between the start of February and the end of April, Australian dividend forecasts suffered a 16% cut, the biggest in the world.

The risks of relying on dividends_image1

But there could be more to come. Will Baylis, a portfolio manager with equity income specialist Legg Mason Martin Currie, says the dividend forecasts published by stockbroking analysts have yet to fully account for the effect that slashed company earnings will have on dividends, with their own internal forecasts being more like a fall of 25% this year.

Risk #1: the wrong kind of stocks

Investing in high yielding shares can be a fabulous strategy, because not only have Australian dividends been relatively generous, but historically they’ve been reliable and consistent – if you pick the right ones. Baylis points out that dividends have grown at 3.9% per annum over the 10 years to the end of March this year, while over the same period term deposit rates have fallen by 17% per year.

The problem is that by just focusing on the dividend, rather than the whole story, many investors end up with shareholdings that destroy capital. The classic example of this is the major banks, which Australian investors have had a long love for, but which face some potentially strong headwinds, something I warned about last year.

If you’d invested $100,000 into each of the big four banks at the start of 2010 you’d have seen an overall return of 5.7% per year (including franking), but if you’d used all the dividends to fund your cost of living, you’d have had less than $320,000 of capital left by the end of April this year. The only bank to have delivered an increase in price was the Commonwealth Bank, by 14% (a measly compounded return of 1.3% per annum), the share prices of the other three banks fell by an average of 33%. Indeed, you may be surprised to know that at the end of February, so before the banks were hit by the COVID19 selloff, ANZ’s and Westpac’s prices were the same as they were 14 years ago, and NAB’s was the same as 20 years ago!

An alternative income strategy has been infrastructure, property and utilities shares, otherwise known as ‘real assets’, which generally have steady, predictable income streams and assets that are leveraged to a growing population. A simple portfolio invested equally between Transurban, Sydney Airport, Spark and the Vanguard Australian Property ETF over the same period would have seen your capital double, and a total average annual return of more than 10%.

A far better strategy is to focus on the total return from an investment, that is, dividends plus capital. CSL might be an extreme example, given how well it’s done, but those shares have always traded on a relatively paltry yield of 1-2%, but over that same 10-plus year period the total return was a phenomenal 25% per year, 94% of which was capital growth.  

Risk #2: a lack of diversification

You might think investing entirely in high yielding, blue chip Australian shares is a conservative strategy, but there is no doubt, that is a high risk portfolio: the Australian share market has suffered falls of as much as 38% in a year, hardly conservative.

The best way to reduce risk in a portfolio is to make sure it’s diversified across a range of asset classes and geographies, a process called asset allocation, a basic principle of which is that different countries will perform differently over the same time frame. For example, over the 10 years to the end of March, US shares have delivered returns of 16% per year, more than double Australia’s.

Returns like that also put paid to the preoccupation some Australian investors have with capturing franking credits. It’s essential to focus on the bottom line: NAB’s dividends have been fully franked, but you’d have lost a whopping 38% of your capital over the past 10 years.  

Also, you can cast your view beyond just shares. For example, investing in corporate bonds from across the globe offers a vast range of risk and return, some of which can be more predictable and, if managed correctly, less volatile than shares.

Take a dividend from your whole portfolio

Focusing on a total return strategy, rather than an income-oriented one, does require a slightly different mindset: rather than living off the dividends generated by your portfolio, you need to look at it as paying yourself a dividend from your overall portfolio, which can be funded through a combination of income and capital growth.

That might involve setting a certain dollar amount you harvest from your portfolio each year, or a percentage. Either way, it means you’ll need to rebalance your portfolio from time to time, a small and very healthy price to pay for heeding the COVID19 wake up call.