It’s time to reassess your love affair with the big banks

It’s time to reassess your love affair with the big banks

Australian investors love two things: property and banks. And why not, the returns from both have been spectacular over the last 30 years. Which is no coincidence, given the more money people borrowed to buy property, the better the banks did. But just as there are now strong arguments to be careful about investing in property, so too, there are plenty of questions hanging over the banks as profits get squeezed between falling revenues and rising costs and valuations are challenging.

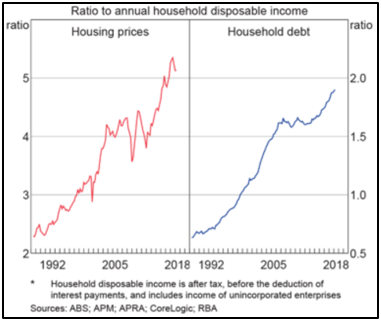
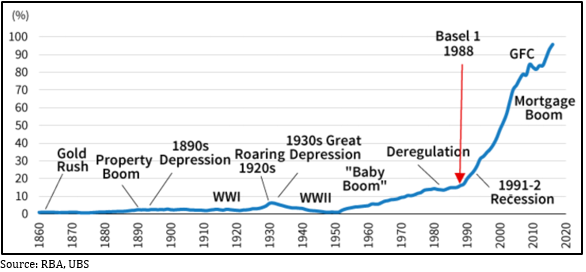
 The mutually beneficial relationship between Australia’s four big banks and the residential housing sector really kicked into gear in 1988, when the first Basel banking accord halved the amount of capital banks had to keep on their balance sheets against residential mortgages. Getting the same return on half the capital meant profitability doubled overnight, and not long after, Australian banks boasted the best Returns on Equity (a measure of profitability) in the developed world.

This rescued the banks after they’d suffered one of their worst periods in history, lending too much money in the 1980s to wheeler-dealers like Alan Bond and Christopher Skase. Given the higher profitability, not surprisingly, the banks did everything they could to push more and more debt into Australian households over the ensuing 30 years, which in turn fuelled house prices and saw home lending go from about one-third of the banks’ loan books, to now closer to two-thirds. It was a cycle that self-perpetuated: as property buyers borrowed more money, house prices went up and the banks made more money, and the banks’ shareholders made more money.

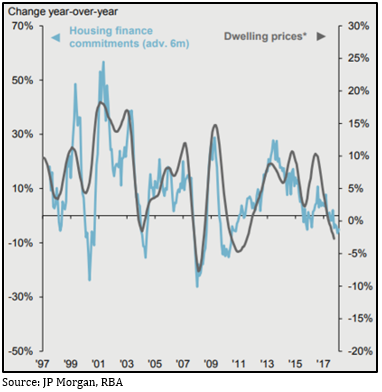
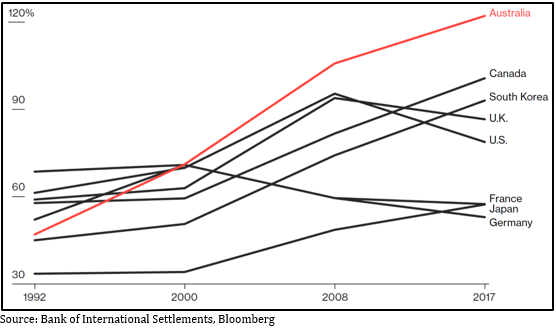
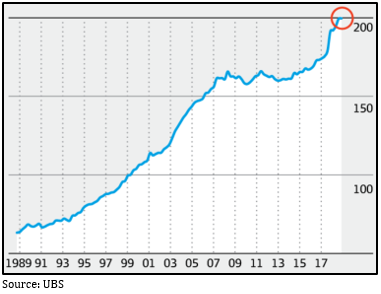
Banks do best when demand for loans is high, but in August year on year credit growth dropped to 2.9%, the lowest since the data started being recorded in 1976. That’s despite interest rates having fallen to their lowest ever and both the regulator and the government doing their utmost to encourage people to borrow. With mortgage debt having doubled in the 10 years to early 2019, Australian households are up to their proverbial eyeballs in debt, in fact we have the second highest level of household debt to GDP in the world at 120%. For context, the average for developed countries is 72%, and in the US it peaked in 2007 just before the GFC at 99% (it’s now 76%), Ireland peaked at 117% (it’s now 44%) and Spain at 85% (it’s now 60%).

In short, there’s just not a whole lot of room for residential mortgage debt to grow anything like what it has over the past 30 years.

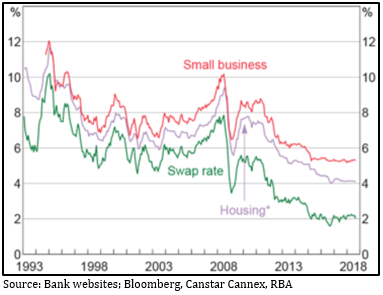
Low interest rates are also hurting the banks. Over the past 20 years Net Interest Margins (NIM), which are essentially the after-costs difference between what banks charge borrowers versus what they pay depositors, have dropped by more than a third from 3.3% to 2.1%. Deposit rates are already very low (a quarter of Commonwealth Bank’s deposits are receiving 0.25% or less!), but banks are reluctant to reduce them much further because they’re dependent on deposits for a big part of their capital backing. That means the banks find themselves squeezed between the rock of eating into their margins whenever they cut mortgage rates, and the hard place of enormous government pressure to pass on the full RBA rate cuts.

Scott Olsson, the banking analyst at fund manager Firetrail Investments, points out that other revenue lines for the banks are under pressure as well. “The banks customarily invest their non-interest-bearing liabilities, which is about 15% of their asset base, in three and five-year bonds, the yields for which have fallen about 70% in the past 18 months.”

He also points out that about 25% of bank revenues are from fees and charges, and they’ve been under enormous scrutiny from the likes of the Hayne Royal Commission into banking misconduct. “Over the past 18 months CBA has cut about $400 million from that revenue line, and while the others haven’t been as transparent, the boards are certainly reacting to the regulatory pressure. We know Ross McEwan, the new NAB boss, cut fee revenue hard when he arrived at the Bank of Scotland and he may do that again, which would just increase the pressure on all the banks.”

Bank profits have also been flattered over the past 5 years by bad and doubtful debt charges running at 0.10-0.15% of total loans, compared to an average of 0.25% over the whole of the business cycle. That means at some point they will have to run significantly higher to hit that average, and Olsson estimates if CBA’s charge doubles, profits would fall about 10%.

The costs side of the ledger isn’t doing the banks any favours either. They’re all talking about having to slash costs, but as the old investment adage goes, it’s an unusual company that can cut its way to prosperity. Add to that the demand for increased IT spend, remediation costs for their wealth management divisions of more than $8 billion (so far) and the potential for regulators to require increased capital, and those tighter revenue lines are getting spread thinner and thinner.

As much as the banks hate cutting their dividends, those added demands on revenue have left them with little choice, and there could be more to come. ANZ cut its dividend in 2016, and earlier this year NAB cut its interim dividend by 16% to its lowest level in nine years. At its August result CBA had to increase its dividend payout ratio to maintain its dividend, and Westpac just announced a 15% cut in its final dividend with its result, together with a discounted capital raising to meet the regulator’s requirement of an ‘unquestionably strong’ level of tier 1 capital.

Margin and revenue pressures have translated into declining Returns on Equity (ROE). According to APRA, the banking regulator, only 10 years ago ROE for the four major banks was 20%, but by the end of June this year it was 11%.

Despite that, Australian banks are among the most expensive in the world on two of the most common bank valuation measures: price to book value and the price to earnings (PE) ratio. The big four banks are currently trading at an average of 1.6 times book value, which puts them bang on double the UK banks at 0.8 times.

Australian banks are currently trading on a ‘forward PE ratio’, so how much you’re paying for the coming year’s earnings, of 13.7, a 16% discount to the overall market. The table below shows just how expensive that is compared to the rest of the world, where the global banks’ PE of 9.5 is 30% cheaper than Australia’s and sits at a 40% discount to the market.

It’s time to reassess your love affair with the big banks_chart1

 And the chart below also shows that, while Australian banks’ PEs have traded at a premium to their global peers for most of the last 10 years, it’s reached a new plateau. It’s a level that seems too rich for overseas investors, as Copley Fund Research recently reported that 91% of the foreign investors they survey have zero weighting to Australian banks, the lowest on record.

It’s time to reassess your love affair with the big banks_chart2

Australian investors have long loved their banks, but as Damien Hennessy, principal of Heuristic Investment Systems, points out “While it’s understandable local investors are attracted to the relatively high dividends, they need to be aware that Australian banks are expensive in both absolute and relative terms.” That doesn’t have to mean not holding any banks at all, it simply means be mindful of how much you do hold.

It’s still not time to buy a residential investment property  in Melbourne or Sydney

It’s still not time to buy a residential investment property in Melbourne or Sydney

After nothing but negative headlines for months, since the re-election of the Liberal government there’s been a sharp about-face for the Australian property market. In quick succession the risk of doing away with negative gearing and halving the capital gains discount rate vanished, then the Reserve Bank governor flagged lower interest rates and then the banking regulator lowered the qualifying hurdle for borrowers.

So you’d think it should be happy days for potential property investors: saddle up and back to the races! Not so fast.

If you take the time to think things through, there are still plenty of warning signs, especially for those looking to buy a residential investment property in Melbourne or Sydney.

 Speculating is not investing

CoreLogic reports the average gross rental yield for residential houses in Melbourne and Sydney is 3.6%. But to work out if that’s a good investment you have to deduct all your expenses to arrive at a net yield: that includes income tax, agent commission, land tax, body corporate fees, insurance, maintenance costs, and what have you. When we work out a client’s net yield it’s typically between zero and one percent.

By contrast, a six-month, government guaranteed term deposit currently pays you 2.5% gross. For someone on a 37% tax rate that’s 1.6% net, with no other costs to worry about.

When an asset is yielding less than what’s called the ‘risk free rate’ (and you don’t get much more risk-free than government guaranteed), the only way you can justify investing in it is making a capital gain, and, by definition, that makes it a speculative asset.

Compare assets

Commercial property on the east coast yields about 5.5% – that’s a 50% premium to the residential average. Don’t fall into the trap of saying, ‘but commercial property prices don’t go up as fast as residential’, remember we’re talking about investing here, not speculating.

The other classic growth asset is, of course, shares, and the most common valuation measure for shares is the price to earnings (PE) ratio, which is simply the price you pay divided by the net earnings you receive. At the moment the ASX200 is on a PE of 16.5, but for a rental property with a net yield of 1% that’s a PE of 100!

The only way you can explain that difference is debt, which always lies at the heart of every property boom, and that’s where the Australian residential property market looks really risky.

Too much debt

According to the Bank of International Settlements, at 120%, the ratio of Australia’s household debt to GDP is second only to Switzerland’s and compares to the average for developed economies of 72%. For context, to look at three other recent debt-driven housing booms, the same ratio for the US at the peak of its pre-GFC property boom was 99% (it’s now 76%), Ireland’s was 117% (now 44%), and Spain’s was 85% (now 60%).

The Reserve Bank reports Australian household debt to disposable income is now 190%, up from 160% in 2012 (and about 110% 20 years ago), yet only 37% of homes have a mortgage! Underlying that, in Sydney and Melbourne the loan to income multiple went from the old rule of thumb of three times, to now about six.

Again, for some perspective, Sydney’s house prices rose 80% between 2012 and the 2017 peak and Melbourne’s went up by 56%. By comparison, US house prices rose 78% over the five years to their peak in 2006, Ireland’s prices went up 100% in three years and Spain’s by 50% in four years. Now, about 18 months after they peaked, Sydney property prices are down 15% and Melbourne’s by 11%. From their peak to trough US prices fell 34%, Ireland’s 55% and Spain’s 35% and the average time from top to bottom was just short of six years.

Banks and incentives

To understand what’s going on in the housing market it helps to understand how we got here.

In 1988 the first Basel banking accord was released, which halved the capital banks had to keep on their balance sheet against residential mortgages. That meant the banks’ Return on Equity, or profitability, doubled overnight.

[Explainer: if a bank has to retain $20,000 of capital on its balance sheet against a $100,000 loan, on which it charges an interest rate of 5% per annum, its return on equity (ROE) is $5,000 (interest) on $20,000 (capital), so 25%. If the capital buffer is halved, it’s $5,000 on $10,000, so 50%. Bingo, the ROE doubles overnight.]

The Australian banks, coming off an existential crisis after over-lending to the ‘80s entrepreneurs like Bond and Skase, jumped on this newfound source of profitability so enthusiastically that our so-called ‘commercial banks’ have swung from housing being one-third of their loan books to now being two-thirds. That has required a 30 year, industrial scale campaign of shoving as much debt as they can into the sector, aided by tailwinds of declining interest rates, tweaking the tenure of loans from 20 years, to 25 and now 30, and the rocket fuel of interest only loans.

Why did they do that? Because it kept their profits high.

And the upshot? Over the last 10 years mortgage debt has grown at 7% per annum, while real wage growth has been 2.5%. In Melbourne, between 1960 to 1988 the multiple of average wages required to buy the median-priced home went from 2.8 to 3.9; but then between 1988 to 2018 it went from 3.9 to 10.3!

More debt in an over-indebted sector

The cheerleaders for the property market are back in force, but their assertion we’ve seen the bottom in house price declines is based entirely on more debt being taken on. That response is very much level one, or kneejerk, thinking: just because you’re able to buy a house doesn’t make it good value.

Clearly the Reserve Bank is worried about the effects of falling house prices on the broader economy: an Assistant Governor gave a speech chastising the banks for being ‘stingy’, they leaned on APRA to quietly reopen the interest only lending taps just before Christmas last year, they’re openly flagging lower interest rates and APRA’s eased up on the lending benchmarks the banks have to use. Every one of those actions is designed to throw more debt into an already over-indebted sector.

The cries of relief that negative gearing won’t be abolished also breaks another rule of sound investing: you never invest in an asset based on tax breaks. It should always stand on its own feet.

After 30 years of debt-fuelled rising property prices, the ‘anchoring bias’, where peoples’ expectations are shaped by past experience, will be hard to shake. But behavioural economics tells us as investors, our best decisions are made when you engage second-level thinking and look beyond your biases.

Some extra facts

* Debt-driven housing markets: have a good look at this chart and then ask yourself how it is Australian house prices could have gone up by so much more than per capita income. The answer is more and more debt. 

It’s still not time to buy a residential investment property in Melbourne or Sydney_chart1

*Dramatic fall in foreign buyers: Foreign Investment Review Board approvals of foreign residential real estate purchases for 2018 were one quarter of what they were in 2016.

It’s still not time to buy a residential investment property in Melbourne or Sydney_chart2

*The crane index: Per Ashley Owen of Stanford Brown – In April 2019 there were 735 high rise cranes on the skylines of Australian cities, which was more than the whole of the USA. 72% of these cranes were for residential units, so the RBA’s long hoped for shift from residential to commercial and infrastructure had not happened. The last time one country dominated the world crane market was Dubai in 2010 and that ended in Dubai’s dramatic collapse and bailout. House prices in Dubai are still lower now than they were 10 years ago – and that’s before inflation.

*An increase in supply: in February, Core Logic reported there were more houses up for sale than at any time since 2012. With 115,000 houses listed across the country, it was 15% higher than the same time in 2018.

*Mortgage stress on the rise: in March 2019 S&P said the number of borrowers more than three months behind on their mortgage repayments doubled over the last decade, a sign of a “persistent rise” in the severity of home loan arrears. About 60 per cent of borrowers overdue in repayments are currently overdue by more than three months — this is up from 34 per cent a decade earlier.

*Australian banks are clamping down on how much they’ll lend…: in November 2017, the Commonwealth Bank’s “how much can I borrow” calculator estimated someone on the average annual salary at that time of $80,278 could have borrowed $463,000. By April 2019 that had dropped almost 25% to $351,100.

*…but it’s not a credit crunch, just sensible lending standards: the bank ‘lending crackdown’ is not a credit crunch, as some describe it, it’s actually a return to prudential lending standards that should never have changed in the first place. It was symptomatic of the banks’ enthusiasm to lend as much as possible for residential property, because of the high ROEs, that they were prepared to waive through loan applications that failed to properly assess a borrower’s spending.

Prior to that ‘crackdown’, instead of individually assessing a loan applicant’s spending, banks were frequently using the Household Expenditure Method (HEM), which presumes a certain level of spending based on postcode, the number of family members and salary. However, it was easy to fudge numbers and it could leave out critical amounts like school fees. At one point as many as 75% of loan applications relied on the HEM, which, if nothing else, is a reflection of how lazy the banks had become.

Indeed, at the height of the property boom in 2017, UBS did a survey of borrowers who’d taken out a mortgage in the previous 12 months, which found one-third of applications were not ‘factual and accurate’. Having done a similar survey in 2015 and 2016, which reached roughly similar conclusions, they estimated the banks had about $500 billion of factually inaccurate loans on their books, which became known as ‘Liar Loans’ in the US during the GFC.

It’s blindingly obvious why things had to change.

Have we borrowed too much to buy property?

Have we borrowed too much to buy property?

Buying residential property in Melbourne has been a great way to make money, with an astonishing total return over the 31 years to 2016 of 11.2% per year. The problem is, the majority of that return was capital gain, and almost all of that gain was underwritten by buyers taking on more and more debt, to the point that Australian households are now the second most indebted in the world. At some point households simply won’t be able to take on more debt, and then what happens?

I know I’m venturing into an area where emotions can run high, partly because the average Australian has an awful lot at stake when it comes to property values. I’ll say up front I’m definitely not advocating anybody rushes out and sells their property holdings, I’m simply offering some observations about residential property from an investment point of view. They may be right, or they might be way off the mark.

Property prices and debt

I don’t think it’s especially controversial to suggest there’s a logical relationship between the amount that people are prepared or able to borrow to buy property and how much they end up paying, but I reckon the two charts below kind of prove it.

Chart 1: RBA data suggests house prices have risen in line with the amount of household debt

Chart 1 RBA data suggests house prices have risen in line with the amount of household debt

Chart 2: There’s also a close relationship between loan approvals and house price growth

Chart 2 There’s also a close relationship between loan approvals and house price growth

Investing in property is, by definition, speculative

According to SQM the current ‘gross yield’, that’s the income you receive from rent before accounting for any taxes or costs, on Melbourne residential property is 2.9% per annum.

If you assume the property owner has a marginal tax rate of 37%, that brings it to an after-tax yield of 1.8%. Once you’ve accounted for all the other costs, such as management fees, body corporate fees, land tax, rates, insurances and what have you, you are very lucky to get a 1% ‘net yield’.

That same landlord could put their money in a term deposit paying 2.7% per annum; take out the 37% tax and the net yield is 1.7%, and there are no other costs to pay. Given that return is guaranteed by the government, we can call that the ‘risk-free rate of return’.

It’s a rock-solid law of investing that if the yield on an asset is less than the risk-free rate of return, then the investment is speculative, because the only way you can justify it is through capital gain. In other words, you’re banking on someone paying a higher price than you did.

Over the past 31 years, the capital gain on Melbourne housing has averaged 7.5% per year, so that speculative bet has been well rewarded, and it’s understandable for anybody to think that’s a well-established trend which is likely to keep going. The trouble is, it’s entirely reliant on people taking on more and more debt.

How expensive is residential property?

One way of working out the value of an investment is using what’s called a ‘price to earnings (PE) ratio’. That’s where you take the price of an asset and divide it by the earnings it generates per year; so if a $100 asset generates $10 of earnings per year, it’s $100 divided by $10, which gives you a PE ratio of 10 times.

The PE tells you how many years it would take for that investment to pay itself off and is effectively a measure of sentiment. If you’re pretty sceptical about an asset you’d want to get your money back sooner rather than later, so you might have a low PE of 4-5, but if you’re bullish on an asset you’ll be happier to have a higher PE.

You can use a PE ratio to measure the value of a share (it’s the share price divided by the earnings per share), or a property (the property value divided by the net yield). The current PE for the Australian share market is about 15 times. If we use the 1% net yield on property as above, that’s a PE of 100 (if you had a property worth $100,000 it would yield $1,000; $100,000 divided by $1,000 is 100).

That means Australian shares are currently 85% cheaper than Melbourne residential property. How can they be so out of whack? That would make a great dissertation topic for someone far smarter than me, but my hunch is debt has a lot to do with it. In 25 years in financial services I’ve yet to have a client tell me they’d be comfortable gearing a share portfolio to 80%.

Another comparison is M3 Property estimates the current yield on industrial property in Melbourne is 6.25%. Using similar costs as above you’d end up with a net yield almost four times that of residential property, or close to two and a half times the risk-free rate. Again, they seem way out of whack.

A final indicator of how expensive Melbourne’s residential property market is the Annual Demographia International Housing Affordability Survey, which compares how many multiples of median household income it takes to buy the median family home in 293 separate cities across nine different countries (Australia, US, UK, Japan, Hong Kong, Canada, New Zealand, Ireland and Singapore).

Melbourne is ranked as the sixth most unaffordable city (Hong Kong is the worst and Sydney is the second worst). Demographia rates a multiple of more than 5.1 times as ‘severely unaffordable’, and Melbourne’s is 9.9 (Sydney is 12.9).

Australia’s growing pile of household debt

It’s cliched to talk about how much Australians love their property, and it’s reflected not only in how much they’re prepared to pay for it but that they fund those high prices by going into more and more debt.

Chart 3 shows the amount of mortgage debt in Australia as a proportion of GDP and clearly shows when housing-related lending activity went parabolic. In 1988 the ‘Basel 1’ banking accord was introduced, which was an international agreement partly designed to make the banking system more stable by prescribing new limits for how much capital banks had to set aside as backing for different types of loans. Australian residential mortgages were considered relatively low risk, which meant the amount of capital required for them was set relatively low, meaning the return on equity for the banks from those loans was relatively high, so not surprisingly our local banks went to town lending to people to buy houses.

Chart 3: Australian mortgage debt as a proportion of GDP

Chart 3 Australian mortgage debt as a proportion of GDP

By any measure, Australian households now carry a lot of housing-related debt. The Bank of International Settlements (BIS) ranks Australian households as the second most indebted in the world (behind the Swiss, go figure) and chart 4 compares Australia’s household debt as a proportion of GDP to some other OECD countries and clearly shows the inexorable march upwards.

Chart 4: Household debt as a proportion of GDP

Chart 4 Household debt as a proportion of GDP

Something that strikes me, US household debt peaked at just below 100% of GDP right before the GFC smashed the property market, now it’s retreated to less than 80%. Ours is currently above 120%.

Chart 5 shows another measure: Australia’s household debt to disposable income. The remarkable thing here is it has grown at 10% compound per annum for the past 30 years. As they say, trees don’t grow to the sky; that is a phenomenal rate of growth in debt and at some point households simply won’t be able to gear up any further – everyone has to spend at least some of their income on living expenses.

Chart 5: Australia’s household debt to disposable income (%)

Chart 5 Australia’s household debt to disposable income (%)

The interest only problem

When you take out a mortgage to buy a property, there are two components to the loan repayments: the ‘principal’, which is the actual amount you borrowed, and the ‘interest’ you pay on the principal. It’s been popular for property investors to take out ‘interest only’ loans, meaning for (usually) the first five years they only pay the interest costs and none of the principal.

Why would you do that? There are some sound tax reasons around maximising deductible debt, but it also significantly reduces the monthly repayments. For example, if you take out a $500,000 loan at 4.66% it’s the difference between paying $1,942 versus $2,582 per month. Over five years that $640 per month adds up as a lower drain on your cash flow. The problem is of course, after five years you’ve not made any dent in the principal at all.

From 2008-2017 interest only loans accounted for about two-thirds of all investment loans and over that time the total amount tripled to peak at about $600 billion. Then in 2017 the Reserve Bank got sufficiently worried about the property market that they instructed the banking regulator, APRA, to cut back the amount of interest only lending. Chart 6 shows the sharp drop off in interest only lending when APRA told the banks to limit it to 30% of all new loans.

Chart 6: the % of interest only investment loans fell away in 2017 after APRA told the banks to cut back

Chart 6 the % of interest only investment loans fell away

UBS recently did a study on why borrowers took out interest only loans – see chart 7. To begin with, terrifyingly, 5% of respondents didn’t even know whether they had an interest only or P&I loan; but 18% said they opted for interest only because they couldn’t afford P&I and 11% said they intended to sell the property before the loan rolled over to P&I. Also scarily, 17% said they took out an interest only loan because their mortgage broker told them to. All in all, the survey suggests at least half of all interest only borrowers don’t seem to have a solid grasp on what they’re doing.

Chart 7: Reason for taking out an interest only loan

Chart 7 Reason for taking out an interest only loan


The same UBS survey also asked borrowers how much they thought their loan repayments would increase once it rolled over to P&I – see chart 8. The Reserve Bank reckons the average increase in monthly payments will be 30-40%, but worryingly, more than half under-estimated how much the increase will be, and again concerningly, more than a third had no idea, suggesting they’d not paid anywhere near enough attention.

Chart 8: Borrower’s estimate of the increase in mortgage repayments

Chart 8 Borrower’s estimate of the increase in mortgage repayments

The Reserve Bank estimates there’s a total of about $480 billion worth of interest only loans outstanding and $360 billion of those will roll over to principal and interest (‘P&I’) over the next three years. It also estimates that one-third of mortgages have less than a one month payment buffer. If all those numbers line up, that would imply one-third of the $480 billion of interest only loans have less than a one month buffer, so $160 billion worth. Of that, 18% say they won’t be able to afford the 40% jump in loan repayments when the loan rolls over to P&I, which is about $30 billion worth of loans. In a worst case scenario, that could point to a lot of forced property sales.

The banks have tightened credit standards

Until recently if you applied for a loan you would have to provide evidence of your income but not your expenditure. If the expenses in your loan application were less than a minimum amount the banks would simply use the so called Household Expense Measurement (HEM), which assumed $32,400 of expenses per year, to work out the amount they’d be prepared to lend to you.

After the recent Royal Commission into the banking and finance industry uncovered dodgy lending practices, the banks have been moving to tighten things up. Now they’re starting to require verification of both income and expenses, insisting on seeing things like bank and credit card statements. The upshot is the amount the banks are prepared to lend is estimated to drop by between 20-40% from previous levels – see chart 9.

Chart 9: New estimated borrowing limits based on revised expense estimates

Chart 9 New estimated borrowing limits based on revised expense estimates

Obviously, that simply translates into less money people can spend on buying a property, which you can only presume will feed straight into lower prices.

The washup

I know there have been calls for years that Australian housing is overvalued and dire predictions that our banking system is overexposed to it. I’m not making any such forecasts, I’m simply pointing out that there’s a limit to how much debt Australian households can take on to buy a house. Chart 10 shows the general trend of Australian mortgage rates has been downward for the last 25 years, which has underwritten a steady increase in borrowing capacity. If interest rates have indeed bottomed, will that cycle reverse?

Chart 10: Australian fixed interest rates have been on a downward trend for 25 years

Chart 10 Australian fixed interest rates have been on a downward trend for 25 years

The Reserve Bank has kept cash rates at a record low of 1.5% for more than two years and there’s no sign they’ll be raising them any time soon. However, Australian banks source a lot of their funding from offshore and rates there have already started to move upwards. We’ve already seen three of the big four banks raise mortgage rates a couple of months ago and there’s every chance they will do the same again. When borrowers are so stretched any tweak to rates has a very real effect.

I should emphasise, I’m not forecasting a crash in housing prices, there are a lot of arguments that the majority of Australian borrowers are well positioned to weather a downturn (though sometimes it’s hard to unravel where those arguments might be pushing someone’s barrow). Also, the Reserve Bank is acutely aware of how important the housing sector is to the overall Australian economy and will almost undoubtedly move to support it if necessary, and as the market adage goes, it’s unwise to argue against a central bank. What I am wondering is how sustainable the increase in household debt is, and if the answer is it has to slow, stop or even reduce, then what happens to house prices?

Why your credit rating is going to become a lot more important

Why your credit rating is going to become a lot more important

There has been a lot of media around the findings of the recent royal commission and how the banks have now made it significantly harder to apply for a loan. Another change, that was mandated prior to the royal commission, is set to place a much greater importance on keeping your credit file squeaky clean.

Most people who apply for a loan, from a mortgage to a credit card, accept that the lender will perform a credit check on them. Whilst these credit checks have always played a significant role in whether the application was accepted or declined the data that was historically available was limited to three items:

  1. The date of the last credit enquiry for the applicant.
  2. The name of the credit provider that made the inquiry, e.g. ANZ bank
  3. If there were any credit defaults or bankruptcy registered against the applicant. A credit default includes a repayment in arrears for a period of 60 days or more.

The lender would then rely on the applicant to include the balances and structure of any outstanding loans in their application and back them up with the relevant statements.

On 2 November 2017 the government announced it would legislate for a mandatory Comprehensive Credit Reporting (CCR) regime to come into effect by 1 July 2018. So by 1 October 2018 the four major banks were required to report that 50% of their credit data, including home loans, credit cards, car leases, etc. are shared with a credit bureau and made available to other industry participants. By 1 October 2019 this figure will grow to include 100% of all credit data.

Whilst the government’s mandate only applies to the four major banks, to gain access to the data a lender must also be a participant so it’s expected the smaller lenders will follow.

What does this mean?

Under the new reporting regime, the number of data points contained in a credit file would be significantly increased. In addition to the three listed above, the information available to lenders would include far more detail around the balance and limit of any loans you have outstanding or closed, the type and structure of those loans and their month by month payment history for the previous two years.

All these factors will then be considered to produce a credit score for the applicant of between 0 and 1000. Clearly this will provide lenders access to a lot more data, enabling them to better assess a borrower’s true credit position and hence their ability to repay a loan.

How will this affect me when applying for a loan?

As more Comprehensive Credit Reporting (CCR) information becomes available, it should drive competition and result in lenders offering a better deal based on your unique credit circumstances. In short you could be rewarded for a good credit score with a lower interest rate or punished for a bad one. The race will be on to best utilize this level of data and introduces the possibility of nimble fintech start-ups to enter the marketplace.

It may also result in a reduction in the documents you need to provide the lender with your application. If a lender can view your current balances and repayment history, then there may not be a need to provide this information in the form of paper statements.

Whichever way you look at it, the change will place far more importance on maintaining a clean credit file and will ultimately result in a more competitive risk adjusted lending market.

Things to think about before gifting your kids money

Things to think about before gifting your kids money

It’s natural that a parent would like to be able to help their kids out financially, especially if it’s to get a foot on the property ladder when even that first step can seem so out of reach these days. But you need to think carefully before you hand over a couple of hundred thousand dollars because if things go pear shaped a big chunk of that money could disappear.

Let’s imagine you give your child $100,000 to put towards buying a $1 million house, then not long after your child meets a partner and they move in together. If they end up marrying or the relationship becomes de facto, which according to the Family Law Court is after at least two years, but the relationship falls apart, your child’s ex can make a claim for a financial settlement. It’s possible your kid’s ex could get half the house, including half the money you gave your own child.

And if it’s your son and there’s a child involved the financial settlement can be a long way from 50/50. Within a few years of a very generous gesture, a big chunk of the money could well have gone.

It is apparently possible that a Family Court Judge will make an allowance where the relationship didn’t last very long and they conclude the spouse doesn’t really deserve to share in the money the parents gave. But that is far from certain.

There are two things you can do. First, rather than gift the money to your child, lend it to them. The value of the loan will be excluded from financial settlement proceedings. You want to make sure the deal is characterised as a loan from the outset and the smartest way to do that is going to the trouble of getting formal loan documentation drawn up by a lawyer so if there’s a dispute the courts will be left in no doubt what the arrangement is.

You can even lodge a mortgage against the property, with specific clauses requiring that any partner must enter an agreement with respect to the money.

The second approach is to have your child’s new partner sign what’s referred to under family law as a “Binding Financial Agreement”, pretty much the equivalent of what is popularly referred to as a ‘prenup’. Your child’s partner would have to acknowledge the money you’ve given and agree that it’s not to form part of any financial settlement in the event of divorce or separation. This is much easier if the money is used for something readily identifiable, like a house deposit, but it can get more complex if it’s intermingled with other money.

Again, the wording of such an agreement has to be quite specific and certain protocols have to be met, like having the signatures witnessed by a lawyer or Justice of the Peace, so it’s pretty much a necessity to use a lawyer.

It’s worth bearing in mind that it’s not just a relationship breakdown where the money you gave can end up in someone else’s hands, if your child goes bankrupt their creditors can end up with it too. Here again, having the money tied up in a formalised loan should protect it.

There are two other considerations: if you’re receiving a government pension, under the so-called ‘$10,000 rule’, Centrelink will look at gifts and transfers exceeding $10,000 per year, or $30,000 over five years, when calculating whether you qualify under the assets test. This includes paying school fees.

Secondly, if your child is taking out a loan to buy the property a lender is likely to want to know if the deposit is being part-funded by someone other than the borrower, and it would be a really bad idea to fudge things in an effort to make it easier for your kid to get the loan.

Helping your child out financially should be a heart-warming experience, taking a few precautions can help stop it turning into a gut-wrenching one.