0399757070
Are small cap companies still a bargain?

Are small cap companies still a bargain?

On 11 July, the US CPI data took the share market by storm. It was the fourth successive monthly decline, and at 3 per cent, it was the lowest annual inflation print in a year.

The fixed income markets had started 2024 expecting the US Federal Reserve would cut interest rates as many as four times over the year, but after some nasty surprises in March and April, there was even talk of another rate rise. The June print saw the odds of a September cut rocket and then the Federal Reserve Governor, Jerome Powell, all but confirmed it’s very much on the table.

So began what was being referred to as the Great Rotation as the market started to focus on those sectors and companies that would benefit the most from declining interest rates in an economy that was still expected to avoid falling into recession, and the hottest ticket in town was small cap companies.

The Russell 2000, one of two high profile US small cap indices, outperformed the NASDAQ and the S&P 500 by the most it ever has in a single day as well as over the following five days, rising by more than 10 per cent.

Then came the correction: higher than expected unemployment figures on 2 August saw perceptions about the risk of a US recession rise sharply, and the Russell 2000 gave back all those earlier gains.

In terms of their performance compared to their large cap peers, small caps have endured a rough past 10 years, with the Russell 2000 underperforming the S&P 500 by 32 per cent and the NASDAQ by more than 50 per cent – see chart 1.

Chart 2: the S&P 500’s PE ratio with and without the MegaCap 8

That outperformance by large caps has been underpinned by superior investment fundamentals, driven principally by the IT companies. Return on invested capital (ROIC) for large caps averaged about 10 per cent, double that of small caps, and free cash flow margins were 9 per cent compared to 2 per cent.

In other words, the large caps have been generating a higher return on every dollar they invest into their companies and ending up with more cash than their small cap peers.

On top of that, the small cap companies were, on average, carrying about four times the level of debt in proportion to their cash flow, so were more vulnerable to rising interest rates, especially given they averaged 40 per cent floating rate debt compared to the large caps at about 5 per cent.

But that was one of the reasons the Russell 2000 jumped so much when the market became convinced the next interest rate move is downwards, that leverage to interest rates becomes a good thing when they’re on the way down.

J.P. Morgan Asset Management recently wrote that a strong factor behind the small caps’ rally is that their valuations are as cheap as they’ve been this century, especially relative to large caps. The S&P 600, the other US small cap index, is on a forward PE ratio of 16x, versus a long-run average of 18x, whereas the S&P 500 is on 22x versus a long-run average of 17x.

The story for Australian small caps is slightly different. The Small Ordinaries index outperformed the ASX 200 quite handily right to the end of the post-COVID bull market in 2021 but has since given it all back during the period of rising interest rates. That underperformance over the last three years is despite the Australian large caps not having anything like the fundamentals or earnings growth of their US counterparts.

Chart 2: the S&P 500’s PE ratio with and without the MegaCap 8

The other consideration, of course, is that the Reserve Bank is not tipped to be cutting rates for a while yet, so more highly indebted companies are having to wait longer for relief.

So, are small caps still a bargain? The level of relative underperformance of Australian small caps versus large caps is almost as bad as it’s been in the past 30 years, and for the Russell 2000 versus the S&P 500, it’s about 20 years. If you’re a believer in mean reversion, you’d be looking for the catalyst and a reversal of the interest rate cycle might just be it.

On a straight PE ratio comparison, small caps again look cheap compared to large caps, but bear in mind the differences in fundamentals.

For smart investors who prefer a diversified portfolio, there’s always a solid argument for at least some weighting to small cap companies given that over the past 100 years they have, in total, handily outperformed their large cap peers. The phenomenal, albeit short, rally we saw in July is evidence that when small caps finally take off, they can move quickly.

Something to bear in mind about both US and Australian small caps is that one quarter of the companies in the Australian Small Ordinaries index, and about 45% of the Russell 2000, are loss making, so it’s one asset class where investing via an experienced fund manager with a strong track record can be beneficial.

A plain English explainer of what happened last week in global financial markets

A plain English explainer of what happened last week in global financial markets

Over the last couple of weeks global financial markets experienced one of those nasty corrections that leaves many investors wondering what the hell happened, and should I be worried.

Chart 2: the S&P 500’s PE ratio with and without the MegaCap 8

The lead up

Through to mid-July, US financial markets had been pretty cruisy. The S&P 500 had returned 19% year to date, with one pullback of about 5%, and the most commonly referred to measure of volatility, the VIX index, if anything was suggesting markets were complacent.

On 11 July, US inflation came in a little lower than expected and the markets got even happier, hitting a fresh all time high on expectations that the Fed would finally be able to start lowering interest rates while the rest of the economy still looked in reasonable shape, on target for the so-called ‘soft landing’, meaning the economy would make it through a rate tightening cycle without going into recession.

An unemployment speed hump

Then on 2 August, the US unemployment rate was reported at 4.3%, which was higher than had been expected and marked the fourth consecutive monthly increase. Suddenly the market swung around to worry that the US economy was heading for a recession, or a ‘hard landing’, and bond markets raised the likelihood of the Fed cutting rates in its September meeting to 100%.

On that Friday, the S&P 500 fell by 1.8%, but the Russell 2000 small cap index, which only a couple of weeks earlier had enjoyed a 10% rally over a few days when markets were counting on a soft landing, dropped 3.5% on the newfound risk of a hard landing.

The Bank of Japan increased interest rates

On 18 July, Japan’s inflation rate came in at 2.8%, which the Bank of Japan considers incompatible with a cash rate of 0.1%, so they raised rates to 0.25%.

Whilst that hardly sounds like it should cause much of a stir, it did, in large part because the Bank of Japan said there were more rate rises to come.

Enter the carry trade

Japan has had a zero or negative cash rate since October 2010. A popular strategy for hedge funds and traders has been the ‘carry trade’, where they borrow money in Japan at next to nothing, then invest the proceeds into other risk assets, like shares, bonds or currencies, often in offshore markets like the US.

It helps to understand the scale of the Japanese carry trade. Whilst nobody knows the exact number, Deutsche Bank estimated it to be around ¥20 trillion (more than A$200 billion).

A lot of these traders tend to make very similar bets, mostly following what’s called momentum strategies, which boils down to buying things that are going up and selling things that are going down, and mostly in very large, liquid assets. But because they’re using borrowed money, they operate under very strict stop loss restrictions, which means if the asset they’re invested in falls below a specific price, they have to sell.

One of the quirks (some would say problems) of today’s financial markets is that it’s estimated fundamental trading on global markets, that is, buying and selling of financial assets by long-term investors, accounts for only around 5% of daily turnover. In other words, those traders are mostly buying and selling off each other or robots.

 A simultaneous rush for the exit

The carry trade strategy worked really well, until the Bank of Japan started talking about higher rates at the same time that the US was factoring in lower rates. Suddenly, a lot of traders were facing margin calls on their Japanese loans, meaning they either had to stump up more cash to reduce the leverage or sell assets to pay down the loan. A lot of them chose (or were forced) to sell assets – and WHACK!

To settle the margin calls, they were selling their risk assets, such as US shares, and using the proceeds to buy back yen to repay their Japanese loans. That had the dual effect of share prices and sharply increasing demand for yen, causing the yen to appreciate massively against the US$, going from 162 to 144. 

 Mayhem in Japan

While the share market volatility certainly reverberated around the world, with the S&P500 down 6% from its highs at its worst and the NASDAQ down 11%, and the ASX 200 down 3%, Japan’s NIKKEI index dropped 25%! On Monday 5 August, the index fell 12.4%, which is its second biggest one day fall ever, after black Monday in October 1987.

That’s worth dwelling on for a moment: Japanese shares had a worse one day fall last week than they did during the GFC or COVID, or even during the post 1990 bubble correction. But it wasn’t due to any fundamental problem.

Notably, on Tuesday 6 August, the NIKKEI rose by more than 10%.

 Should we be worried?

In short, we don’t believe so. Wary, yes, worried, no.

Firstly, share markets have a long history of corrections, and they invariably pick themselves up, dust themselves off, and soldier on.

In the US, over the past 100 years, 94% of years have seen at least a 5% share market drawdown, 64% have seen at least a 10% drawdown, and 26% have seen at least a 20% drawdown. Indeed, over the past 40 years the average intra-year drawdown has been 14.2%.

In Australia, over the past 30 years the average intra-year drawdown has also been 14%.

Suffice to say, right now we don’t see any big, global imbalances that a represent systemic issue. Also, the Bank of Japan has said it will not be doing anything with interest rates while financial markets are volatile.

 Will the US recess?

It’s interesting to note that the very next week, the employment data in the US was better than expected. It appears the early August data was affected by Hurricane Beryl, which forced some people to stay home from work and caused a spike in temporary layoffs.

The recent data about the US services sector, in terms of both activity and employment, was unexpectedly strong, indeed it was also strong in Europe, Japan and China.

Also, the US government is running a budget deficit of more than 6% of GDP, which represents an awful lot of money going into the economy, making it harder to recess.

 What about Australia?

The numbers in Australia are not as strong. While the unemployment rate has remained at 4.1%, job ads have fallen for 9 of the past 11 months. The higher interest rates have a more pronounced effect on household spending because we have a high proportion of borrowers on variable rate home loans, and GDP growth per capita has been negative for five quarters in a row.

What’s this $3m tax on super? Explaining Division 296 tax

What’s this $3m tax on super? Explaining Division 296 tax

Clients are beginning to hear about a proposed new tax on a portion of their earnings as we approach its likely implementation date. This tax, known as Division 296, is essentially a tax on earnings for those with superannuation balances greater than $3 million. The proposed law is expected to take effect from the 2025-2026 financial year and will impact those whose Total Super Balance (TSB) exceeds $3 million at the end of the relevant financial year.

Although the law is not yet in place, it is likely to be enacted. Some details are still being reviewed as industry bodies provide submissions on the fairness and workability of the new tax.

Key features

  • First determination: Sometime after 1 July 2026.
  • Personal tax liability: This tax is a personal tax liability, not a fund tax liability.
  • $3 million threshold: Applies per individual as of the end of the financial year.
  • Earnings threshold: The tax applies to the proportion of your earnings above $3 million and does not differentiate between realised and unrealised gains.

Rate of tax

The tax rate is 15%, applied only to the earnings corresponding to the percentage of your TSB that exceeds $3 million. 

The formula used is:

Chart 2: the S&P 500’s PE ratio with and without the MegaCap 8

Superannuation earnings

The next step in determining the amount of Division 296 tax that you may be liable for is to determine the amount of superannuation earnings for the relevant year.

Basically, you look at the difference between the balance at the start of the financial year (remember this will commence 1 July 2025) and the end of the financial year (30 June 2026).

You then need to make adjustments for contributions and withdrawals made during that year to come up with the adjusted Total Super Balance)

TSB at end of the relevant year + withdrawal total – contributions total.

So, the adjusted amounts will then be as follows:

Current year adjusted TSB – previous year TSB.

Worked example

On 30 June 2026, Cartia has a TSB of $4 million. During 2025/2026, she made a lump sum withdrawal of $100,000 and received concessional contributions of $27,500. Her TSB on 30 June 2025 was $3.2 million.

While Cartia’s superannuation earnings for Division 296 purposes are estimated to be $876,625, only $219,156.25 is subject to the tax. These earnings are attributable to the portion of her superannuation exceeding $3m.

After applying the 15% Division 296 tax rate, her personal liability will be $32,873.44.

While this is a personal tax liability, Cartia may request her superfund pay the tax from her member balance.

Summary and what’s next?

Division 296 is a new 15% tax on earnings (both realised and unrealised) on member super balances over $3m. However, while we expect it to be legislated, it isn’t law as yet as industry groups put forward submissions for certain tax aspects to be reviewed. The areas of contention include:

  • Unrealised gains should not form part of the taxable super earnings.
  • If unrealised gains are taxed, there should be a rebate if those assets are realised at a lower value in the future.
  • The $3m threshold should be indexed

Assuming it is passed to commence in the 2025/2026 financial year as we expect, there is no need to do anything until 2026.

If you would like to discuss your situation, please get in touch.

While there are strategies that you may consider to minimise this tax, the appropriateness depends on your specific situation. Please feel free to contact us and we can talk you through it and help put a strategy in place in due course.


Australia has its own tech powerhouses

Australia has its own tech powerhouses

Over the past 10 years, investing in technology companies has been a great way to make money. And when we think about investing in tech, it’s almost natural to think about the world conquering US technology behemoths, the likes of Nvidia, Apple, Microsoft, Meta, Google and Amazon.

The US’s NASDAQ Composite index has become synonymous with tech investing, and USD100,000 invested there 10 years ago would now be worth more than USD$430,000.

Or at a stretch you might think about the Asian tech giants, the likes of Baidu, Alibaba, Tencent and Xiaomi out of China, or even Korea’s Samsung and Taiwan’s TSMC.

It’s less likely when you think about investing in tech companies that Australia comes to mind, after all, that’s where you go for some of the world’s biggest resources companies, or reliable dividend payers like the financials, which between them account for more than half the total market. Given the S&P/ASX Information Technology index accounts for just 3 per cent of the market, it’s easy to see how it can be overlooked.

However, the same peculiarities with the way the US tech index is constructed that stops Meta (Facebook), Amazon and Google from being included as “tech”, are applied to some companies that would seem obvious inclusions for the Australian index, such as REA Group, Pro Medicus and CAR Group, and they happen to be some of the best performing too.

Whilst Australia’s tech sector is relatively small, it boasts some high-quality companies that come with decades of history which have produced outstanding returns. To illustrate, we can take full advantage of the benefit of hindsight to see how a portfolio of a selection of Australian tech-oriented companies would have performed compared to the market.

The portfolio is comprised of seven of the best known tech companies from the ASX 200 ranging in market cap from $33 billion down to $2 billion: WiseTech (WTC), REA Group (REA), Xero (XRO), CAR Group (CAR), Pro Medicus (PME), TechnologyOne (TNE) and Megaport (MPT).

A portfolio equally weighted to each of the seven companies starting from the date that WiseTech listed on the ASX, 11 April 2016, would have returned an astonishing 1151 per cent to the end of May this year, against the Vanguard Australian Share (VAS) ETF’s total return (including dividends) of 117 per cent and the S&P/ASX Information Technology index’s 208 per cent – see chart 1.

Chart 2: the S&P 500’s PE ratio with and without the MegaCap 8

That’s an incredible compounded annualised return of more than 36 per cent, which is more than double that of the NASDAQ Composite over the same period, and well over triple that of the broader Australian share market.

Chart 2: the S&P 500’s PE ratio with and without the MegaCap 8

The catch is, however, this is a portfolio of “growth” companies, meaning their earnings growth is not so dependent on the economic cycle, and the market typically looks out years ahead when valuing them, and the higher the potential growth, the further out it will look. Consequently, just like their international tech peers, this portfolio of stocks comes with a high forecast price to earnings (PE) ratio for next year, with an average of 70x, compared to the ASX 200’s 17x.

A drawback of their high valuation multiples is that growth stocks are usually more volatile than the broader market. For example, during the COVID crash of 2020, this portfolio of stocks fell by 53 per cent, compared to the broader market’s 39 per cent; and in the market correction of 2022, it was a 51 per cent drop versus 28. So investors need to be sure they have the risk tolerance to see those corrections through in order to benefit from the long-term growth.

It is also unusual that high growth companies pay much of a dividend, if they pay one at all, because normally they are reinvesting earnings into their growth pipeline where they would expect to earn a high return on the equity invested. The average dividend yield on this portfolio is less than 1 per cent, so investors have to be resigned to returns being dependent on capital growth.

Obviously, the old proviso of past performance not being an indicator of future returns applies to this portfolio of tech stocks, but there has been an impressive degree of consistency. Whilst it might be a brave investor who would allocate a large portion of their portfolio to high growth companies, a smart investor should see the merit of some allocation.

The Land of the Rising Stock Market

The Land of the Rising Stock Market

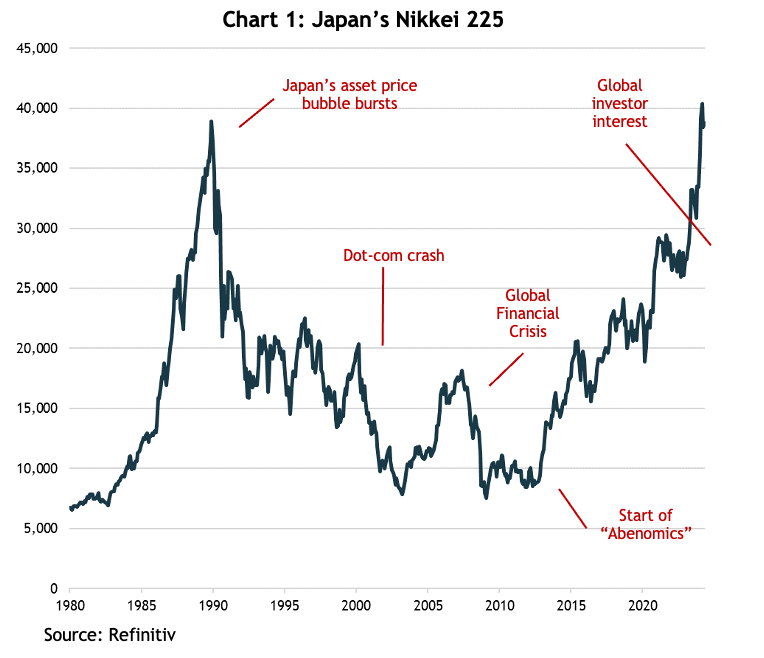
The Japanese stock market holds the ignominious title of having played host to the biggest stock market bubble in history.

Over the four years leading to its peak on the last trading day of 1989, the Nikkei 225 rose by more than 30% per year, by which point it accounted for 37% of global stock market capitalization (the US was 29%), it was trading at 60x the previous 12 months’ earnings and hit a price to book value ratio of more than 8x.

Not surprisingly, the bubble reached into all aspects of the economy, especially the property market. After the big pop, Japan slumped into such a prolonged period of economic stagnation the following 20 years are referred to as the Lost Decades.

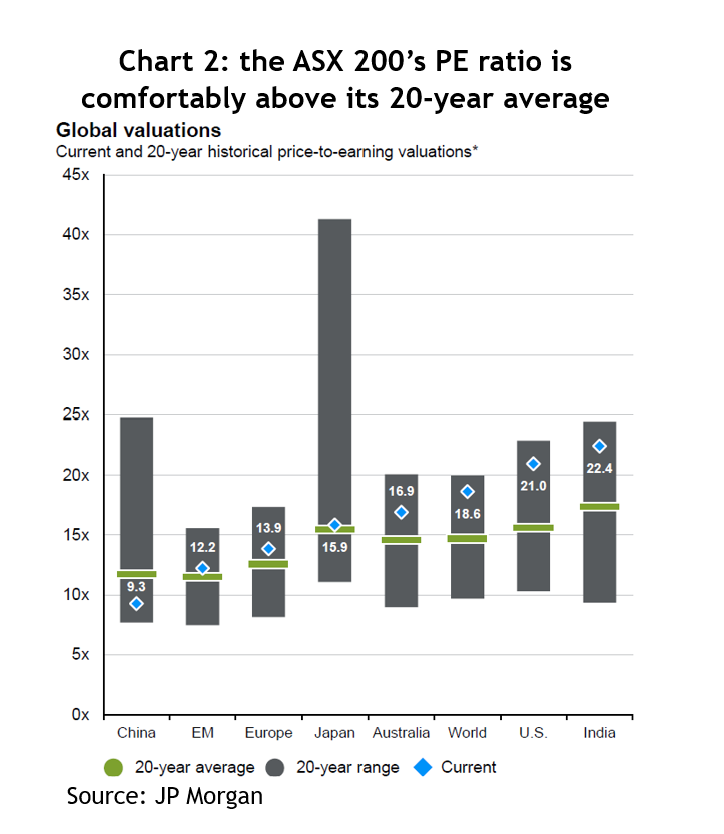
It took 34 years for the Japanese share market to hit a new all-time high, which happened in February this year, and it’s now 5.5% of the MSCI All Country World Index (which is still the second biggest but compares to the US at 62%), with a PE ratio of 15x and almost half the index trades at less than 1x book value.

Chart 2: the S&P 500’s PE ratio with and without the MegaCap 8

The rise and rise of the Nikkei

In December 2012, Shinzo Abe was appointed as Prime Minister of Japan and introduced the “Abenomics” stimulus program designed to reignite the moribund economy. Whilst we can’t be sure the amazing share market returns since then are entirely due to those economic policies, you’d have to think they played a part.

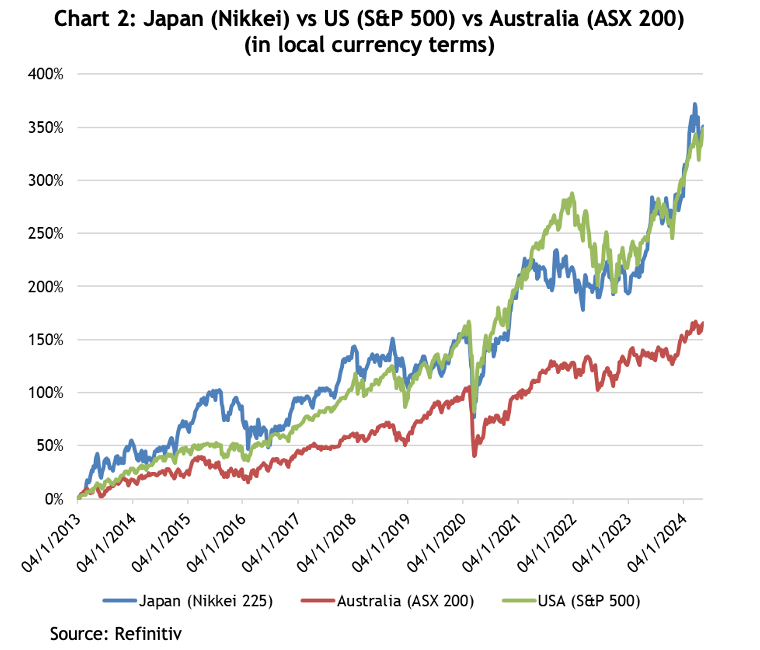
Given the incredible rise of the US share market in the post-GFC period, you’d have thought it had wiped the floor with all comers, but astonishingly, since the start of 2013, the Nikkei and the S&P 500 have increased by the same amount: 350% – see chart 2.

So why haven’t we heard more about Japan over the past 10-plus years? One reason is because we keep hearing about an economy that has struggled to generate positive real economic growth, a population that is in long-term decline and a government balance sheet whose debt is multiples of its GDP. Hardly inspiring stuff.

A second reason is that over that period since 2013 the yen has steadily weakened against the USD, so for US investors returns from the Nikkei were more than 40% less than what they got from the S&P 500. Unfortunately, that doesn’t excuse Australian investors, for whom AUD returns would still have been 80% higher than the ASX 200 over those 11 years (a total return of 300% vs 166%).

The santa claus rally

Hang on, where’s the AI?

Chart 2 shows the Nikkei has risen sharply since the start of 2023, as has the US. We all know about the US’s rally being powered by AI and the mega cap tech companies, but Japan doesn’t boast any household tech names. So what’s powered the Nikkei?

What we’re seeing is the culmination of more than 10 years of corporate reform, kicked off as part of Abenomics, which dragged what had been hidebound, stodgy Japanese companies into the modern era of disclosure and governance. That such sweeping structural reforms have been achieved is also indicative of Japan’s culture that emphasises the collective good, with the government’s Ministry of Economy, Trade and Industry working in conjunction with the Tokyo Stock Exchange (TSE) and the Keidanren (the Japan Business Federation).

Companies have been required to calculate the cost of capital and explain why returns failed to meet that cost; they’ve been urged to unwind complex cross shareholdings built up over decades; and the number of companies with at least 30% independent directors has increased from just 6% in 2014 to 97% in 2023.

The TSE emphasised the importance of companies improving returns and encouraging a more open dialogue with shareholders to improve governance, return on equity and valuations. In March last year, it announced they would be publishing a monthly list of those firms that have published written guidance on how they planned to improve their share prices, and by February this year, a staggering 54% of companies had complied or are actively considering it. Notably, the shares of companies that have published guidance have outperformed those that have not by more than 16% over that period.

The impact on overall returns has been extraordinary. Since the inception of Abenomics, earnings per share for listed Japanese companies has tripled, and return on equity has gone from negative levels in 2010 to 9% as of March 2024 – which is still half the US’s.

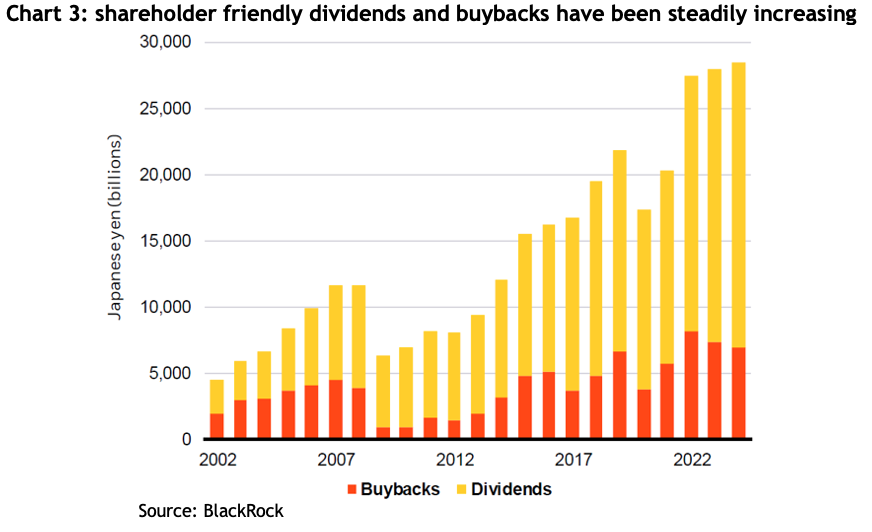
In the past, Japanese companies were notorious for sitting on piles of cash, burned by the experience of banks pulling loans in the aftermath of the asset bubble. Part of the reform has been encouraging the payment of dividends, and last year the yield hit almost 4%. In the most recent earnings reporting season, 53% of companies announced they plan to increase dividends this year, which is more than double what it was in 2012.

Part of the TSE’s push was to get companies to formulate a plan to get their shares trading at least at book value (that is, the market capitalization to be at least equal to the value of the company’s assets). When Abenomics started, 74% of listed Japanese companies were trading below book value, and by the end of 2023 that number was less 45% (compared to 4% on the S&P 500), and by February this year it was down to 33%. The current price to book multiple for the for the broader Topix index is still relatively cheap at 1.4x, which compares to the US’s 4.4x (very high due to the relatively low portion of tangible assets the megacap tech companies have) and Europe’s 2.1x.

When a company’s shares are trading on a low price to book valuation it makes sense for them to buy back their own shares. From 2017 to 2023 total share buybacks quadrupled to 4.15 trillion yen and are set to hit another record in 2024.

Aggregate weekly payrolls deflated by PCE inflation

Can it keep going?

Japan’s clearly enjoyed a fabulous run over the past 10+ years, are there reasons to think it could keep going? At the moment, it’s actually more of a challenge to find a strategist who’s bearish. One reassuring thing is there’s a variety of reasons put forward to remain bullish about the market.

Inflation

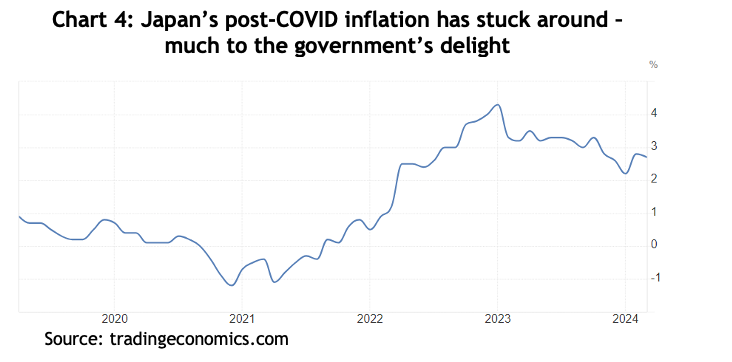
At long last, the Japanese economy appears to be showing signs of life. The government and central bank have been trying to generate positive inflation for years, running the world’s first QE program, maintaining zero bond yields and negative cash rates, but the CPI has averaged 0.5% for the past 20 years. However, the worldwide outbreak of inflation since COVID saw inflation peak above 4% and it’s proving at least a bit sticky, with the latest reading coming in at 2.7%.

Aggregate weekly payrolls deflated by PCE inflation

That glimmer of inflationary hope enabled the Bank of Japan to raise interest rates in February this year for the first time in 17 years, taking the key rate from -0.1% all the way to 0%.

Nominal GDP growth

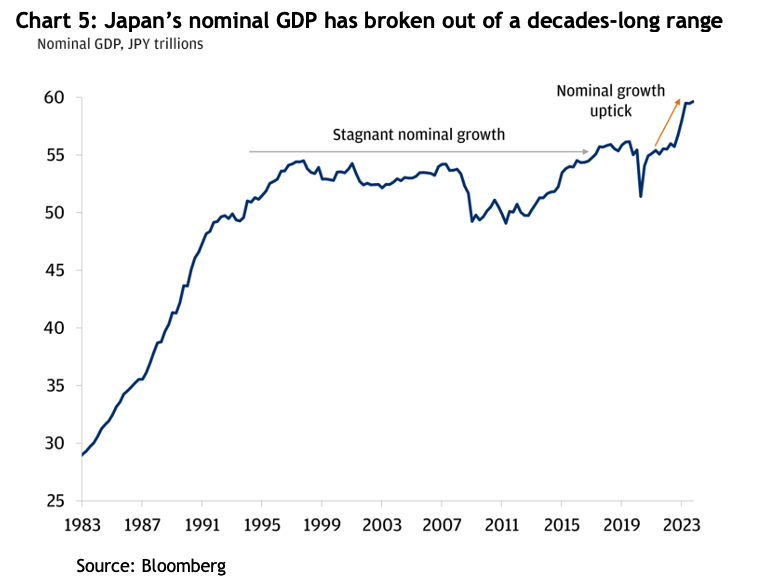
It seems the return of inflation has pushed Japan’s nominal GDP (that is, before accounting for inflation) into a new all-time high, which, if nothing else, may help confidence in the economy – see chart 5.

Aggregate weekly payrolls deflated by PCE inflation
Wages

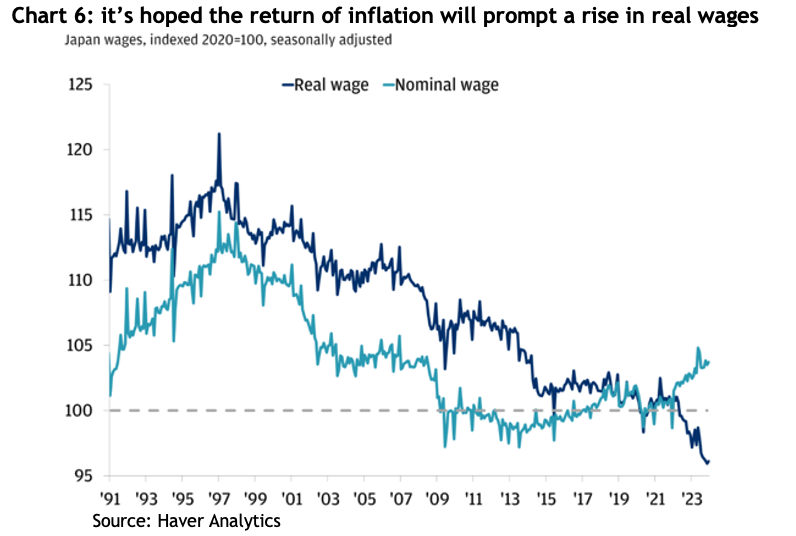
Economists are hoping the return of inflation may prompt an increase in real wages, which have been declining since 1996 – see chart 6. They figure if that happens consumers may spend a bit more.

Aggregate weekly payrolls deflated by PCE inflation
The Return of Mrs Watanabe

Mrs Watanabe was a term coined some 20 years to describe enthusiastic Japanese retail investors, more specifically in the currency markets. The government is trying to encourage their return.

The Nippon Individual Savings Account (NISA) is a program introduced by the Japanese government to encourage households to invest through an account that can hold domestic and foreign securities, ETFs, REITs and mutual funds. In January 2024 the government gave the program a major overhaul by doubling the annual limit people could invest to 2.4 million yen (about AUD23,000) per year and making the investments totally tax-free.

Apparently the combination of resurgent inflation, tax-free investment incentives and the rising share market has nudged Japanese households back to the share market. In 2023, more than half of the 2.1 quadrillion yen (about AUD2 trillion) of Japan’s household assets were held in cash and deposits, and while shares have risen by more than 50% as a proportion over just a few years, they are still only 18%, compared to 51% in the US.

The revamped NISA and a strong share market saw the total traded value on the TSE hit 60 trillion yen (about AUD55 billion) in a single week of February this year, which is more than twice what it averaged between 2015-2020.

Currency: tailwind or headwind?

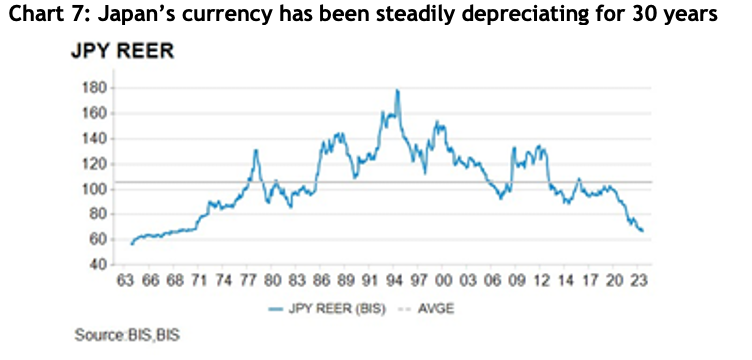
The yen has been on a steady decline against most major currencies for decades, mostly because of the zero-interest rate policy causing a huge differential, especially over the course of the current global interest rate cycle. The upshot is the real effective exchange rate for the yen, which is an index that measures the strength of a currency relative to a basket of other currencies and adjusted for inflation, is at levels last seen 50 years ago – see chart 7.

Aggregate weekly payrolls deflated by PCE inflation

A weak currency is terrific for a country that exports a lot of products, as Japan does, because it makes those exports cheaper for the buyers. However, it also makes imported goods more expensive, and Japan imports almost all its energy and much of its food, so there is concern the sticky inflation they’re experiencing now could get out of hand.

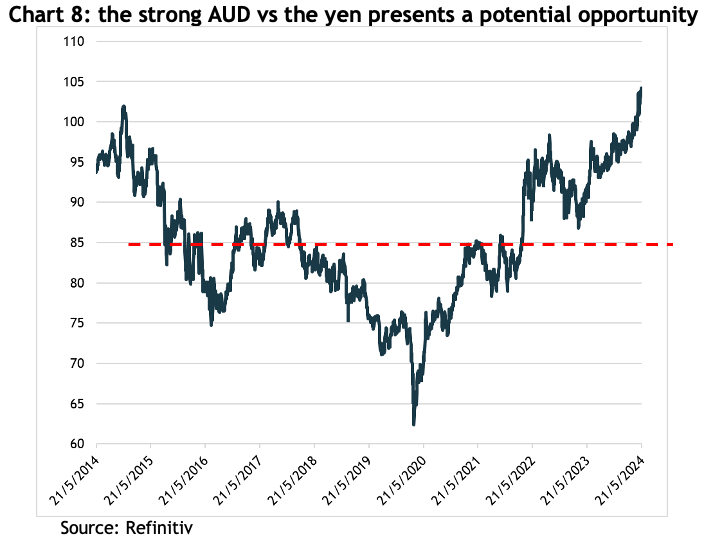
For Australian investors, the relative strength of the AUD against the yen at the moment presents a potential opportunity. Chart 8 shows the AUD is at the top of the past 10 years’ trading range, with a current value of 104 yen to one AUD, whereas the average over those 10 years is 85.

Aggregate weekly payrolls deflated by PCE inflation

If you were to buy the Japanese index and it did absolutely nothing for two years, but over that time the currency returned to its long-term average, you would make 18% just on the currency.

The big rediscovery

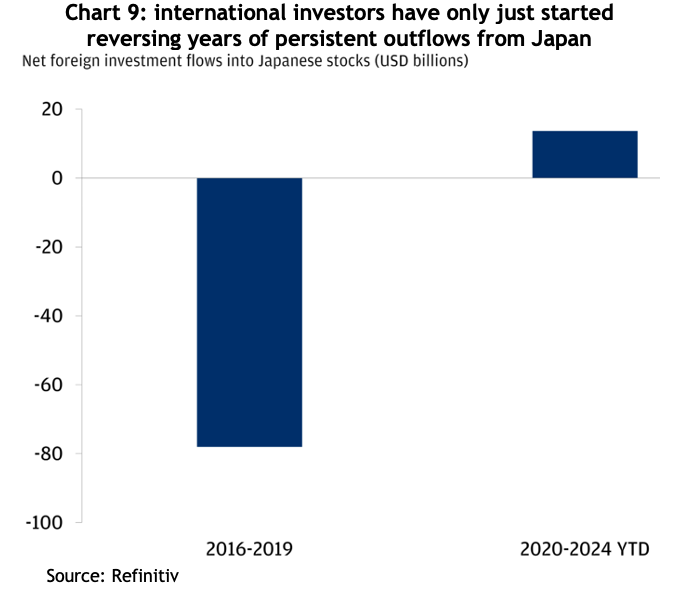
Japan has had the second largest stock market in the world for decades, but international investors steadily pulled their money out for years. Chart 9 shows the strong returns posted over the past 10 years have finally reversed that outflow. Who knows, with so many bullish reports on Japan, it’s possible that inflow of money is very much in its early days.

Aggregate weekly payrolls deflated by PCE inflation

Conclusion

The reasons for Japan’s strong share market returns over the past 12 years appear to be structural, thanks to coordinated efforts between the government, the stock exchange and companies themselves. What’s more, those structural changes appear to have at least a bit more to run.

Forecast earnings growth for Japanese companies in 2024 is 13% (compared to -6% for Australia) and 9% for 2025 (vs 4%), though they are renowned for being conservative with their guidance, preferring to under-promise and over-deliver.

The broader TOPIX index is on a forward PE ratio of 15.2x with a forecast yield of 2.1%, compared to the ASX 200 with a forward PE of 17.1x. Whilst Australia’s yield is a world leading 5%, the forecast fundamental total return (EPS growth + dividends), is -1% vs 15.1%.

Lots of strategists take an economically orthodox view, arguing if inflation falls again, preventing the BOJ from ‘normalising’ interest rates, i.e. increasing them, then things may not work out so well. The thing is, the index returned 14% compound per annum for more than 11 years when inflation was mostly negative. Who’s to say it couldn’t continue?