Interview with Partners Group co-founder Urs Wietlisbach

Interview with Partners Group co-founder Urs Wietlisbach

Urs Wietlisbach is one of the three founders of Swiss private equity firm, Partners Group, which has grown to manage more than US$130 billion. James Weir interviewed Urs on the outlook for private equity and whether higher interest rates changes the outlook for returns. Watch until the end to get Urs’s view on the prospects for the Global Value Fund as it prepares to sell more than 20 mature assets.

What’s the best way to take advantage of the multi-year selloff in bonds?

What’s the best way to take advantage of the multi-year selloff in bonds?

It’s never happened before: bonds are about to deliver a third year of negative returns. The BofA Merrill Lynch 10+ Year Treasury Total Return Index in the US was recently more than 40% off its highs – more than double its previous worst drawdown. 

It’s left a lot of shell-shocked investors scratching their heads wondering how what’s supposed to be the defensive part of a portfolio could perform so badly, and a whole lot of other investors wondering if there are bargains to be had.

Why were bond returns negative?

The first thing to know about bonds is that inflation is like kryptonite for them. If investors believe inflation is going up, they will demand higher compensation in the form of a higher yield.

The second thing to know is if you hold a government bond to maturity you are assured of getting the principal back, which is always a face value of $100 per bond.

When a plain old government bond is first issued, the interest rate it will pay the holder (which in bond speak is called a ‘coupon’) is fixed and doesn’t change over the life of the bond.

If you bought a newly issued Australian 10-year government bond today you’d receive a yield of about 4.6 per cent per year, and after 10 years you’d get $100 back for each bond. So the annual return is dead easy to calculate: 4.6 per cent.

However, if you wanted to sell that bond and inflation expectations have gone up since it was issued, any potential buyer will insist on a higher yield. Because the coupon is fixed, the only way to compensate the buyer is to reduce the price of the bond. Then, if the buyer hangs on to it until maturity, they’ll get the $100 back but on a lower entry price, thus compensating them.

Since the inflationary outbreak of the late 1970s and early 1980s, inflation has trended downwards over the medium to longer-term, which has been fantastic for bond investors, because the price of those bonds has risen over that medium to longer-term – see chart 1.

Chart showing bond yields trended down, resulting in a 40-year bull market, which went into reverse in mid-2020

However, the inflationary outbreak of the past few years has thrown that into reverse, and as expectations of higher inflation and interest rates has grown, so the price of bonds has fallen.

Is it time to hunt for a bargain?

It’s hardly surprising that any investor accustomed to market cycles would look at an asset that’s dropped 40 per cent and presume there’s a bargain to be had, and there are bond fund managers banging the table insisting now is the time to be buying bonds. But, as with anything in financial markets, unfortunately it’s not that easy.

Government bonds are issued with different lifespans, from 90 days to 30-plus years. The most popular bond yield that gets quoted is the 10-year bond.

The longer-dated the bond, so the more life it has until it matures, the more volatile it will be. The fancy name for that is ‘duration risk’, and it’s something that can be worked out for every bond. Australian 10-year government bonds currently have a duration risk of 8.7, which means if the yield increases by 1 per cent, the price of those bonds will fall by 8.7 per cent, and vice versa.

It’s that duration risk, and the volatility it causes, that’s the trickiest part about investing in bonds, even after they’ve copped a beating.

For a real world example, you can buy an Australian government bond through the ASX. A quick Google of “ASX listed bonds” should take you to the page that lists them. There’s one with the ticker GSBG33, which was originally a 20-year bond issued in 2013, so it has 10 years left until maturity. As you’d expect, its current yield is pretty much bang in line with the quoted 10-year yield, so about 4.5 per cent, and its last traded price was around $100. In other words, what you’d expect from a 10-year bond.

However, in August 2019, that same bond was trading at a price of $147, and at the start of November it was $97, so its price had dropped by 34 per cent – see chart 2. That’s some serious volatility for a supposedly defensive asset; clearly, it’s only defensive if you are certain you’ll hold onto it until maturity, in which case you’ll receive a return of 4.5 per cent, which compares to the September inflation rate of 5.4 per cent.

Chart showing the Australian government bond, GSBG33, has experienced higher 
volatility than what many would associate with a defensive investment

For a long-dated bond to provide a better return than 4.5 per cent will require inflation expectations to fall, which is likely to happen if the economy slows down or goes into recession, and importantly, that extra return will effectively come from the price going up, so capital growth.

There are shorter-term bonds, that have lower duration risk and are therefore not as volatile, but the yield is lower. Alternatively, for investors purely interested in locking in a yield, term deposits are now paying as much as 5.25 per cent for 12 months and come with a capital guarantee. The risk you run there is it’s only good for 12 months.

You can also buy bond ETFs, however, they never mature. The ETF will always have some duration risk in it, meaning it will always be potentially volatile.

Another option is to invest through a fixed income fund manager and leave it to their expertise. There are some that specialise only in government bonds and others that operate under a more flexible mandate and can invest in corporate bonds as well. Andrew Papageorgiou, a portfolio manager at Realm Investment House, argues credit spreads on corporate bonds are historically far less volatile than interest rates. Also, good managers can employ fancy strategies to minimise the effect of volatility by using derivatives.

It’s possible those arguing it’s a great time to buy bonds are affected by recency bias: it wasn’t so long ago bond yields were negative, how can they possibly stay above 4.5 per cent? But bond yields don’t necessarily mean revert, the recent downward trend went for 40 years. There are legendary bond commentators, like Jim Grant and Barry Eichengreen, warning of a multi-decade bond bear market.

What’s more, investing in bonds to back a view that yields will decline is effectively targeting a capital return, which rings of a growth investment, whereas bonds are normally part of the defensive fixed income part of a portfolio.

On the bearish side of the fence are the many economists arguing rates will stay “higher for longer”. It really depends on what happens to inflation, and if smart investors have learned nothing else over the past couple of years, it should be that trying to guess where inflation will be years from now is a mug’s game.

If you would like to discuss your investment options, please get in touch.

The big spending that could keep the US out of recession

The big spending that could keep the US out of recession

In September last year, Bloomberg reported that 100 per cent of surveyed economists expected the US economy to recess in early 2023, and strategists were warning of calamitous markets ahead. Of course, that didn’t happen, and whilst GDP growth of a smidge above 2 per cent per year isn’t going to knock anybody’s socks off, it’s far from going backwards, and the US share market rose 20 per cent to the middle of 2023.

Economists tend to follow an approach where they try to fit today’s circumstances into a historical analogy, saying “I think what’s happening with inflation and interest rate rates today is not dissimilar to the 1970s/1980s/whatever period”, and base their forecasts on what transpired back then.

The thing is, none of those past rising interest rate episodes were preceded by the federal government shoving 25 per cent of GDP into household bank accounts, which was what happened with the COVID stimulus cheques. That massive fiscal injection had two effects: first, it set the economy on fire, sending unemployment levels to 50-year lows; and second, households had never enjoyed such a large savings buffer to cushion against rising prices. As a result, the US economy’s resilience took orthodox economists and strategists by surprise.

Once again, we are seeing a growing consensus that the US economy is going to recess next year, which brings with it the usual talk of America sneezing and the rest of the world wrestling with swine flu.

Concerns that the Federal Reserve is going to increase interest rates again, that rising bond yields will make shares increasingly less attractive, that the now long-standing inverted yield curve will somehow work its voodoo, that consumer confidence is falling, and households are running out of those excess savings, combine to paint a grim picture. Throw on top of all that a dysfunctional US congress and an approaching election plus the ongoing problems China is experiencing and it’s clear why the bears are once again on the prowl.

However, if you look hard enough, just like last year, there are some signs pointing in the other direction; signs that tend not to feature in most forecasts. And, again just like last year, they revolve around some significant fiscal injections and consumers that might be in a better spot than economists give them credit for.

The first of those fiscal injections is the interest the US government is paying on the more than USD33 trillion of bonds that are on issue, which has risen over the past three years from USD500 billion per year to more than USD900 billion. That may not be going into the pockets of the people who would spend it all, but it’s still going into the economy.

The second is the three signature pieces of legislation that have been dubbed ‘Bidenomics’, the CHIPS Act, the Infrastructure Act and the Inflation Reduction Act (IRA), which between them earmark more than USD2.25 trillion of government spending.

Between them, that amounts to more than 12 per cent of the US economy being injected through government spending programs, which are on top of the usual budget items. What’s more, the IRA, which basically invites any company with a decarbonisation project to apply for tax deductions, rebates or subsidies, is open ended, and Goldman Sachs estimates the amount being spent has increased from the original projection of USD780 billion to more like USD1.2 trillion.

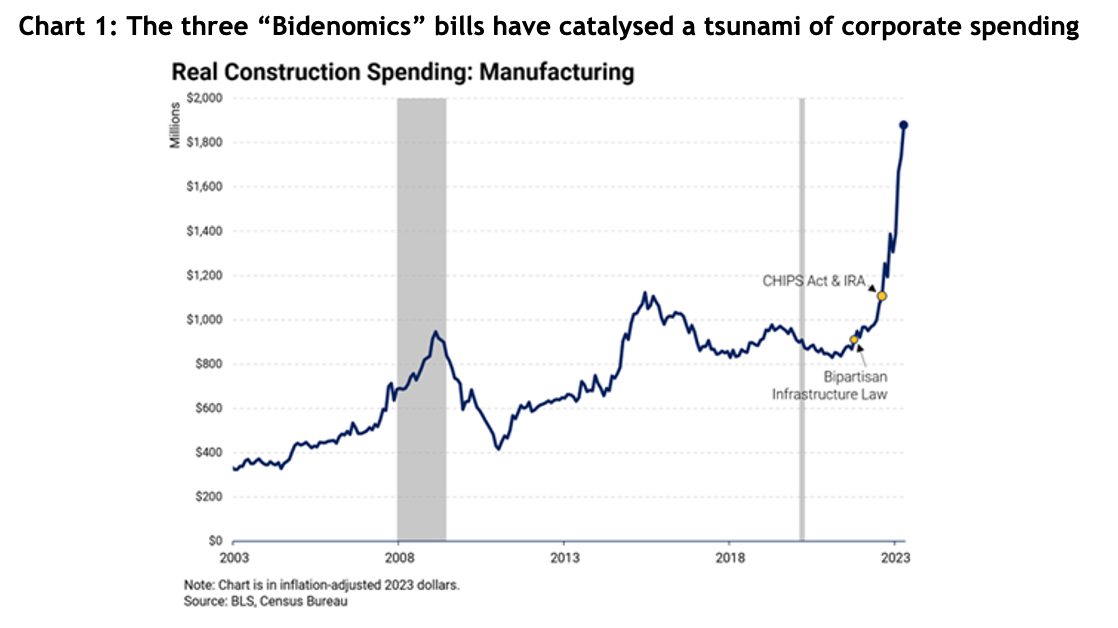
When you add them up, it’s a ton of money being thrown into the economy, and those three government policies have catalysed a tsunami of corporate spending, with data from the US Treasury showing real manufacturing construction spending doubling to USD1.9 trillion over the year since they were passed – see the chart below – and non-residential construction spending in general is up 15% since the infrastructure bill. Overall, private sector spending has gone up three times more than public spending. In other words, the government’s policies are crowding in private sector spending.

Table showing the 2022 share market returns in local currencies

Regrettably, Australia is in the opposite position, with the federal government boasting of a surplus, which is sucking money out of the economy at a time when households spending is coming under a lot of pressure.

As for US consumers, while it’s true they’ve almost run out of excess savings from COVID, there’s still a base level of savings, plus household bank deposits are more than four-fold higher than pre-COVID at USD4 trillion. Then there’s the 50 per cent rise in money market fund balances to around USD6 trillion and a similar rise in home equity to almost USD32 trillion.

In other words, American consumers have a lot left in the tank to maintain that legendary appetite for spending.

It’s still entirely possible the US economy will hit a recession-sized bump in the road, but it’s far from a certainty. Smart investors will know better than to put their faith in economists and strategists who get things wrong as much as they get them right.

Emerging markets: good value or value trap?

Emerging markets: good value or value trap?

Emerging markets are cheap. The problem is, they’ve been cheap for most of the last decade, and have failed to deliver on their promise.

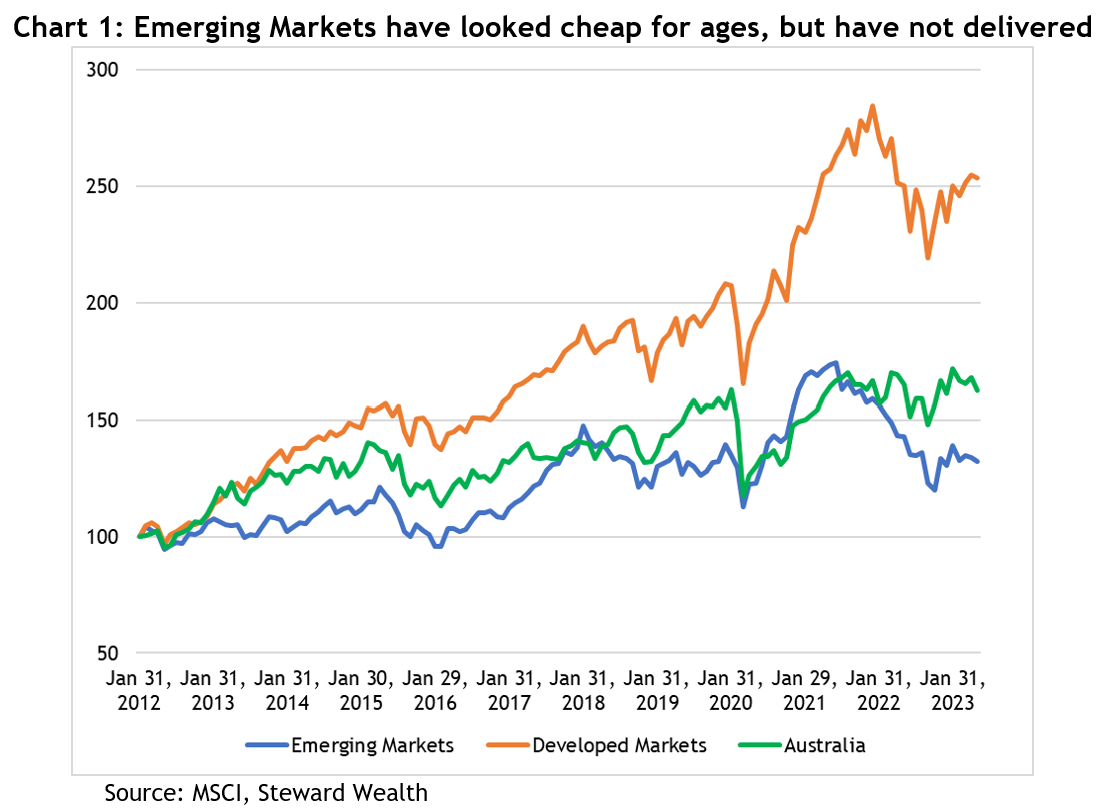
Over the past 10 years, the disparate collection of 24 countries bundled into “EM”, which range across Southeast Asia to South America, Africa, Eastern Europe, and the Middle East, has returned a fairly pedestrian 5 per cent per year. Over the same period, Australian shares have returned 8 per cent and global developed markets (ex-Australia) 13 per cent – see chart 1. 

Table showing the 2022 share market returns in local currencies


Not only that, but investors in emerging markets had to strap in for a bumpier ride. The range of the best to worst performing countries in the index averaged an 88 per cent gap over the past 11 years, way more than double the gap in the developed markets.

However, there have been times in the past when the emerging markets have trounced their developed counterparts: between 2000-2010, they notched up returns of 19 per cent per year, while the developed markets could barely scrape 5 per cent. So when they’re good, they’re very, very good.

How do the emerging markets shape up now? The typical long-term arguments for investing in the emerging markets revolve around demographics and GDP growth.

They are home to 87 per cent of the world’s population, including 77 per cent of the “Gen Z” contingent, with the fastest growing middle class, presumably all hankering for the usual consumer goods that go with it. Plus, they’ve driven 67 per cent of global GDP growth over the past decade and are forecast to account for about 60 per cent of total GDP by 2026, yet their combined share markets only represent 13 per cent of the market capitalization of international equities. You can almost see the blue sky.

The problem comes back to a financial truism: share markets are not necessarily representative of economies, in other words, strong economic growth does not necessarily result in strong share market returns. For example, Aoris Investment Management calculated that while the “BRICS” economies (Brazil, Russia, India, China, South Africa – once the hottest market grouping in the world) boasted exceptionally high annual average real GDP growth over the 10 years to 2018, average real corporate earnings growth actually fell by a whopping 9 per cent per year. So while the economies were almost doubling in size over those 10 years, earnings per share fell by more than 60 percent.

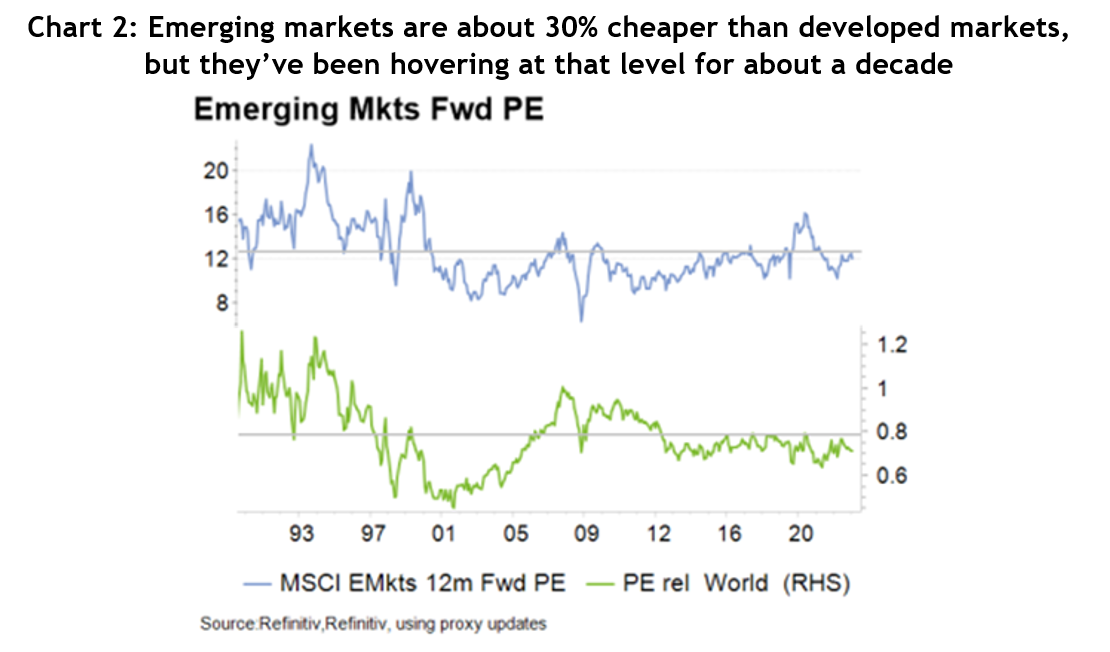
In the near term, the emerging markets do look cheap, especially compared to the United States. According to Refinitiv, the emerging markets are trading on a forward price to earnings ratio (so looking at the next 12 months) of 12x, which is a chunky 37 per cent discount to the US’s 19x. However, over the past 35 years the EM index has traded at an average discount of 20 per cent to the developed markets, and while it’s currently around 30 per cent, that’s where it’s hovered for more than a decade – see chart 2.


Bar graph showing the main negative influence of share prices was sentiment based on source of return 2022 AUD


Why the discount? First, there’s the inability of emerging markets companies to leverage high GDP growth into high earnings growth. Second, there’s the historical volatility compared to the developed markets. Third, the financial, energy and materials sectors make up 35 per cent of the EM index, and they normally trade on low PE ratios. To be fair, IT makes up 20 per cent of the index and includes some household names like Samsung, Taiwan Semiconductor, Tencent and Alibaba.

Zenith Investment Partners expect the emerging markets to deliver 11 per cent returns over the next 12 months based on a ‘soft landing’ scenario, that is, no recession. That compares to the US’s 7 per cent, the developed markets ex the US at 8 per cent, and Australia at 7. A lot of that premium is due to the relatively low PE ratio.

One factor that is always prominent for the emerging markets is the US dollar. When the USD is strong, like it has been over the last couple of years, the EM index struggles. Good luck trying to guess if the USD is going to get stronger or weaker over the next year or two.

Finally, the 600 pound gorilla in the emerging markets is, of course, China, which currently has a weighting of 31 per cent in the index, but accounts for 49 per cent of both EM GDP and stock market capitalization. At the moment, the index includes only one-fifth of China’s A shares, but it’s been rising over time.

It’s easy to argue what happens to China has an outsized influence on the EM index, and for now it’s a guessing game whether the government will step in to support the economy in a more meaningful way. There are many reasons to avoid China right now, but with a forward PE of only 11x, maybe they’re all priced in.

There’s no doubt emerging markets look cheap and have a role to play in a diversified portfolio, but smart investors need to be aware of the risks and shape their portfolio allocation accordingly.

The stock market doldrums

The stock market doldrums

Ancient sailors dreaded The Doldrums, a region near the equator whose atmospheric peculiarities would rob them of wind, leaving boats becalmed while the crew watched their supplies dwindle and cabin fever took hold. It took patience and faith that conditions would eventually improve, to see them through without doing anything they’d regret.

As the ASX 200 approaches the end of August, it is not only at the same level it was in May 2021, so two years in the doldrums, it’s also at the same level as immediately prior to the COVID correction of February 2020, that’s a full three and a half years of going sideways – see chart 1.


Table showing the 2022 share market returns in local currencies


But as anyone who’s been invested over that time, and as the chart makes obvious, the Australian share market has been through some eye-popping gyrations in the meantime, enough to test the patience of plenty of investors.

It is no doubt frustrating that the ASX 200 has been trading in a 500 point, or 7 per cent, range for the better part of the last two and a half years and disheartening that the market appears to be in the grip of another correction after such a promising June and July, but a look at history gives some helpful perspective.

First, markets going sideways is not at all unusual. After the Australian All Ordinaries (the predecessor to the ASX 200) fell 25 per cent in the famous crash of October 1987, it took six and a half years to get back to a new high. Then after the horror of the GFC, the peak from late 2007 wasn’t revisited for almost 12 years. Despite those and a few other noticeable spells in the doldrums, over that 42-year period, the index has grown at a compound rate of 6.5 per cent per year, meaning investors will have (on average) doubled their money every 11 years.

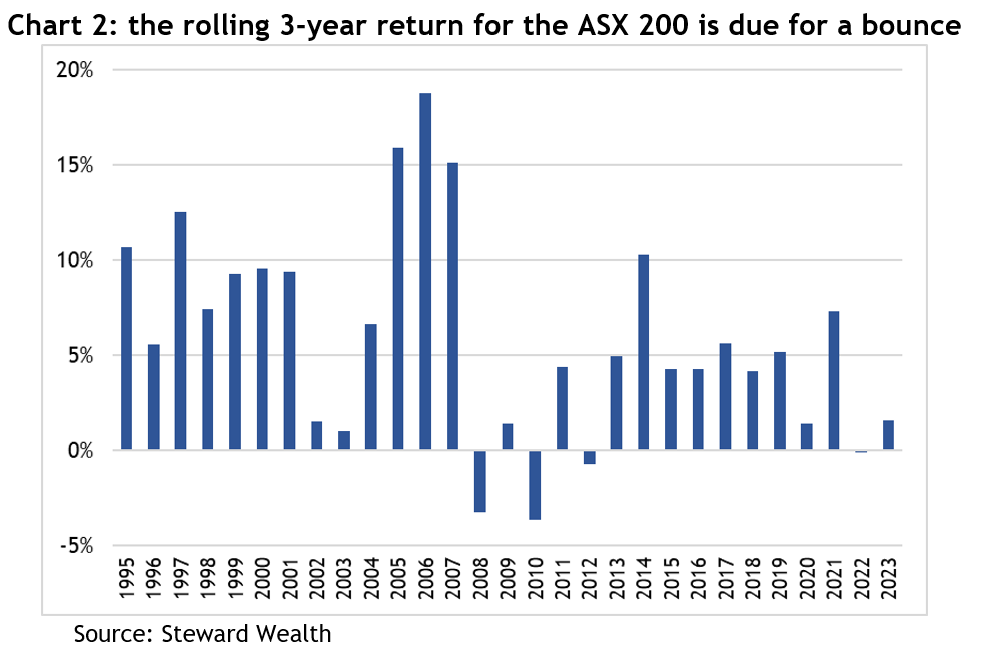
Second, if you look at the rolling three year returns over the past 30 years (so add the returns from 1993, 1994 and 1995 and divide by 3; then 1994, 1995 and 1996; and so on) the average has been a return of 5.9 per cent (which, coincidentally, is the same as the average annual return over the same period). The rolling three-year return to early August (well, not quite a full three years) has been 2.6 per cent, less than half the average, and it follows -0.1 per cent last year – see chart 2. In other words, while there are no guarantees about what will happen, history shows you can’t keep a good market down for ever.


Bar graph showing the main negative influence of share prices was sentiment based on source of return 2022 AUD


As for the correction markets are going through, the volatility arrived bang on its seasonal schedule. The US Volatility Index, referred to as the VIX, normally goes through a gradual decline from 19 to 17 between January to July, then rises sharply to peak at 22 by the beginning of October – see chart 3.


Line graph showing the probability of recession over the coming 12 months in the Fed's Survey of Professional Forecasters


For the ASX, August is usually the fourth lowest monthly return, and we still have September to look forward to, which is the lowest – see chart 4.

    Line graph showing the Morgan Stanley Leading Earnings Indicator against the Actual S&P 500 LTM EPS Growth Y/Y


    Also, prior to the pullback, the US market had risen 19 per cent between mid-March to the end of July, without a serious pullback. The sheer weight of accumulated trading profits together with sentiment readings hitting extreme bullishness primed the market for a breather.

    But even the pullbacks we’ve had this year have been a bit doldrumy. The biggest drawdown for the ASX 200 so far has been 8 per cent, back in March. Over the past 30 years, the average drawdown during a calendar year has been more than 12 per cent. That kind of volatility should be considered as part and parcel of investing.

    Now for the silver linings. All those return statistics so far have ignored dividends. Over the past five financial years, the capital return from the Betashares A200 ETF (the cheapest ETF of the top 200 Australian shares available on the market), averaged 3.3 per cent per year. Adding dividends took that to 7.6 per cent, and franking credits made it a respectable 8.9 per cent. Dividends matter.

    The other safeguard investors can take advantage of is portfolio diversification. Different parts of the world grow at different rates, for example, the State Street S&P 500 ETF (SPY), returned 17.8 per cent per year over the same five-year period, exactly double the ASX.

    Similarly, an allocation to fixed income such as private credit, offered attractive yields of as much as eight per cent.

    Share markets go up, down and sideways, but thankfully, over the longer-term, they invariably trend upwards. In times when markets are becalmed, smart investors should be like the ancient sailors: be patient and have faith, a tailwind will come along again.