0399757070
Private credit is redefining fixed income

Private credit is redefining fixed income

Private credit is redefining fixed income as an asset class, with returns as high as 10 per cent plus attracting an explosion of interest. But all that attention has drawn the usual cowboy operators, so smart investors need to be careful.

What is private credit?

Private credit is investing in loans made by non-bank lenders that can cover a broad range of purposes and borrowers.

Normally a private credit lender raises money from investors and doesn’t use debt, so zero gearing. That makes these companies very different to a normal bank, where the loan book will be dozens of times bigger than the bank’s equity.

Taking out a private credit loan is almost invariably much more expensive than borrowing from a commercial bank, with interest rates currently as high as 12 to 13 per cent. So why are borrowers flocking to private credit lenders?

Why the boom in private credit?

After the GFC, banking regulators around the world forced commercial banks to beef up their balance sheets, requiring them to back their loans with more equity to absorb potential losses, especially loans to sectors that had a history of high default rates, like commercial building and property development. That same regulatory crackdown caught up with the Australian banks in 2016, when their regulator, APRA, declared it wanted them to be the best capitalised banks in the world.

After that, it became far more profitable for Australian banks to lend for residential property, because they didn’t have to set aside as much equity on their balance sheets. Consequently, they all but abandoned some parts of the commercial lending market.

Spotting a huge, and growing, opportunity, private credit groups sprang up to fill the gap. Often staffed by the same experienced credit teams from the big banks who were now twiddling their thumbs, they got backing from investors with the prospect of outsized returns relative to the risk.

The result: EY estimates the Australian private credit market grew from $35 billion in 2016 to $109 billion by the end of 2022, a 21 per cent compounded annual growth rate. The global private credit market was estimated to have grown at 15 per cent per year between 2000 to 2022, reaching more than $1 trillion.

As often happens, Australia is a bit behind the US, where Foresight Analytics estimates non-bank lenders control about 50 per cent of the market for commercial real estate loans, and in Europe it’s about 25 per cent, while in Australia it’s around 10 per cent, but growing strongly.

What’s the attraction for investors?

Fixed income plays two roles in a portfolio: first, to provide some income, and second, to have little, if any, correlation to growth assets like shares, in other words, be a defensive asset.

Income-wise, over 2023 there were a number of private credit funds that returned well above 10 per cent, even as high as 12 per cent. For context, the Australian 10-year bond yield peaked at 4.95 per cent.

In terms of low correlation to shares, the word “private” is the critical part. Unlike corporate or government bonds, private loans are not normally traded on public markets, which makes them far less volatile because there is no day-to-day repricing, the fancy name for which is “mark-to-market risk”. In 2022, when bonds and shares both fell heavily, well-managed private credit funds continued to pay their interest and the unit price never changed.

The other attraction is security. For example, a private credit fund that lends to property developers will take a mortgage over the project, including the land, just the same as when a bank lends to a homeowner. Usually, the lenders require a loan to valuation ratio between 60-65 per cent. That means if the deal goes pear-shaped and the private credit manager repossesses the property, it has a 35-40 per cent buffer before investors lose any money.

In addition, the lender will also normally take a charge over other company assets as well as get a directors’ guarantee, meaning their personal assets are on the line as well. Plus, Australian lending rules are tilted very much in favour of the lender, enabling them to impose onerous covenants on the borrower.

There’s a lot to like about investing in private credit, but its popularity has drawn a lot of new operators, not all of which are experienced in credit analysis and some of which are under pressure to get investors’ money to work so are not as fussy about who they lend to. On top of that, some private credit deals will tie up your capital for up to 18 months, or even “semi-liquid” funds will take 2-3 months to get your money back. It pays to do your homework carefully.

Interview with Partners Group co-founder Urs Wietlisbach

Interview with Partners Group co-founder Urs Wietlisbach

Urs Wietlisbach is one of the three founders of Swiss private equity firm, Partners Group, which has grown to manage more than US$130 billion. James Weir interviewed Urs on the outlook for private equity and whether higher interest rates changes the outlook for returns. Watch until the end to get Urs’s view on the prospects for the Global Value Fund as it prepares to sell more than 20 mature assets.

Central banks and interest rates: myths vs reality

Central banks and interest rates: myths vs reality

In June of last year, Jerome Powell, the Federal Reserve Chair, admitted, “We now understand better how little we understand about inflation.”

That alarming, but at least honest observation from the world’s most powerful central banker, comes despite the Fed employing more than 400 Ph.D. economists who enjoy access to the world’s most up to date data.

What is truly disconcerting though, is that governments around the world have happily passed on responsibility for managing inflation, and usually unemployment as well, to central banks via the control of monetary policy. But they essentially have only one tool to do that: interest rates.

Passing on that responsibility to central banks rests on some long-standing beliefs around monetary policy that sound fine in theory but lack real world evidence to back them up.

For example, the presumption that raising or lowering interest rates can control inflation. During the 2010’s, central banks around the world were concerned about deflation, that is, inflation being too low, so the biggest central banks in the world cut interest rates to never before seen levels.

The United States had effectively zero interest rates between 2010 and 2016, yet inflation averaged only 1.6 per cent per year over that period. Over those same seven years interest rates in the Euro Area averaged about half a per cent but inflation was -0.1 per cent, and in Japan rates were stuck at zero yet inflation averaged only 0.2 per cent.

Likewise, if high interest rates are supposed to cure inflation, how is it that Argentina can have an interest rate of 78 per cent yet inflation is 102 per cent? Defenders of orthodox monetary policy would say Argentina’s long been a basket case, but that’s the point, its interest rate has been above 40 per cent for the past five years but it has failed to control inflation.

Another shibboleth of monetary policy is the so-called Phillips Curve, which asserts that inflation and unemployment are inversely related. That’s why the Reserve Bank and the Fed regularly talk about the 50-year low unemployment levels and the inflationary risk from the price-wage spiral. The theory is that low unemployment causes such high demand for workers that they will flex their bargaining power and drive up wages, so raising inflation.

That may have been an issue 50-plus years ago when more than 60 per cent of the workforce belonged to a union, but with now only 9 per cent of Australia’s private sector in a union, things have changed. Wage increases have been below the CPI for the past nine consecutive quarters in Australia, see chart 1, and real average hourly earnings in the US declined by 1.3 per cent over the year to February, meaning it has been a deflationary influence in both countries.


Chart 1: Australian wages growth has lagged the CPI for the past 9 consecutive quarters

Chart 1: Australian wages growth has lagged 
the CPI for the past 9 consecutive quarters


In fact, Quay Global Investors analysed the US inflation and unemployment data between 1985-2020 and found there was no meaningful relationship – see chart 2. 


Chart 2: there has been no meaningful relationship between inflation and unemployment in the US over the past 40 years

Chart 2: there has been no meaningful relationship between 
inflation and unemployment in the US over the past 40 years


However, there have now been five different analyses covering the US, UK and Australia, that have each found corporate profiteering accounts for the majority of inflationary pressures in each country. That is reflected in US corporate profit margins hitting a 70-year high last year. One of those studies dubbed the phenomena “excuseflation”, because companies were using the first bout of inflation in years as cover to raise prices as much as they felt the market would bear.

Yet central banks continue to focus on consumers and households, with no mention of the role played by companies. By contrast, at the start of the pandemic the Japanese government made it clear to companies they would be watching for opportunistic price gouging, resulting in an inflation rate that peaked at about half the rest of the developed world, despite importing almost all their food and energy.

Also, monetary policy is frequently, and correctly, referred to as a blunt instrument because it can only work indirectly, by encouraging or discouraging people and businesses to borrow money and it can take ages to have any effect. The usual expression is that it operates “with long and variable lags.” However, all the central banks continue to say they will be “guided by the data”, but that data, be it the CPI, unemployment or industrial data, is all backward looking. There is an obvious logical mismatch.

Another logical mismatch is expecting that raising interest rates, which can only influence demand driven inflation, will do any good against supply driven inflation. For example, the floods last year contributed to double digit food inflation. Obviously, families have to eat, so raising interest rates is entirely non-sensical as a way to counter those inflationary effects.

The very clear problem is that by sticking dogmatically to those underlying economic theories, without accounting for the lack of real world evidence to back them up, central banks risk pushing economies into recession. Central bankers are muscling up trying to show they can be as tough as Paul Volcker, who was credited with stopping the inflationary episode of the 1970s-80s, but there are compelling arguments to suggest he gets way too much credit. They insist the pain of inflation, which by their own admission they don’t fully understand, is worse than the pain of people losing their jobs or their houses.

Interest rates can definitely play a role, after all, if central banks push interest rates high enough they will inevitably force a recession, which will certainly have deflationary consequences, but it’s ridiculous to argue that’s the only way to address the problem.

There are no easy solutions to controlling something as mysterious as inflation in a modern, complex economy, however, acknowledging the critical role fiscal policy plays would be a start. Professor Isabella Weber of the University of Massachusetts, who specialises in inflation, argues governments should explore strategic price controls, which have been extremely effective in the past, such as during war times.

However, until the dogmas of orthodox economic policy are left behind, smart investors need to remember to base their investment decisions on what they think will happen, not what should happen.

Are Australian banks safe?

Are Australian banks safe?

Spoiler alert: Australian banks are safe and what’s happened in the US and with Credit Suisse over the past week does not represent a threat to your bank deposits nor to the Australian economy in general.

The US

Silicon Valley Bank (SVB) was the sixteenth largest bank in the US, with $209 billion in assets, and collapsed last week largely due to poor management.

With the explosion in venture capital investing over the pre-COVD period, SVB had experienced incredible growth by banking standards: deposits had quadrupled in five years. However, it had a massive concentration of depositors, 93% were corporate compared to a median of only 34% in the US’s 10 largest banks, and most were venture capital-backed businesses with relatively large deposits. This left the bank vulnerable to an old-fashioned run on its deposits.

In an effort to make a bit of extra money, SVB had invested a lot of those deposits into US government bonds, which are super safe, but some were long dated, out to a few years. If they had have invested in 3-month bonds, there wouldn’t have been a problem, but the bank chased the higher yield of 3 and 5-year bonds. This left the bank vulnerable to a rise in interest rates, which reduces the value of bonds. Given SVB’s CEO sat on the board of the San Francisco Fed, which had been warning of ongoing rate hikes, you can see how poor management was.

With venture capital investors slowing their rate of handing out money since last year, some of those depositors were forced to draw on their deposits to run their companies and fund basic working capital.

SVB was forced to sell some of its government bonds and take a loss on them, which was reported to the market and they unsuccessfully tried to tap shareholders for $2.25 billion in new equity. This caused some of the venture capitalists to worry that if more and more depositors started wanting their money back, SVB wouldn’t be able to meet the demand, so they jumped on Twitter or sent text messages telling their investee companies (the depositors) to get their money out ASAP. This caused that old fashioned bank run to snowball, and at one point SVB had copped $42 billion worth of withdrawals in six hours.

By Thursday of last week, it was lights out for SVB. The Federal Deposit Insurance Corporate (FDIC) moved in that day, stayed all night assessing the state of withdrawal requests, and announced it had taken control of the bank by Friday. That’s the day all hell broke loose for US banking shares, with the regional bank index falling some 16%. By Sunday night the Federal Reserve announced all depositors would be made good, but equity investors will lose their money, which is exactly the way it’s supposed to work: depositors have faith a bank will look after their money, while investors take on the risk of a company screwing up.

In summary, the SVB situation was idiosyncratic, i.e. a situation peculiar to that bank. There have since been two other smaller US banks closed down by the FDIC, mainly because they had excessive amounts of deposits tied up in crypto assets. Certainly, it wouldn’t have happened if the Fed had not been raising rates, but there’s a popular expression on Wall Street that the Fed keeps raising until something breaks.

It’s worth bearing in mind, the US banking industry is structured very differently to ours. There are literally hundreds of small banks, a legacy of the Great Depression era. Since 2001, there have been 563 banks go belly up in the US, with about 500 of those as a result of the GFC. If Australia’s banking system was able to withstand that, it will be fine with what’s happening now.

Credit Suisse

Credit Suisse has been a mess for years, with a string of scandals and poor investments going back over decades, which culminated in a growing number of clients taking their money and business elsewhere by the end of last year. The bank’s CEO tried to woo back customers, but last week the Securities and Exchange Commission (SEC) in the US (equivalent to ASIC here), queried the bank’s annual report. Combined with the SVB situation, panic started to set in.

Then on Wednesday, CS’s biggest shareholder, the Saudi National Bank, said it wasn’t going to be able to invest any more into the bank because it was hitting regulatory limits. That caused CS’s share price to plunge, and they asked the Swiss central bank to issue a statement of support, which it did.

However, other banks around the world started worrying about counterparty risk, in other words, looking at contracts where CS was on the other side, and trying to buy protection. Pretty soon, the cost of that protection skyrocketed, implying a high likelihood of default.

A you can imagine, a lot of investors started having flashbacks to the death of Lehman Brothers in 2009, and worrying what threats CS poses to the global banking system. However, CS has substantial liquid assets it can call on as well as access to central bank lending facilities. The CEO has said it has sufficient cash-like liquid assets to pay back half its deposit liabilities and loans from other banks.

Subsequently, the Swiss National Bank has said CS “meets the higher capital and liquidity requirements applicable to systemically important banks” and it stands ready to provide CS with liquidity. CS has announced it will borrow SFR50 billion to meet any liquidity demands from depositors and buy back a bunch of debt that was trading way below its issue price.

Is this the start of another GFC?

No, it’s a very different situation. However, stress levels in financial markets have certainly risen which is being reflected in bond market dislocation, which will result in higher funding costs for banks. It depends on how markets and central banks respond to a crisis, and so far, the US Fed and the Swiss National Bank have done very well.

How will it affect Australian banks?

In 2016, the Australian bank regulator, APRA, announced it wanted Australian banks to have “the strongest balance sheets in the world”. At the time the banks pushed back, but lost, and now their balance sheets are indeed very strong.

Their funding costs may rise a bit, and access to capital markets may be restricted while markets are unsettled, but there is no risk of any bank failures in this country.

As for depositors, the federal government already guarantees deposits up to $250,000 and we’ve seen the US regulator increase that to pretty much no limit for the SVB depositors.

A silver lining?

It is entirely possible this will cause central banks around the world to pause their interest rate rises while markets are in turmoil.

The link between lending and property; what’s in store for 2023?

The link between lending and property; what’s in store for 2023?

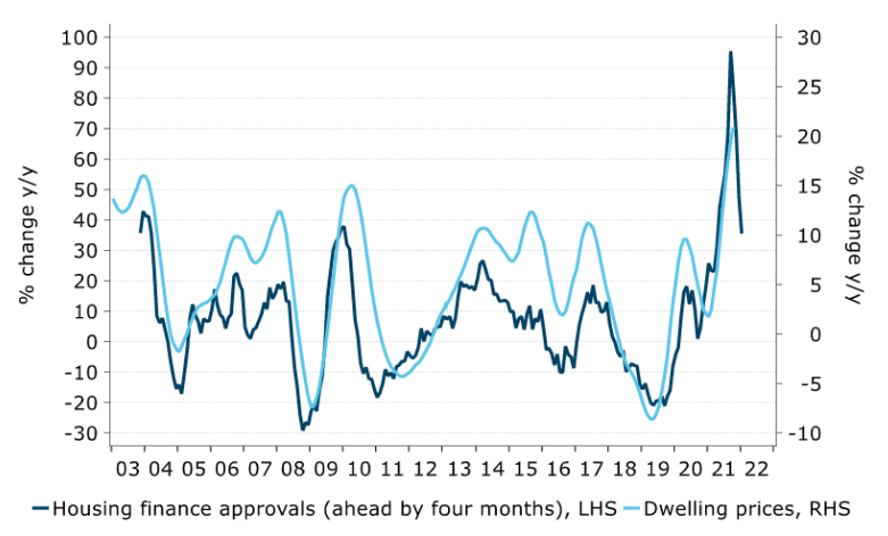
The correlation between lending approvals and property prices has long been established as providing a 4-6 month ‘crystal ball’ into future property prices. The relationship can be clearly seen in the following chart which plots each data series over the past 20 years.


The correlation between lending approvals and property prices has long been established with loan approvals generally providing a 4-6 month ‘crystal ball’ into future property prices. The relationship can be clearly seen in the following chart which plots each data series over the past 20 years. Source: ANZ      Property prices declining Let’s first establish where the property market currently sits. CoreLogic’s national Home Value Index (HVI) fell for the sixth consecutive month, as values across the nation retreated a further -1.2% in October. Annual declines are currently isolated to Sydney, Melbourne and Hobart yet there is some evidence the rate of decline is now gathering pace in the other capital cities, especially Brisbane.    Source: CoreLogic It was not only the capital cities which experienced the pullback. CoreLogic’s Regional Market Update showed residential property values in six of the twenty-five most popular lifestyle markets recorded falls of 6% or more last quarter. This included Richmond-Tweed (-11.7%), Southern Highlands and Shoalhaven (-7.1%), Sunshine Coast (-7.1%), Gold Coast (-6.4%), Illawarra (-6.1%) and Newcastle and Lake Macquarie (-6.0%). From September 2020 to April 2022, national house values rose 32.5%, while unit values rose by a milder 16.1% over the same period. Since peaking in April, house values are now reversing at a more rapid rate, falling -5.3%, while values across the medium to high-density sector have declined by a more moderate -3.0%.  How does borrowing capacity affect overall lending? The amount a bank will lend a prospective borrower is largely determined by two factors; interest rates and credit policy. In 2019, in response to the pandemic, The Reserve Bank of Australia (RBA) quickly cut its official interest rate to 0.1%. At the same time the banking regulator, APRA, removed the minimum 7.25% interest rate required to be used when banks assess the serviceability of a loan. In a short space of time borrowers had access to much higher levels of debt and overall lending accelerated to all-time highs. Since May, the RBA has raised the official interest rate by 2.75%. To put this in perspective, a joint household with disposable income of $150,000 and expenses in line with the Household Expenditure Measure (HEM) has had their borrowing capacity lowered by 20-25%. To further add to the tightening, the buffer used for the assessment of a loan has been increased from 2.5 to 3.0% above the offered rate.   What does the current lending data tell us? Whilst borrowing capacity is not an exclusive influence on overall lending, The Australian Bureau of Statistics’ September Lending Indicator’s report show that the value of new borrower loan commitments has fallen 18.5% over the first three quarters of this year, with owner-occupier loans contributing most to the decline. These falls are notably more than that seen in property prices over the same period.    Source: Australian Bureau of Statistics, Lending Indicators September 2022    Source: Australian Bureau of Statistics, Lending Indicators September 2022 During September 2022, in seasonally adjusted terms for owner-occupier housing loan commitments, largest falls were recorded in the Northern Territory (25.2%), Queensland (13.8%) and Western Australia (13.2%) further reinforcing that the softening is now spreading outside of the two largest markets of Sydney and Melbourne.   Source: Australian Bureau of Statistics, Lending Indicators September 2022  Investor lending also saw declines, however not to the degree of owner-occupied commitments. Tasmania led the way with a 26.6% decline followed by the ACT (12.2%) and Western Australia (8.7%). This goes some way to partly explaining the more modest declines in units versus house values across the nation.    Source: Australian Bureau of Statistics, Lending Indicators September 2022  Crash or correction? With overall property values now 6% lower than their peak and an aggressive interest rate tightening cycle, many commentators warn that a housing market crash is imminent.  For a property market to

Source: ANZ


Property prices declining

Let’s first establish where the property market currently sits.

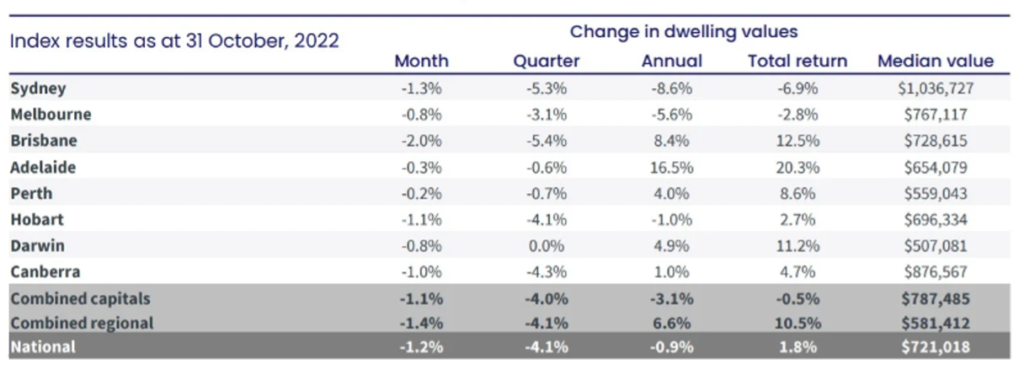
CoreLogic’s national Home Value Index (HVI) fell for the sixth consecutive month, as values across the nation retreated a further -1.2% in October. Annual declines are currently isolated to Sydney, Melbourne and Hobart yet there is some evidence the rate of decline is now gathering pace in the other capital cities, especially Brisbane.


Core logic change in swelling values

Source: CoreLogic


It was not only the capital cities which experienced the pullback. CoreLogic’s Regional Market Update showed residential property values in six of the twenty-five most popular lifestyle markets recorded falls of 6% or more last quarter. This included Richmond-Tweed (-11.7%), Southern Highlands and Shoalhaven (-7.1%), Sunshine Coast (-7.1%), Gold Coast (-6.4%), Illawarra (-6.1%) and Newcastle and Lake Macquarie (-6.0%).

From September 2020 to April 2022, national house values rose 32.5%, while unit values rose by a milder 16.1% over the same period. Since peaking in April, house values are now reversing at a more rapid rate, falling -5.3%, while values across the medium to high-density sector have declined by a more moderate -3.0%.


How does borrowing capacity affect overall lending?

The amount a bank will lend a prospective borrower is largely determined by two factors; interest rates and credit policy. In 2019, in response to the pandemic, The Reserve Bank of Australia (RBA) quickly cut its official interest rate to 0.1%. At the same time the banking regulator, APRA, removed the minimum 7.25% interest rate required to be used when banks assess the serviceability of a loan. In a short space of time borrowers had access to much higher levels of debt and overall lending accelerated to all-time highs.

Since May, the RBA has raised the official interest rate by 2.75%. To put this in perspective, a joint household with disposable income of $150,000 and expenses in line with the Household Expenditure Measure (HEM) has had their borrowing capacity lowered by 20-25%. To further add to the tightening, the buffer used for the assessment of a loan has been increased from 2.5 to 3.0% above the offered rate.


What does the current lending data tell us?

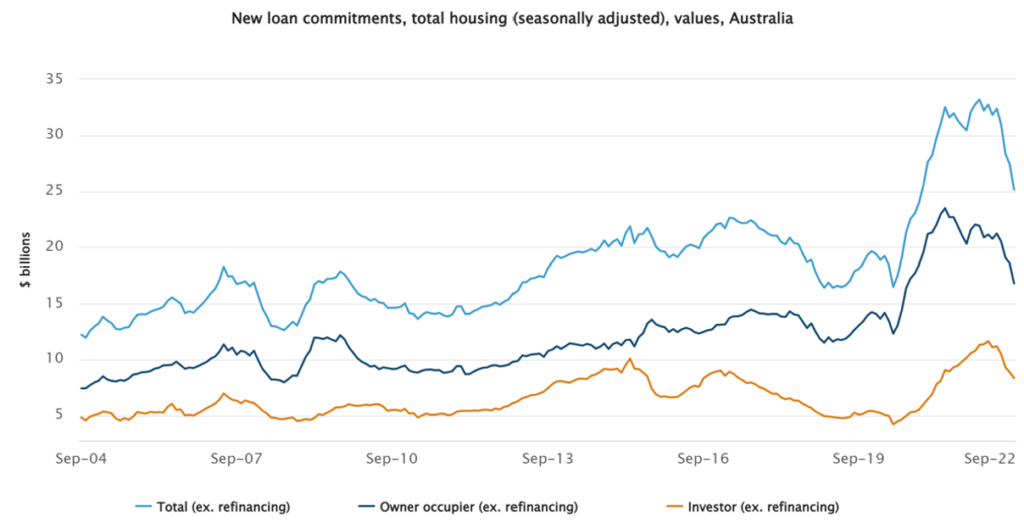
Whilst borrowing capacity is not an exclusive influence on overall lending, The Australian Bureau of Statistics’ September Lending Indicator’s report show that the value of new borrower loan commitments has fallen 18.5% over the first three quarters of this year, with owner-occupier loans contributing most to the decline. These falls are notably more than that seen in property prices over the same period.


Lending indicators

Source: Australian Bureau of Statistics, Lending Indicators September 2022


new loan commitments

Source: Australian Bureau of Statistics, Lending Indicators September 2022


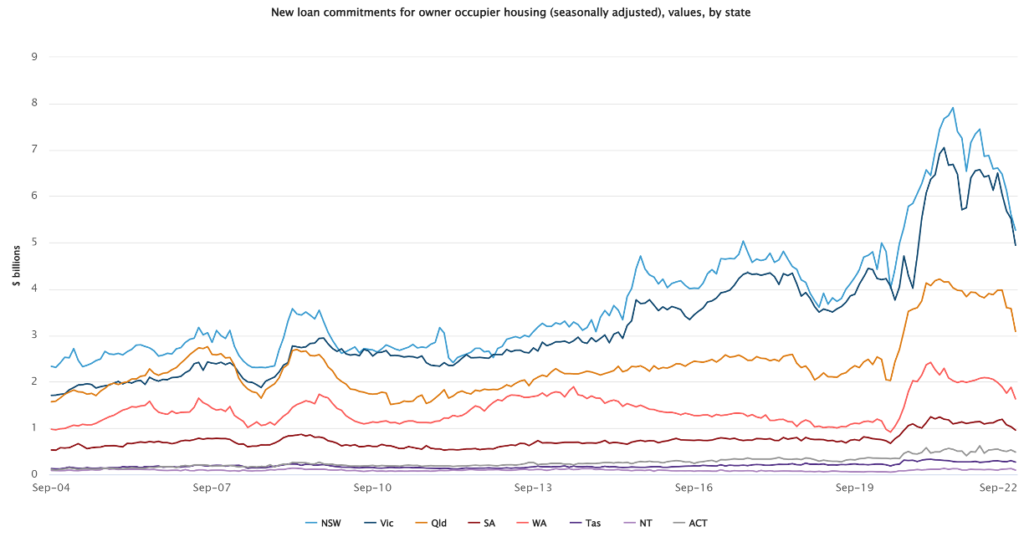
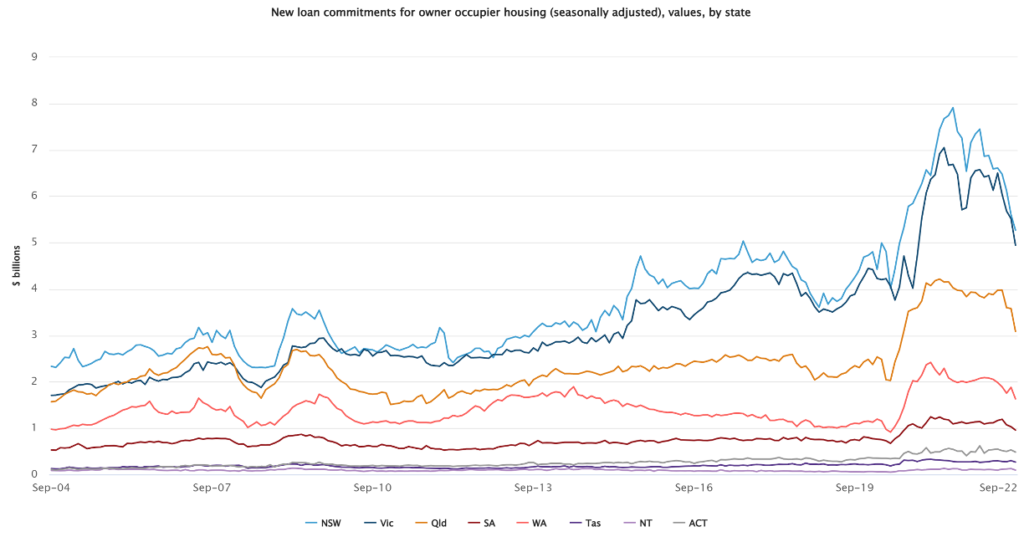
During September 2022, in seasonally adjusted terms for owner-occupier housing loan commitments, largest falls were recorded in the Northern Territory (25.2%), Queensland (13.8%) and Western Australia (13.2%) further reinforcing that the softening is now spreading outside of the two largest markets of Sydney and Melbourne.


new loan commitments owner occupier

Source: Australian Bureau of Statistics, Lending Indicators September 2022


Investor lending also saw declines, however not to the degree of owner-occupied commitments. Tasmania led the way with a 26.6% decline followed by the ACT (12.2%) and Western Australia (8.7%). This goes some way to explaining the more modest declines in units versus house values across the nation.


new loan commitment investor housing

Source: Australian Bureau of Statistics, Lending Indicators September 2022


Crash or correction?

With overall property values now 6% lower than their peak and an aggressive interest rate tightening cycle, many commentators warn that a housing market crash is imminent.

For a property market to “crash” a large number of owners are forced to sell into a falling market, with limited buyers, as they can no longer afford to make their mortgage repayments. The rate of delinquency loans, or loans in arrears for more than 30+ days, is a key metric in predicting a crash.

The latest data released by Fitch Ratings, show mortgages that are 30 and 90 days in arrears were down by 0.07% to 0.82% and 0.04% to 0.4% respectively for the 3 months to June 30 – the lowest level since tracking began in 2002. As more recent data is released, delinquency rates will be something to watch as the aggressive tightening cycle further filters through to the broader economy.


What will 2023 bring?

The value of new lending will be largely dependent on where the RBA take interest rates over the next year, however, if lending continues to act as a precursor for property, we can expect house prices will continue to ease at least throughout the first half of 2023.

If you’d like to discuss your specific circumstances, or simply interested in what lending options are available, please do get in touch.