The correlation between lending approvals and property prices has long been established as providing a 4-6 month ‘crystal ball’ into future property prices. The relationship can be clearly seen in the following chart which plots each data series over the past 20 years.
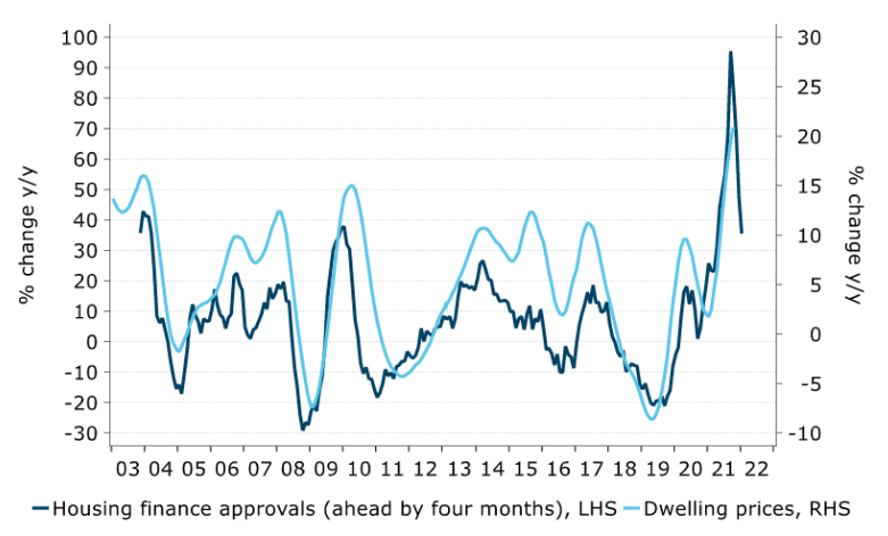
Source: ANZ
Property prices declining
Let’s first establish where the property market currently sits.
CoreLogic’s national Home Value Index (HVI) fell for the sixth consecutive month, as values across the nation retreated a further -1.2% in October. Annual declines are currently isolated to Sydney, Melbourne and Hobart yet there is some evidence the rate of decline is now gathering pace in the other capital cities, especially Brisbane.
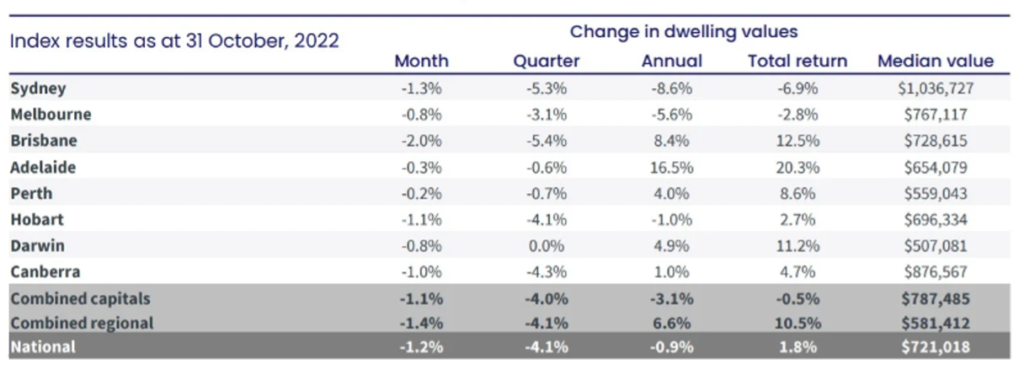
Source: CoreLogic
It was not only the capital cities which experienced the pullback. CoreLogic’s Regional Market Update showed residential property values in six of the twenty-five most popular lifestyle markets recorded falls of 6% or more last quarter. This included Richmond-Tweed (-11.7%), Southern Highlands and Shoalhaven (-7.1%), Sunshine Coast (-7.1%), Gold Coast (-6.4%), Illawarra (-6.1%) and Newcastle and Lake Macquarie (-6.0%).
From September 2020 to April 2022, national house values rose 32.5%, while unit values rose by a milder 16.1% over the same period. Since peaking in April, house values are now reversing at a more rapid rate, falling -5.3%, while values across the medium to high-density sector have declined by a more moderate -3.0%.
How does borrowing capacity affect overall lending?
The amount a bank will lend a prospective borrower is largely determined by two factors; interest rates and credit policy. In 2019, in response to the pandemic, The Reserve Bank of Australia (RBA) quickly cut its official interest rate to 0.1%. At the same time the banking regulator, APRA, removed the minimum 7.25% interest rate required to be used when banks assess the serviceability of a loan. In a short space of time borrowers had access to much higher levels of debt and overall lending accelerated to all-time highs.
Since May, the RBA has raised the official interest rate by 2.75%. To put this in perspective, a joint household with disposable income of $150,000 and expenses in line with the Household Expenditure Measure (HEM) has had their borrowing capacity lowered by 20-25%. To further add to the tightening, the buffer used for the assessment of a loan has been increased from 2.5 to 3.0% above the offered rate.
What does the current lending data tell us?
Whilst borrowing capacity is not an exclusive influence on overall lending, The Australian Bureau of Statistics’ September Lending Indicator’s report show that the value of new borrower loan commitments has fallen 18.5% over the first three quarters of this year, with owner-occupier loans contributing most to the decline. These falls are notably more than that seen in property prices over the same period.
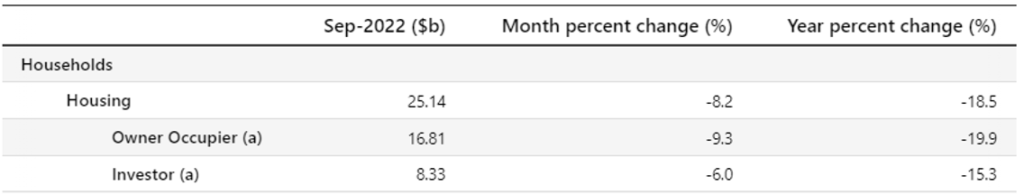
Source: Australian Bureau of Statistics, Lending Indicators September 2022
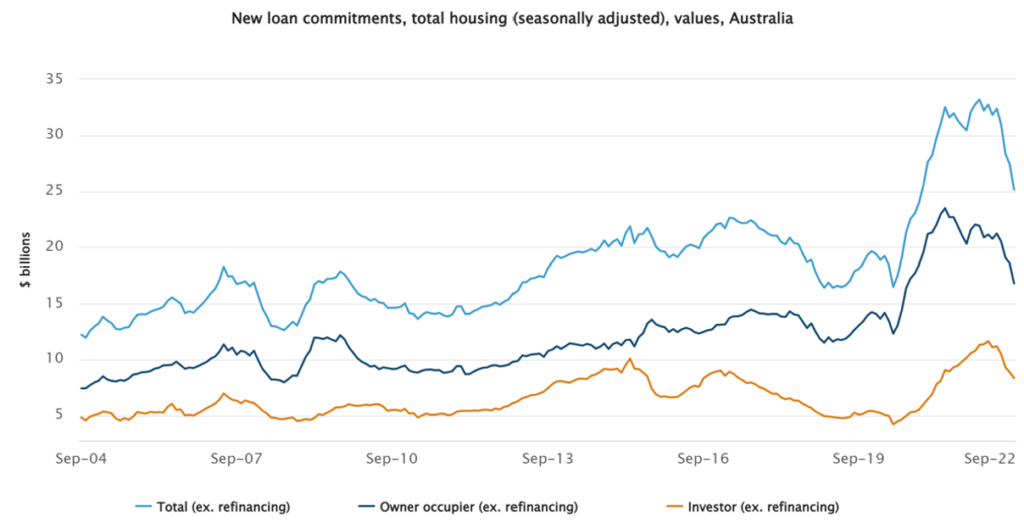
Source: Australian Bureau of Statistics, Lending Indicators September 2022
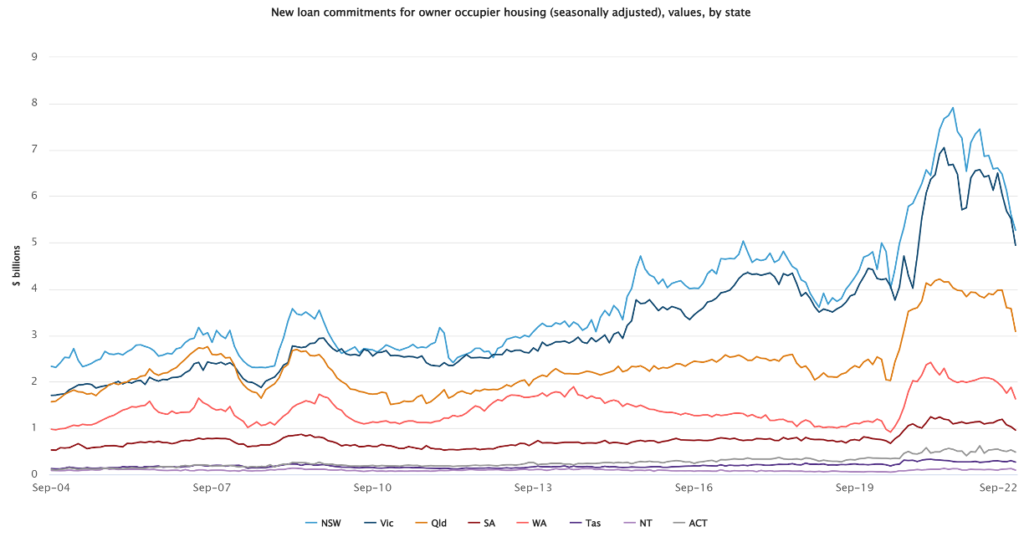
During September 2022, in seasonally adjusted terms for owner-occupier housing loan commitments, largest falls were recorded in the Northern Territory (25.2%), Queensland (13.8%) and Western Australia (13.2%) further reinforcing that the softening is now spreading outside of the two largest markets of Sydney and Melbourne.
Source: Australian Bureau of Statistics, Lending Indicators September 2022
Investor lending also saw declines, however not to the degree of owner-occupied commitments. Tasmania led the way with a 26.6% decline followed by the ACT (12.2%) and Western Australia (8.7%). This goes some way to explaining the more modest declines in units versus house values across the nation.

Source: Australian Bureau of Statistics, Lending Indicators September 2022
Crash or correction?
With overall property values now 6% lower than their peak and an aggressive interest rate tightening cycle, many commentators warn that a housing market crash is imminent.
For a property market to “crash” a large number of owners are forced to sell into a falling market, with limited buyers, as they can no longer afford to make their mortgage repayments. The rate of delinquency loans, or loans in arrears for more than 30+ days, is a key metric in predicting a crash.
The latest data released by Fitch Ratings, show mortgages that are 30 and 90 days in arrears were down by 0.07% to 0.82% and 0.04% to 0.4% respectively for the 3 months to June 30 – the lowest level since tracking began in 2002. As more recent data is released, delinquency rates will be something to watch as the aggressive tightening cycle further filters through to the broader economy.
What will 2023 bring?
The value of new lending will be largely dependent on where the RBA take interest rates over the next year, however, if lending continues to act as a precursor for property, we can expect house prices will continue to ease at least throughout the first half of 2023.