No need for investors to fear QE taper

No need for investors to fear QE taper

At last month’s Portfolio Construction Forum summit in Sydney, almost every presenter – from economists to fund managers – was critical of central banks for “artificially inflating asset prices” with “excessive liquidity”, leaving financial markets “addicted to easy monetary policy”.

Indeed, US journalist Christopher Leonard recently published a book called The Lords of Easy Money: How the Federal Reserve Broke the US Economy, which “tells the shocking, riveting tale of how quantitative easing is imperilling the American economy”.

On the face of it, the numbers are confronting. Before the start of the COVID-19 crisis in February 2020, the US Federal Reserve’s balance sheet stood at $US4.4 trillion. Two years later, after a program of buying government bonds and mortgage-backed securities known as quantitative easing (popularly referred to as QE), it has more than doubled to $US8.9 trillion ($12.3 trillion).

Similarly, the Reserve Bank of Australia has also conducted its own QE program, expanding its balance sheet from $180 billion before the pandemic to about $650 billion.

It sounds intuitive and seductively simple: central banks print money; they’ve expanded their balance sheets by trillions of dollars; all that newly printed money has inflated asset prices. Unfortunately, it is dead wrong but, as is often the case in financial markets, it’s the prevailing narrative that’s been repeated so often that people believe it.

In his book, Leonard describes how, under the QE program, the Fed will buy bonds off a bank by crediting that bank’s “reserve account”, which, in simple terms, is a special account that only banks who transact directly with the central bank can have. He then claims those banks are free to use those reserves “to buy assets in the wider marketplace”.

That just isn’t how it works.

What really happens is far more complicated, and far less exciting. Those reserves, which in Australia are called exchange settlement reserves, are a special kind of currency that is only transacted between the central bank and other commercial banks to make sure the billions of transactions the banks undertake daily settle every day. Those reserves are not the same as the cash used in the real world.

Central banks will also buy bonds from other institutions that don’t have a special reserve account with them, in which case they do settle with normal cash. However, according to the Reserve Bank’s website, those institutions are all credit unions, smaller banks or insurance companies. If an institution like that is holding bonds in the first place, which are classified as a defensive, fixed income asset, it is pretty much guaranteed they are not going to take the money and punt it on cryptocurrencies.

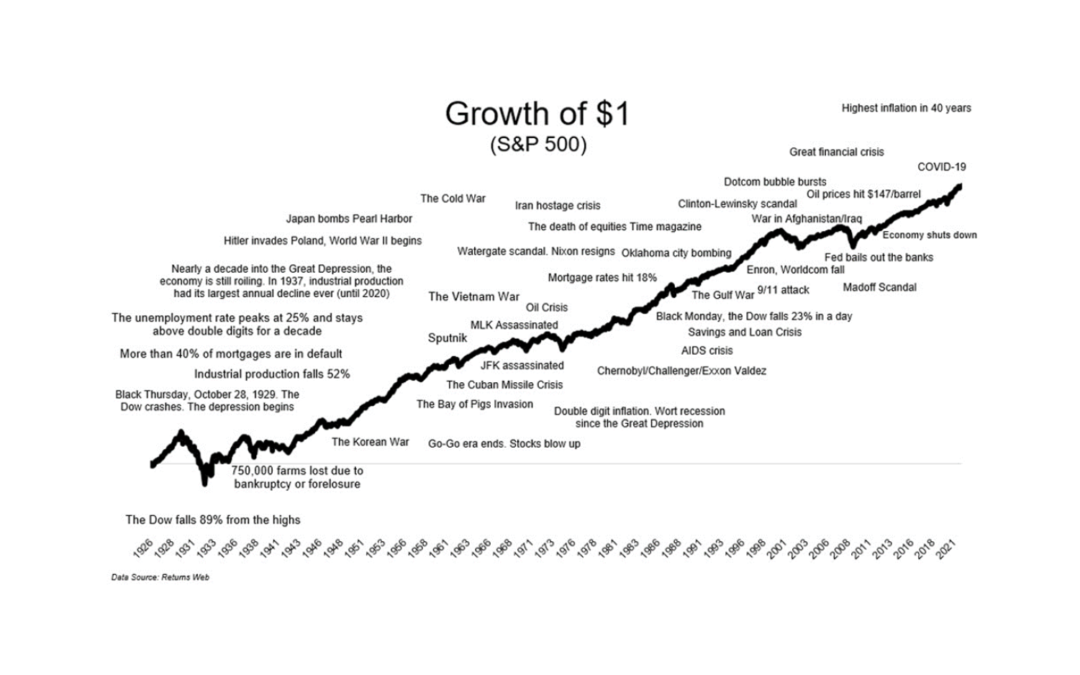
So what caused financial markets to rebound so aggressively if it wasn’t central banks printing money? It was governments, by injecting trillions of dollars, pounds, euros, yen and other currencies into economies to support them during the COVID-19 crisis.

That money was created out of thin air and is still circulating around their respective economies. In fact, governments create money in a keystroke via fiscal policy every day, with things like social security payments or any other spending program.

Many will argue it was central bank QE programs that allowed governments to run deficits – but this is not true either. Just like before QE, it’s the government spending money into existence that provides the cash for banks and others to buy the bonds. Central banks are not required to do anything other than conduct their normal daily monetary operations of targeting interest rates.

That the central bank QE programs did not drive the share market means the tapering of QE, or allowing their balance sheets to shrink, does not necessarily have a negative impact on the share market.

Chris Bedingfield, a portfolio manager at Quay Global Investors, points out that in the first three QE programs, the S&P 500 went up by an average of 2.2 per cent in the month after a QE “event”, be that the commencement, announcement of tapering, or conclusion of QE. On average, regardless of whether the announcement indicated an easing or tightening of central bank policy, a month later US equities were higher.

That does not mean share markets cannot fall – but if they do, it will have more to do with other factors, like valuations, fear, geopolitics or even inflation rather than central bank actions.

PE ratios not as important as you think

PE ratios not as important as you think

The most commonly used valuation measure for share investors is the price to earnings ratio, which is typically referred to as the PE. It’s the price of a company’s share divided by the earnings per share the company either has, or is expected to generate, and it tells you how many years of earnings it would take to repay your investment.

The higher the PE, the more faith investors are placing in a company that it will perform well into the future. Another way of saying that is the higher the PE, the more expensive are the shares.

The PE, and variations on it such as the CAPE ratio (which uses rolling 10 years of real earnings) are constantly referred to by analysts and strategists as the benchmark of determining whether a particular share, or the market overall, is fairly valued or not.

However, the PE ratio suffers some shortcomings as a valuation tool. First, it is heavily influenced by sentiment, both positive and negative, plus it can be affected by inflation. Another problem is that while the P part is indisputable, the E part can be subject to the peculiarities and interpretation of accounting rules, which can make an enormous difference and render the PE all but meaningless.

Legendary analyst, Michael Mauboussin, Head of Consilient Research on Counterpoint Global at Morgan Stanley Investment Management, argues in his new book Expectations Investing, that the PE ratio is pretty much useless.

One of the critical reasons behind that surprisingly robust assertion is the rise and rise of ‘intangible assets’ on company balance sheets, especially in the US.

Tangible assets are things you can touch, like buildings and machinery. They are entered onto a company’s balance sheet as a capital item and treated as an asset.

Intangible assets are things that you can’t touch but are nevertheless an asset to the company, such as patents, trademarks or goodwill. Notwithstanding these can be the most valuable assets a company holds, the spending that goes into building them, like R&D, or marketing, or paying up for talented staff, is treated as an expense to the company and therefore reduces reported profits, which in turn reduces the reported earnings per share.

In 1975, the US share market was dominated by companies like General Electric, Ford, GM and oil companies, and intangible assets accounted for only 17 per cent of total S&P 500 assets. By 2020 the biggest companies were Apple, Microsoft, Amazon, Facebook and Google and intangibles had grown to be 90 per cent of assets.

In their book The End of Accounting, the authors, Lev and Gu, argue centuries old accounting principles are inappropriate for intangible-rich companies and concluded the ability of reported earnings and book value (the anchor for two of the most widely used ratios, the PE and price to book value) to explain share market values declined by an incredible 6 per cent per year between 1950 and 2014.

As Mauboussin points out, at the end of the day, what matters most is how much cash a company produces, not earnings. What this means is that when you see a tech company trading on what looks like an outlandish PE, it could simply mean the market is looking way beyond the reported earnings and instead is factoring in how much cash it thinks that company’s intangible assets are going to generate.

Kai Wu, principal of Sparkline Capital in the US, argues that if investors want to understand the value of intangible assets, they need to move beyond the limited information available in financial statements. On their analysis tangible assets make up less than 45 per cent of total value in six of the eleven sectors that make up the S&P 500, with things like network effects, brand equity, human capital and intellectual property making up the balance but not even rating a mention in financial statements.

Sparkline uses AI to analyse the mountains of data companies produce that reflect their intangible assets and incorporate the results into their valuations. The results are impressive, with backtests producing annualised returns more than 30 per cent higher than the S&P 500 over the past 25 years.

When you hear or read market commentators saying the PE ratio is way out of whack compared to its long-term average, the smart investor should first ask why that might be, not necessarily to rationalise it, but to understand it.

Want to discuss your investment strategy with a specialist? Call us today.

The January correction explained

The January correction explained

January saw the biggest correction in financial markets since the COVID selloff in February 2020. What happened? What caused it? And what’s the outlook?

The numbers

Share markets across the world declined over the month of January. The table below shows how far different markets fell from their recent highs, which in some cases was late December and in others was early January, and how they ended up on 31 January compared to the same recent high.

The numbers_image1

It is striking the extent to which some markets have already bounced back, although it is too early to declare the correction is necessarily over.

What caused the selloff?

The selloff started because markets expect central banks to increase interest rates in response to rising inflation.

Australia’s inflation rate hit 3.5% in the December quarter of last year, after 3.8% in the September quarter, the highest in the post-GFC period.

However, it’s the US, where the CPI hit 7% in December last year, the highest since 1982, that has markets really spooked. Some of the year over year price rises include energy +29%, gasoline +50%, used cars and trucks +37%, plus food and shelter costs rose sharply as well.

Exactly what causes inflation is always tricky to work out, but this time it’s easy to point to at least one major contributor. The US government injected COVID stimulus equivalent to 25% of GDP, which saw personal incomes increase massively at a time when companies had sharply reduced forward orders in anticipation of a drop in demand. While spending initially dropped, it bounced back quickly – see chart 1.

Chart 1: US personal income increased sharply with government stimulus and spending followed soon after

Chart 1_Trillion of chained 2012 dollars

Because people were in lockdown, spending on services plummeted and has only slowly recovered, but spending on goods exploded – see chart 2.

Chart 2: Spending on goods rocketed when people were in lockdown

Chart 2_Personal Consumption Expenditures

A lot of those goods being bought had to be imported from Asia, however, at the same time, a chronic shortage of shipping containers saw prices jump from US$3,000 for a container from China to the US, to as high as US$20,000. Then there was the problem that a lot of US transport workers were either calling in sick or quitting their low-end service jobs, so supply chains quickly got clogged up, from ports to warehouses.

Semiconductors quickly became scarce and auto manufacturers, who had cancelled contracts with the semiconductor manufacturers, were left with tens of thousands of almost finished cars at a time when demand for new and used cars took off. Consequently, car prices jumped.

Then US companies reported record margins at the end of the year, so evidently they seized the opportunity to raise prices and pass them on to consumers.

The upshot, goods inflation, having been negative for the past 25 years thanks mainly to technological advances and low wages growth, has rocketed – see chart 3.

Chart 3: Goods inflation has taken off after 25 years of being negative

Chart 3_Annual PCE inflation

After initially insisting inflation was only ‘transitory’ and therefore wouldn’t require a near term response, the Federal Reserve has been forced to back down in the face of a relentless barrage of criticism from financial markets. The quantitative easing measures that were put in place at the onset of the COVID crisis are being wound back and the governor, Jerome Powell, all but confirmed the Fed will raise interest rates at their March meeting. In fact, he left the door open to multiple rate rises this year and the market is pricing in at least three.

Here in Australia the RBA has also insisted it would not be raising rates until 2024, but speculation is mounting they will reconsider that position in their meeting on February 1 and the market is pricing in four rate hikes by the end of the year.

Why has that affected the share market?

When interest rates are super low, typically so too are bond yields, which has two effects.

First, when returns from bonds are super low it’s an easier decision to invest into shares.

Second, when you value an asset, you try to work out what all its future cash flows are worth today, which is referred to as a ‘discounted cash flow’ (or DCF) valuation. To calculate a DCF, you use a ‘discount rate’, which is typically based on the 10-year bond yield. The lower the discount rate, the higher is today’s value of all those future cash flows, and vice versa. So with higher interest rates and higher bond yields, those DCF valuations will be going down.

That affects the so-called growth stocks the most because you are typically placing a much higher emphasis on earnings a long way into the future.

That’s why the NASDAQ in the US got whacked the hardest, it’s full of tech companies. In fact, there’s a bunch of the real blue-sky companies, such as Zoom, Peloton, and Zillow, that fell 60-80% from their highs of early last year.

Should we be panicking?

Definitely not. While nobody, but nobody, can tell you when this correction will end, if it hasn’t already, there are many indicators that suggest economies and companies are in good shape. After all, the fact interest rates are rising is because the economy is growing strongly. Indeed, US GDP grew at an annualised rate of 6.9% in the December 2021 quarter, the highest in more than 25 years (with the exception of the freak September 2020 quarter, which was a bounce back from the COVID lockdowns) – see chart 4.

Chart 4: US GDP growth is the highest in decades (except for the post-COVID crisis spike)

Chart 4_US GDP growth

It is entirely normal for share markets to experience a correction, with the average intra-year pullback for both the Australian and US markets being 14% – see charts 5 and 6. Last year was the exception, where the worst drawdown in the US market was only 5% and in Australia was 6%.

Chart 5: Average intra-year drawdown for the Australian market is 13.9%

Chart 5_Average intra-year drawdown

Chart 6: Average intra-year drawdown for the US market is 14%

Chart 6_Average intra-year drawdown

As inevitably happens with any correction, you may have heard or read stories quoting uber bearish market pundits forecasting the end of the world. One example is Jeremy Grantham, who was widely quoted as predicting the market will fall at least 50%. The simple fact is, Grantham has been making that call since 2013 and has been wrong the whole way.

Something we all need to be aware of is that the media loves a crisis, because they know we’re hardwired to be drawn to headlines screaming “DISASTER AHEAD”. Without doubt they turn up the noise associated with selloffs, and likewise with the recoveries. It’s best not to pay much attention to most things you read and hear in the mainstream media.

Indeed, far from panicking, it’s worth remembering corrections like the current one usually throw up interesting opportunities. Markets have a way of picking themselves up, dusting themselves off and carrying on with their journey from bottom left to top right – see chart 7. It’s interesting to look at that chart and see some of the past events that at the time seemed like we may never recover from, but we do. The current concerns about Ukraine probably fall into that bucket.

Chart 7: Markets have a way of recovering and carrying on

Chart 7_Growth of $1

In conclusion, the current correction is because of concerns that rising inflation will cause central banks to raise interest rates, which affects share valuations, especially for the more growthy stocks. Buyers already appear to be snapping up cheaper stocks, which may indicate the market has already priced in what it believes is the rate rise risk. Nobody can tell you whether this correction has run its course, but you can rest assured the market will recover.

If you have any questions about what markets are doing or how your portfolio is positioned, please call us today.

Taking stock of stock markets

Taking stock of stock markets

So far, 2021 has been another year of stellar stock market returns across the developed world. To the end of November, the Australian share market has delivered 14 per cent, the US 25 per cent, and even dusty old Europe has managed to rise 14 per cent, with the only real laggard being the emerging markets, which have struggled under the deadweight of a Chinese market coming to terms with new regulatory concerns, returning 8 per cent.

As we approach the end of the year, it’s an opportune time to take stock of what the drivers of those strong returns have been and the likelihood of them being sustained.

At the heart of the global economic bounce back over the past 12 months, and helping to underwrite the strong financial markets, was the massive government stimulus payments to compensate for the expected drag from COVID. The OECD estimates governments around the world spent more than $19 trillion combined on COVID-related support programs. You have to go back to global wartime to find a comparable period of fiscal spending.

All that money has to go somewhere, and whilst some of it has been saved, much entered the economy and inevitably found its way into company revenues. Australian companies reported close to record earnings growth of more than 26 per cent for F2021 and paid out a record total of $67 billion in dividends. In the US, analysts are forecasting companies to report 40 per cent earnings growth over this calendar year and globally it’s an amazing 48 per cent.

Over the long run, earnings growth is the principal driver of share prices, and Citigroup’s forecast for global earnings growth drops to a far more typical 8 per cent for 2022.

There are also short-term drivers of share prices. In what’s come to be known as the ‘TINA’ effect (There Is No Alternative), money has flooded into equities chasing higher potential returns than what’s on offer through anaemic bond yields.

According to Bank of America Merrill Lynch, rolling 12 month flows of money into equity funds topped more than $1.5 trillion earlier this year, almost four times its previous highest peak. Incredibly, the $1.25 trillion invested into equities funds between January and November this year is more than the total amount over the same period for the previous 19 years combined!

That remarkable amount of liquidity has also underwritten a record year for global initial public offerings (IPOs), or company floats, worth more than $830 billion.

Another short-term driver is referred to as ‘seasonality’, which is the average performance of stock markets over a year. If you look over a long enough period it becomes apparent that money flows follow a pattern. The chart shows the Australian share market tends to experience a rally around April and October each year, which is after dividends have been paid, and for both the Australian and US markets, the December quarter is normally the strongest.


Seasonality of the Australian and US share markets, 1991-2020

AFR article chart

Another influence on share markets has been the reluctance of central banks to temper their super accommodative monetary policy, despite coming under concerted pressure from the bond market in the face of sharply higher inflation data.

Although the Reserve Bank of Australia abandoned its quantitative easing policy, it has retained a record low cash rate of 0.1 per cent and insists it’s not even close to raising it. Meanwhile, the US Federal Reserve has kept both its low rates and its QE program in place, and likewise assures markets it’s in no hurry to tighten.

As always, like placard waving protesters, there are bears who are keen to spoil the party. Valuations have undoubtedly become a lot more stretched over the year, and amazingly the total market capitalization of US companies with a price to sales ratio of more than 20 times has rocketed from about US$300bn to more than US$4.5 trillion in just the last 18 months, a level 25 per cent above the notoriously bubbly dotcom boom of 2000.

So, between the biggest peacetime government spending program in history and the lowest cash rates in history, perhaps it’s not surprising share markets have done very well this year, until you throw in that it’s happened during the worst global pandemic in a century. It makes you wonder what 2022 holds in store.

Want to discuss your investment strategy with a specialist? Call us today.

Inflation gives investors the chance to profit from shares

Inflation gives investors the chance to profit from shares

Inflation is once again in the headlines, after Australia’s September quarter CPI data showed prices increased by more than three per cent over the year. The Reserve Bank looks through the more volatile prices, like food and energy, but even its preferred ‘core measure’ came within its two to three per cent target range for inflation for the first time in six years.

Underlying the spike in inflation are higher energy prices, especially across the northern hemisphere, colliding with ongoing supply chain pressures, which were frequently referred to in recent results by both US and Australian companies, due largely to a global spike in demand for goods underwritten by the enormous levels of government stimulus pumped into the economy to offset COVID pressures.

Inflation is like kryptonite for bond markets, and its re-emergence has really spooked them. The Australian 10-year bond yield just about doubled in the two months to the end of October, to a yield of 2.08 per cent, while the US yield tripled to 1.56 per cent (remember, if a bond’s yield is going up, that means its price is going down). Bond markets are seen as betting the Reserve Bank, along with other central banks, will be forced to raise interest rates much earlier than they have been guiding since last year.

The sharp negative response in bond markets has not really been reflected in equity markets. Over the same period, the ASX200 fell four per cent from its recent all-time high (which included going ex a record amount of dividends), while the US’s S&P 500 rose three per cent to reach a new all-time high.

There has been a lot of commentary and speculation that equities markets are being too complacent in the face of a potential change in the inflationary picture and the risk of rising interest rates. Before rushing to make any decision on that either way, it pays to look at how shares have performed in past periods of high or rising inflation. The results may surprise you.

Table 1 shows that in the 12 years that reported the highest annual rates of inflation since 1960, which were all clustered around the 1970s to 1980s, there were five years where the All Ordinaries index fell, with the worst being a drop of 27 per cent, while the strongest year saw a mighty increase of 67 per cent. Overall, the average rate of inflation was a touch over 11 per cent, while the average share market return was more than 18 per cent. It’s fair to conclude there is no discernible relationship between the two.

Table 1

When looking at the 12 years that reported the highest annual increase in inflation, they were more scattered across the six decades. Of the four years where the All ordinaries fell, the worst was 2008, with a drop of more than 40 per cent, while the best year was 1986, which saw a rise of more than 52 per cent. The average increase in inflation was 2.6 per cent, while the average increase in the share market was 6.5 per cent. Again, there is no discernible relationship between the two.

Table 2

Importantly, smart investors should be aware that when the inflationary environment changes, the companies that drive share market returns may also change. In a low inflation environment, companies that can generate growth independently of macro considerations, known as ‘growth’ companies, will do well. This is exactly what we’ve had over the past five to ten years. Conversely, when inflation strikes, it’s those companies that have pricing power and can pass on higher costs, which are usually ‘value’ companies, whose earnings will be least affected.

Want to discuss your investment strategy with a specialist? Call us today.