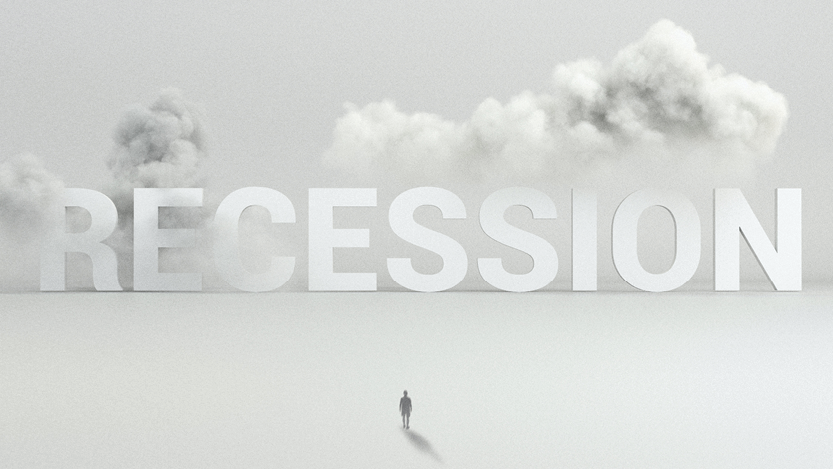
To recess, or not to recess, that is the question

To recess, or not to recess, that is the question

There’s a saying on Wall Street that central banks keep pushing until something breaks. In other words, if central banks want to reduce inflation, they have a tendency to keep raising interest rates until some part of the economy gets into trouble.

Since the middle of last year, economists, strategists and experts of all stripes have been putting forward a bewildering array of seemingly contradictory arguments as to why Australia, the US, Europe and pretty much every economy in the world, is either eventually going to fall into recession or should somehow narrowly avoid it.

Quite simply, if a central bank keeps raising interest rates, eventually the cost of credit, which is the lifeblood of a modern economy, will reach the point where consumer spending falls in a hole and businesses are either unable to pass on the additional cost or can’t justify new borrowing based on potential return. That’s when an economy slides into recession, with the slowing of growth and usual rise in unemployment having the effect of reducing inflationary pressures, until the cycle goes the other way and central banks desperately try to revive growth by lowering interest rates.

After June’s surprise rate rise, the governor of the Reserve Bank, Philip Lowe, said he believes Australia “remains on the narrow path” to a “soft landing”, or avoiding recession. Mind you, in the next breath he warned there’s more work to be done to make sure inflation comes back to the target zone of 2-3 per cent, which can only mean more rate rises.

Investors generally loathe uncertainty, so it can be frustrating that something so fundamental as whether the economy will grow or not looks to be a guessing game. The Commonwealth Bank and HSBC Australia are both perched on the fence, placing the odds of a recession at 50 per cent. Meanwhile, UBS reckons it’s a 25 per cent chance, AMP is at 45 per cent and Westpac is punting we won’t.

It’s the same in the US, where in October last year Bloomberg Economics placed the odds of a recession within 12 months at 100 per cent. Then by April this year another survey of economists placed the likelihood at 64 per cent, but with predictions ranging from as high as 94 per cent to as low as 30 per cent. Recently the New York Fed put the odds of recessing at 70 per cent, and for good measure, Goldman Sachs rates it a 25 per cent chance.

As the saying goes, if you’re not confused by that then you don’t understand it.

So how much faith should you place in economists’ forecasts? In case you haven’t already guessed, not much. In 2018 the IMF reviewed forecasts covering 63 countries over the 22 years to 2014 and found only 3 per cent of economists correctly forecast a recession 8 months ahead and only 9 per cent just 3 months ahead.

On top of that, economists will always use history as their guide to forecasting current outcomes, but this time the inflationary event was preceded by many governments, including Australia’s, injecting massive fiscal stimulus to offset the effects of COVID lockdowns. Much of that money continues to slosh around economies and is a big reason why unemployment is running at multi-decade lows.

Also, in the US, somewhat ironically, the rise in interest rates has meant the federal government’s interest payments have risen to about $950 billion, increasing the deficit to a hefty 8 per cent of GDP. Combine that with the low unemployment and it’s perhaps not surprising the US economy is proving resilient.

Bearish forecasters argue a recession will whack company earnings and markets, especially share markets, will have to fall. The bulls argue share markets have already factored in the likelihood of a recession and, as usual, are looking to the future.

Smart investors need to weigh up whether they think economies will recess and, if they do, whether it’s already in the prices. If that sounds as difficult as it actually is, then there’s a good argument for remaining invested in shares, but maybe retaining an allocation to cash or fixed income both as a defensive strategy and to pick up a bargain should one come along.


A contrarian opportunity in small caps

A contrarian opportunity in small caps

Contrarian investing is always difficult because, by definition, it requires swimming against the tide, which can be uncomfortable and tiring. While it’s certainly not for everyone, it is often where the best value and opportunity is to be found. Small cap companies in Australia and the United States may well be offering that opportunity right now.

Since the Australian share market peaked back in August 2021, the Small Ordinaries Index (XSO) has copped a way harder beating than its large cap peers falling by more than 20 per cent over the course of the market correction, while the ASX100, made up of the 100 largest companies on the Australian stock exchange, has dropped by only 5 per cent.

For a bit of longer-term perspective, the returns from XSO relative to the top 100 stocks is more than 20 per cent below its 20-year average, or more than 1.5 standard deviations. That is only 5 per cent away from its lowest level in at least the last 30 years – see chart 1.


The relative performance of the Small Ords<br />
vs the ASX100 is at a multi-year low

Similarly, the Russell 2000 (R2K) index of US small cap stocks has taken a similar beating during this market correction and is still down 22 per cent from the market’s high at the end of 2021. After tracking the large cap S&P500 for most of that time, over the past two months the performance gap is now the widest it’s been over that 17-month period.

Again, however, for some longer-term perspective, after the recent AI-driven rally in the mega cap tech stocks, the R2K’s returns relative to the S&P500 is about 27 per cent, or almost two standard deviations, below its 20-year average.

What is of far greater significance, though, is the valuation gap that’s opened up between US small cap companies and their large cap peers. When you compare their PE ratios, small caps are the cheapest they’ve been versus large cap stocks for well over 20 years and are now 2.5 standard deviations below the 20-year average – see chart 2, putting it in the 99th percentile.

US small caps are as cheap as they’ve<br />
been vs large caps for at least 20 years<br />

Luke McMillan, Head of Research for one of Australia’s best performing small cap fund managers, Ophir, points out that, unlike the GFC where markets fell because earnings collapsed, the current market correction is largely due to investor sentiment turning sharply negative, which gets reflected in a drop in the PE (price to earnings) ratio.

Not unusually, when the market experiences a sentiment driven correction, referred to as ‘PE compression’, small caps companies get hit harder than large caps as investors opt for the perceived safety of bigger companies.

And that can be the rub with investing in small cap companies. While it’s easy to get excited by the runaway small cap success stories that made early investors rich, like Afterpay or REA Group, there are far more stories of investors that have either lost everything or have watched their investments go nowhere year after year. The annualised volatility of the Small Ordinaries index is 25 per cent higher than the ASX100, in other words, investors need to be prepared to buckle up for a bumpy ride.

Many small cap companies have either no analysts covering them or very few, so getting your hands on reliable information can be difficult, especially if the company’s based overseas. That can make for great opportunities for those investors capable of picking apart a cash flow statement and balance sheet, and who are prepared to put in the time and effort to get to know a company in detail and spot the gems before the crowd. But, as McMillan says, a great small cap company needs a lot more than a good story; smart management and strong financials are critical.

While fund managers can find it a real challenge to beat large cap indices, making passive investing via an ETF an attractive option, because of the huge dispersion between profitable and loss-making small caps, it’s usually much easier for a good manager to beat the small cap index. The trick is finding those good managers.

The final thing any smart investor needs to remember when investing in a riskier asset like small caps, is to size the investment appropriately for both their portfolio and, importantly, their risk appetite.

Where you can find higher returns with less risk

Where you can find higher returns with less risk

Every smart investor dreams of higher returns with less risk. While scepticism is definitely in order for most investments claiming to offer it, there is growing evidence to suggest private assets do indeed hold out that tantalizing prospect.

First, what are “private assets”? They are any kind of asset that can bought or sold outside of a public exchange and can include everything from companies to loans, to property or even stamp collections.

Unlisted property syndicates are a form of private market investing that have been popular among individual investors for years. But the biggest growth among institutional investors, and lately individuals as well, has been private equity, so investing in companies from startups through to well-established or even multibillion-dollar ventures, and private credit, where you invest in a loan.

It’s easy to think public markets must be bigger than private markets, but it’s in fact the opposite, and in a big way. Worldwide, at the end of 2022, there were more than 140,000 private companies with annual revenues of more than US$100 million, compared to approximately 19,000 public companies. And globally, it’s estimated the private credit market is worth more than US$1 trillion per year.

According to Hamilton Lane, the world’s largest private equity consultant, private equity and credit have outperformed their public market equivalents in 20 of the last 21 years, and with significantly less volatility, which is often used as a proxy measure of risk. In fact, they estimate cumulative private equity returns since 2000 were about four times higher than global shares.

Similarly, KKR, one of the largest private equity companies in the world, reports that between 1981-2021 the Burgiss US Buyout Universe index returned 16.7 per cent per year compared to the S&P 500’s 10.0 per cent. Investing $1000 into the private equity index in 1981 would have been worth $482,000 by 2021, compared to $45,000 in US shares.

One of the principal reasons private equity outperforms public share markets is because there are no insider trading laws in private markets. If a transaction is not open to all and sundry, then there is no requirement for everyone to have access to the same information.

That means there are almost no obstacles to the super detailed due diligence private equity managers can undertake in analysing a potential acquisition, including access to things like board papers, financial projections or interviewing employees, the stuff a public equities fund manager would go to jail for!

Then once a manager acquires a company, not only will they have full visibility of its financial progress, it will also typically have a board seat and discretion to hire and fire executives of its choice. That’s a level of transparency and control that public fund managers can only fantasize about.

Private equity still has a bad reputation among some investors as predominantly an exercise in stripping assets from an acquired company, loading it with debt and then dumping it on unsuspecting investors through a share market listing. Whilst there may be a handful of private equity managers who still operate that way, these days the best managers carefully plan a multi-year strategy to transform acquired businesses.

Critics of private assets argue the lack of volatility is because the investments are not revalued on a minute-by-minute basis like shares or bonds are. That is indeed true, but that lack of liquidity in the underlying investments is not necessarily always a bad thing. One of the main reasons share markets are volatile is because they are subject to the vagaries of human sentiment, especially fear and greed, which invariably causes markets to overreact on both the upside and the downside, reflected in gyrating price to earnings ratios.

By contrast, typical private equity deals are run on a multi-year timeframe by cold-blooded managers who are neither driven by sentiment nor required to disclose earnings results on a regular basis. Whilst that can mean private assets don’t benefit as much from sharply higher PE ratios, nor do they suffer from sharply lower ones either.

The main risk of investing in private assets has always been liquidity risk. Private equity funds will normally lock investors’ money up for 7-10 years, which is why they have largely been open to only institutional or ultra-high net worth investors. And they’ve loved it, with global participation in private markets estimated to have grown from US$600 million in 2000 to US$9.7 trillion in 2022.

But over recent years, the so-called democratisation of private markets has seen novel funds that offer monthly or quarterly liquidity, making this exceptional asset class available to individual investors who are happy to take a long-term approach to investing.

It is possible to calculate a portfolio’s liquidity requirements, to meet things like pension payments or regular expenses, and keep sufficient public market investments to cover them, then invest the balance in a diversified mix of private market assets. 


Interested in how private assets could work in your portfolio?

Complete the following to receive our ebook on private assets.

6 + 12 =

Central banks and interest rates: myths vs reality

Central banks and interest rates: myths vs reality

In June of last year, Jerome Powell, the Federal Reserve Chair, admitted, “We now understand better how little we understand about inflation.”

That alarming, but at least honest observation from the world’s most powerful central banker, comes despite the Fed employing more than 400 Ph.D. economists who enjoy access to the world’s most up to date data.

What is truly disconcerting though, is that governments around the world have happily passed on responsibility for managing inflation, and usually unemployment as well, to central banks via the control of monetary policy. But they essentially have only one tool to do that: interest rates.

Passing on that responsibility to central banks rests on some long-standing beliefs around monetary policy that sound fine in theory but lack real world evidence to back them up.

For example, the presumption that raising or lowering interest rates can control inflation. During the 2010’s, central banks around the world were concerned about deflation, that is, inflation being too low, so the biggest central banks in the world cut interest rates to never before seen levels.

The United States had effectively zero interest rates between 2010 and 2016, yet inflation averaged only 1.6 per cent per year over that period. Over those same seven years interest rates in the Euro Area averaged about half a per cent but inflation was -0.1 per cent, and in Japan rates were stuck at zero yet inflation averaged only 0.2 per cent.

Likewise, if high interest rates are supposed to cure inflation, how is it that Argentina can have an interest rate of 78 per cent yet inflation is 102 per cent? Defenders of orthodox monetary policy would say Argentina’s long been a basket case, but that’s the point, its interest rate has been above 40 per cent for the past five years but it has failed to control inflation.

Another shibboleth of monetary policy is the so-called Phillips Curve, which asserts that inflation and unemployment are inversely related. That’s why the Reserve Bank and the Fed regularly talk about the 50-year low unemployment levels and the inflationary risk from the price-wage spiral. The theory is that low unemployment causes such high demand for workers that they will flex their bargaining power and drive up wages, so raising inflation.

That may have been an issue 50-plus years ago when more than 60 per cent of the workforce belonged to a union, but with now only 9 per cent of Australia’s private sector in a union, things have changed. Wage increases have been below the CPI for the past nine consecutive quarters in Australia, see chart 1, and real average hourly earnings in the US declined by 1.3 per cent over the year to February, meaning it has been a deflationary influence in both countries.


Chart 1: Australian wages growth has lagged the CPI for the past 9 consecutive quarters

Chart 1: Australian wages growth has lagged 
the CPI for the past 9 consecutive quarters


In fact, Quay Global Investors analysed the US inflation and unemployment data between 1985-2020 and found there was no meaningful relationship – see chart 2. 


Chart 2: there has been no meaningful relationship between inflation and unemployment in the US over the past 40 years

Chart 2: there has been no meaningful relationship between 
inflation and unemployment in the US over the past 40 years


However, there have now been five different analyses covering the US, UK and Australia, that have each found corporate profiteering accounts for the majority of inflationary pressures in each country. That is reflected in US corporate profit margins hitting a 70-year high last year. One of those studies dubbed the phenomena “excuseflation”, because companies were using the first bout of inflation in years as cover to raise prices as much as they felt the market would bear.

Yet central banks continue to focus on consumers and households, with no mention of the role played by companies. By contrast, at the start of the pandemic the Japanese government made it clear to companies they would be watching for opportunistic price gouging, resulting in an inflation rate that peaked at about half the rest of the developed world, despite importing almost all their food and energy.

Also, monetary policy is frequently, and correctly, referred to as a blunt instrument because it can only work indirectly, by encouraging or discouraging people and businesses to borrow money and it can take ages to have any effect. The usual expression is that it operates “with long and variable lags.” However, all the central banks continue to say they will be “guided by the data”, but that data, be it the CPI, unemployment or industrial data, is all backward looking. There is an obvious logical mismatch.

Another logical mismatch is expecting that raising interest rates, which can only influence demand driven inflation, will do any good against supply driven inflation. For example, the floods last year contributed to double digit food inflation. Obviously, families have to eat, so raising interest rates is entirely non-sensical as a way to counter those inflationary effects.

The very clear problem is that by sticking dogmatically to those underlying economic theories, without accounting for the lack of real world evidence to back them up, central banks risk pushing economies into recession. Central bankers are muscling up trying to show they can be as tough as Paul Volcker, who was credited with stopping the inflationary episode of the 1970s-80s, but there are compelling arguments to suggest he gets way too much credit. They insist the pain of inflation, which by their own admission they don’t fully understand, is worse than the pain of people losing their jobs or their houses.

Interest rates can definitely play a role, after all, if central banks push interest rates high enough they will inevitably force a recession, which will certainly have deflationary consequences, but it’s ridiculous to argue that’s the only way to address the problem.

There are no easy solutions to controlling something as mysterious as inflation in a modern, complex economy, however, acknowledging the critical role fiscal policy plays would be a start. Professor Isabella Weber of the University of Massachusetts, who specialises in inflation, argues governments should explore strategic price controls, which have been extremely effective in the past, such as during war times.

However, until the dogmas of orthodox economic policy are left behind, smart investors need to remember to base their investment decisions on what they think will happen, not what should happen.

Are Australian banks safe?

Are Australian banks safe?

Spoiler alert: Australian banks are safe and what’s happened in the US and with Credit Suisse over the past week does not represent a threat to your bank deposits nor to the Australian economy in general.

The US

Silicon Valley Bank (SVB) was the sixteenth largest bank in the US, with $209 billion in assets, and collapsed last week largely due to poor management.

With the explosion in venture capital investing over the pre-COVD period, SVB had experienced incredible growth by banking standards: deposits had quadrupled in five years. However, it had a massive concentration of depositors, 93% were corporate compared to a median of only 34% in the US’s 10 largest banks, and most were venture capital-backed businesses with relatively large deposits. This left the bank vulnerable to an old-fashioned run on its deposits.

In an effort to make a bit of extra money, SVB had invested a lot of those deposits into US government bonds, which are super safe, but some were long dated, out to a few years. If they had have invested in 3-month bonds, there wouldn’t have been a problem, but the bank chased the higher yield of 3 and 5-year bonds. This left the bank vulnerable to a rise in interest rates, which reduces the value of bonds. Given SVB’s CEO sat on the board of the San Francisco Fed, which had been warning of ongoing rate hikes, you can see how poor management was.

With venture capital investors slowing their rate of handing out money since last year, some of those depositors were forced to draw on their deposits to run their companies and fund basic working capital.

SVB was forced to sell some of its government bonds and take a loss on them, which was reported to the market and they unsuccessfully tried to tap shareholders for $2.25 billion in new equity. This caused some of the venture capitalists to worry that if more and more depositors started wanting their money back, SVB wouldn’t be able to meet the demand, so they jumped on Twitter or sent text messages telling their investee companies (the depositors) to get their money out ASAP. This caused that old fashioned bank run to snowball, and at one point SVB had copped $42 billion worth of withdrawals in six hours.

By Thursday of last week, it was lights out for SVB. The Federal Deposit Insurance Corporate (FDIC) moved in that day, stayed all night assessing the state of withdrawal requests, and announced it had taken control of the bank by Friday. That’s the day all hell broke loose for US banking shares, with the regional bank index falling some 16%. By Sunday night the Federal Reserve announced all depositors would be made good, but equity investors will lose their money, which is exactly the way it’s supposed to work: depositors have faith a bank will look after their money, while investors take on the risk of a company screwing up.

In summary, the SVB situation was idiosyncratic, i.e. a situation peculiar to that bank. There have since been two other smaller US banks closed down by the FDIC, mainly because they had excessive amounts of deposits tied up in crypto assets. Certainly, it wouldn’t have happened if the Fed had not been raising rates, but there’s a popular expression on Wall Street that the Fed keeps raising until something breaks.

It’s worth bearing in mind, the US banking industry is structured very differently to ours. There are literally hundreds of small banks, a legacy of the Great Depression era. Since 2001, there have been 563 banks go belly up in the US, with about 500 of those as a result of the GFC. If Australia’s banking system was able to withstand that, it will be fine with what’s happening now.

Credit Suisse

Credit Suisse has been a mess for years, with a string of scandals and poor investments going back over decades, which culminated in a growing number of clients taking their money and business elsewhere by the end of last year. The bank’s CEO tried to woo back customers, but last week the Securities and Exchange Commission (SEC) in the US (equivalent to ASIC here), queried the bank’s annual report. Combined with the SVB situation, panic started to set in.

Then on Wednesday, CS’s biggest shareholder, the Saudi National Bank, said it wasn’t going to be able to invest any more into the bank because it was hitting regulatory limits. That caused CS’s share price to plunge, and they asked the Swiss central bank to issue a statement of support, which it did.

However, other banks around the world started worrying about counterparty risk, in other words, looking at contracts where CS was on the other side, and trying to buy protection. Pretty soon, the cost of that protection skyrocketed, implying a high likelihood of default.

A you can imagine, a lot of investors started having flashbacks to the death of Lehman Brothers in 2009, and worrying what threats CS poses to the global banking system. However, CS has substantial liquid assets it can call on as well as access to central bank lending facilities. The CEO has said it has sufficient cash-like liquid assets to pay back half its deposit liabilities and loans from other banks.

Subsequently, the Swiss National Bank has said CS “meets the higher capital and liquidity requirements applicable to systemically important banks” and it stands ready to provide CS with liquidity. CS has announced it will borrow SFR50 billion to meet any liquidity demands from depositors and buy back a bunch of debt that was trading way below its issue price.

Is this the start of another GFC?

No, it’s a very different situation. However, stress levels in financial markets have certainly risen which is being reflected in bond market dislocation, which will result in higher funding costs for banks. It depends on how markets and central banks respond to a crisis, and so far, the US Fed and the Swiss National Bank have done very well.

How will it affect Australian banks?

In 2016, the Australian bank regulator, APRA, announced it wanted Australian banks to have “the strongest balance sheets in the world”. At the time the banks pushed back, but lost, and now their balance sheets are indeed very strong.

Their funding costs may rise a bit, and access to capital markets may be restricted while markets are unsettled, but there is no risk of any bank failures in this country.

As for depositors, the federal government already guarantees deposits up to $250,000 and we’ve seen the US regulator increase that to pretty much no limit for the SVB depositors.

A silver lining?

It is entirely possible this will cause central banks around the world to pause their interest rate rises while markets are in turmoil.

Is the era of US share market dominance coming to an end?

Is the era of US share market dominance coming to an end?

Between the end of the GFC in early 2009 to the end of the 2021 share market melt up, US shares returned an astonishing 486 per cent, a compounded annual return of 14.5 per cent. It was enough to make other share markets look positively pedestrian: Europe was up 228 per cent, the emerging markets 251 per cent, Japan 266 per cent and the laggard was Australia, at 198 per cent.

If you didn’t have some exposure to US shares you missed out on one of the greatest bull market runs in history. And much of that stellar performance was due to the tech sector: over the same period the Russell 1000 Technology Index rose by a whopping 1477 per cent.

Table showing the 2022 share market returns in local currencies

Regime change

Having gone through the pain of a bear market, it’s tempting to presume the markets and sectors that did best in the last rally will lead the way again, but in fact, often that is not the case.

Instead, the end of a bull market often sees a regime change and when that happens the former market leaders can underperform for years. For example, Japan has never regained its 1990 high, the NASDAQ took 14 years to recover its dotcom boom levels and some finance stocks that were in the S&P 500 top 10 in 2007 have yet to recover as well.

In other words, when a market or sector booms, the bust on the other side can take years to play out, especially when the leading sector ends a bull market on high valuations.

Are US shares expensive?

In short, compared to other markets, yes, and on various measures. The ‘CAPE’ ratio (Cyclically Adjusted Price to Earnings ratio) measures the last 10 years’ inflation adjusted earnings, and while it’s a terrible indicator for timing markets, it’s a good indicator of long-term valuations. At 28, the US is not only miles above its long-term median of 16 but is more expensive than any other market: with Europe on 16, Australia 17 and China 8.

Similarly, Morgan Stanley calculated that on a price to book value measure, at the end of 2022 the rest of the world was trading at a 60% discount to the US, the lowest in almost 25 years.

Bar graph showing the main negative influence of share prices was sentiment based on source of return 2022 AUD

And JP Morgan estimates that at the same time, the US was trading on a price to earnings ratio of 16.7 times, bang in line with its 20-year average, compared to Australia on 14.2, Japan on 12.2 and Europe on a bargain basement 11.7.

A potential change in the top sector

When the US market undergoes a regime change, it is not unusual for the leading sector in the index to change as well. In the 1990s consumer staples became the largest sector, then it was financials, and in the post-GFC period the tech sector became the dominant engine of growth.

Line graph showing the probability of recession over the coming 12 months in the Fed's Survey of Professional Forecasters

Likewise, the top companies change around as well, sometimes dramatically. In 2000 the four largest stocks in the S&P 500 were Microsoft, Intel, Cisco Systems and General Electric, boasting a combined weighting of 16 per cent of the total index. By the end of 2022, the same four had a combined weighting of 6 per cent, with Microsoft accounting for 5 of that.

At the height of the market in 2021, the top four companies accounted for 22 per cent of the S&P 500’s total market capitalisation. That has already dropped to 17 per cent, and if history’s any guide, it could have a lot further to fall.

Line graph showing the Morgan Stanley Leading Earnings Indicator against the Actual S&P 500 LTM EPS Growth Y/Y

Letting go can be hard

Financial markets are far more dynamic than many investors’ mindsets. Humans are usually reluctant to let go of a paradigm, presuming that what worked best in the last investment cycle will win out again.

That partly explains why the best performing stocks in the Russell 2000 index over January were unprofitable tech stocks, and those which had fallen the most: the presumption being that if the market’s rallying, just buy what’s been hit the hardest.

A regime shift doesn’t happen quickly, and it doesn’t mean you should sell all your US and tech holdings immediately. A smart investor understands these things are not binary, but more a question of relativities. Changing by increments can produce a better result.