What just happened and what lies ahead

What just happened and what lies ahead

2022 – the scorecard

By some measures, 2022 was one of the worst years for financial markets in the last century and it was all due to central banks aggressively tackling a sharp rise in inflation.

Global bond markets suffered their worst year ever, with the Bloomberg Bond Index falling 13%, compared to the previous worst fall of only 3%.

Share markets were very mixed, with previous laggards like Australia and the UK doing relatively well (though still falling), while the US, which had left the rest of the world in its dust over the past 13 years, recording its seventh worst year in the past 100 – see chart 1.

Table showing the 2022 share market returns in local currencies

The big falls on global share markets was by and large because of ‘PE compression’, meaning the price to earnings ratio at which investors were prepared to buy stocks fell. That reflects a change in sentiment, as opposed to a fall in earnings (the opposite to what happened in the GFC). The grey bars in chart 2 show the extent to which that change in sentiment offset any positive contribution from earnings growth and dividends (the chart is in AUD which is why there’s a currency effect as well).

Bar graph showing the main negative influence of share prices was sentiment based on source of return 2022 AUD

The huge difference in returns was due to the resurgence of ‘value’ stocks, the old fashioned sectors like resources and industrials, smashing the ‘growth’ stocks, like tech.

Lessons from 2022

Financial markets throw up new lessons all the time, here are a few of the takeaways from last year.

Be wary of central banks: as late as November 2021 the Governor of the Reserve Bank of Australia, Philip Lowe, reiterated the board’s often repeated view that inflationary pressures were not a concern to them and interest rates in Australia would not rise before 2024, six months later they began the most aggressive rate rise campaign in decades, with eight consecutive monthly rate increases taking the cash rate from 0.1% to 3.1%, with the likelihood of more to come.

The US Federal Reserve was the same and was more or less bullied by financial markets into launching aggressive interest rate rises, with seven consecutive increases taking their cash rate from 0.25% to 4.5%.

Don’t trust forecasters: out of a survey of 16 US forecasters, the lowest estimate for how the S&P 500 would go over 2022 was a 3.5% fall, the highest was an 11.1% gain, with the average being a 3% increase. The final result was a fall of 19.4%.

This just shows how tough it is to make forecasts. It’s a truism that over the long-term share prices follow earnings growth + dividends, which, according to chart 2, was about +3%. So it’s pretty understandable the average estimate came in at that level, but any strategist will tell you they hate making one year forecasts because sentiment is invariably the swing factor, and that’s simply impossible to guess.

Bonds can lose money too: over the past 40 years, when interest rates were on a long-term downward trend, bonds provided a counter-correlated air bag against falls in share markets, but 2022 was dramatically different. Government bond yields fell to all time lows in 2021, which increased their sensitivity to a rise in inflation. And while corporate bonds offered a better yield, they were also susceptible to repricing on concerns that companies would be more likely to default in a rising rate environment.

Base decisions on what you think will happen, not on what you think should happen: there were plenty of strong arguments that rate increases, which are designed to reduce demand by increasing the price of credit, were not the right weapon to use against inflation that was driven mostly by a combination of supply bottlenecks and companies opportunistically increasing prices.

If interest rates hadn’t risen as much as they did, it’s unlikely share markets would have fallen as much as they did. But the fact is central banks made it clear they were going to hike rates, and that was especially going to affect the growth stocks.

The falling tide can affect almost all boats: when markets go into a broad reversal because of a PE derating, it doesn’t matter if you avoid the clearly overvalued parts of the market, like unprofitable tech stocks, because even ‘fairly’ valued sectors supported by solid earnings can get whacked too, as we saw with highly profitable tech companies like Apple and Microsoft.

The bulls vs the bears

There is, as always, a raging debate between the bulls and the bears as to what 2023 holds in store. While it’s always prudent to bear in mind what Yogi Berra apparently said that it’s always risky to make predictions, especially about the future, here are some observations.

What the bears argue: the consensus view among investment banks and fund managers, especially in the US, is that the US economy will go into recession some time in 2023 – see chart 3, but that is not yet reflected in earnings forecasts.

Line graph showing the probability of recession over the coming 12 months in the Fed's Survey of Professional Forecasters

After recent downgrades, the consensus forecast for US earnings in 2023 is roughly flat, whereas in past recessions earnings have typically fallen 15-20% – see chart 4. As we pointed out above, markets normally follow earnings, so the consensus forecast for the S&P 500 this year is a 20-25% drop to new lows (between 3000-3300), before a recovery toward the latter part of the year (consensus is 4038 by year end).

Line graph showing the Morgan Stanley Leading Earnings Indicator against the Actual S&P 500 LTM EPS Growth Y/Y

The expectation of a recession is based largely on the fact that there has never been an inflationary episode like we’re in now that hasn’t required the Fed raising rates so much that it drives the economy into recession. That view is reinforced by the US reporting its lowest unemployment rate in 50 years, which is generally seen as a harbinger of wage-driven inflation: orthodox economic theory argues there’s an inverse relationship between unemployment and inflation, and the Fed governors have repeatedly made it clear they are prepared to sacrifice jobs to reduce inflation, i.e. they will keep raising interest rates to choke the economy.

Line graph showing the US Bureau of Labour Statistics unemployment levels

Finally, the bears point to the ‘inverted US yield curve’, meaning the yield on 2-year government bonds is higher than the yield on 10-year bonds – see chart 6. Every US recession for the past 50 years has been preceded by an inverted yield curve.

Line graph shows 10-year treasure yields minus 2-year yields (1980 - Present)

What the bulls argue: it looks for all the world like US inflation peaked in June last year, and it’s now declined for six consecutive months – see chart 7.

Bar chart showing US inflation stats throughout 2022

A range of things that caused prices to spike last year have fallen dramatically: freight costs are back to pre-COVID levels, oil and gas prices are back to pre-Ukraine war levels, as is wheat, semiconductor supplies have all but normalised, lumber is below where it was in 2020, etc. – see chart 8.

Line graphs showing the price ranges throughout 2022/23 for oli,gas,shipping and wheat

A quirk of how the US reports its inflation rate is that it compares the most recent month to what happened 12 months before. However, former Fed vice-chair Alan Blinder commented last week that if you instead annualise December’s monthly CPI number, which was -0.1%, the US is now experiencing disinflation!

Also, the December US jobs report was full of good news: although the US economy added 223,000 jobs over the month, average hourly earnings growth was only 3.4% for the year, so lower than the inflation rate and slowing – see chart 9. There is absolutely no evidence of the wage-price spiral the Fed is so concerned about. These are all arguments militating against the Fed continuing to raise interest rates.

Line graph showing US wage prices

What about the risk of recession? US research group, Renaissance Macro, commented that “recessions don’t happen when real incomes net of government transfers (pension payments and the like) are on the rise and this is up 3.2% annualised since June.” In other words, households are doing OK, which should underwrite consumer spending.

Also, last year the US economy added 4.3 million jobs and Carson Investment Group pointed out that of the 17 previous years where the US added more than 3 million jobs, only once did the following year go into a recession, 1972.

What about the scary inverted yield curve? Last week, Professor Campbell Harvey, the economist who came up with the indicator, said he believes this time it’s a false signal.

What about the record that inflation has never fallen without the Fed pushing the economy into a recession? Two things: first, this inflationary cycle is different to previous ones insofar as it’s easier to identify the causes, like people being locked in quarantine only able to spend on goods and consequent supply chain bottlenecks, all of which are turning, or have turned, around, and second, there has never been a time when a rising interest rate cycle was preceded by a government injecting 25% of GDP directly into households. Even the lowest quartile of households are still sitting on net savings.

What about the prospects of earnings downgrades? Again, the ginormous amount of money from those fiscal injections is still bouncing around economies, which will help underwrite corporate earnings for a while yet. Also, historically the S&P 500 has bottomed out on average 6-9 months before corporate earnings – see chart 10. Another way of looking at that is the share market is a forward looking indicator and has a knack for factoring in all the news that’s out there well ahead of economists and analysts. The S&P 500 fell 27.5% at its worst, and it’s now down 17%, meaning it may well have already factored in all the nasty prospects of earnings downgrades.

Line graph showing Price vs EPS

Other economies and markets: I’ve focused on the US because that’s where all the best information and data is available. However, for Australia, the monthly inflation rate is still above 7% and hasn’t shown signs of slowing anywhere near as clearly as the US, partly because of the effects of floods on food prices, the reintroduction of the petrol excise and the high cost of housing. It’s considered a certainty the RBA will raise interest rates for the ninth time in a row when they next meet in early February, but Governor Lowe has indicated the board is prepared to be less aggressive and wait to see if their handiwork has had an effect. It’s difficult to find an Australian economist forecasting a recession.

Europe was considered a basket case, but even there, a surprisingly mild winter has meant the nightmare scenario of energy shortages appears very unlikely and inflation also looks like it peaked in October and has fallen since. The natural gas price has fallen more than 60% from its peak in August and is now trading below where it was before Russia’s invasion of Ukraine. Unemployment in the Euro area is at its lowest since its inception and, although 6.5% is still significantly higher than the US or Australia, it is trending downwards – see chart 11. There are some brave souls arguing even Europe won’t go into recession.

Line graphis showing unemployment figures for the Euro area
China, which was one of the worst performing markets in 2022 because of the government’s strict COVID-zero policy and problems with the property sector, is bouncing back quickly. In late 2022 the government lifted almost all COVID restrictions following widespread protests, which was terrific from a libertarian and economic perspective, but clearly they had failed to put a comprehensive plan in place over the lockdown period and now infections are running wild. The government has already talked about stimulating the economy through fiscal and monetary measures, which will no doubt spur a recovery and contribute to global growth as well.

Thoughts on where to invest

A benefit of the global selloff is that valuations have come back to relatively attractive levels. They might not be as bargain basementish as after the GFC, but they’re a lot better than late 2021 – see chart 12, especially for Japan, Europe and the emerging markets.

Bar graph showing current and 20-year historical valuations

Not surprisingly given the Australian share market didn’t fall as much as others, it’s only just below the long-term average PE ratio and the US is a smidge above.

Record high margins: one issue is the record high level of margins in both the US and Australia – see chart 13. For the US that has largely come from the tech sector, not so sure about Australia, although it’s noteworthy that Australian margins have been higher the whole time. In 2021, of the 70% earnings growth reported by US companies, 50% came from margin expansion. It would not be surprising to see margins come under pressure.

Line graph showing profit margins of 12-month training earnings to revenues

Outperformance of the US: since the GFC, US shares returned 14.1% p.a., which was 38% higher than Australian shares and 33% more than international. Chart 14 shows the extent to which the US has become expensive compared to the rest of the world, based on a combination of PE, price to book value and price to cash flow (the chart is only to March 2022 but it’s unlikely to have changed significantly since then). The point here is this chart has historically reverted to the mean, will it do so again?

Line graph showing relative valuation MSCI ACWI ex-US Index vs. MSI US Index

As always there are great arguments on both sides as to why the US should or shouldn’t continue to do well versus the rest of the world. It remains a source of corporate and financial innovation with the lion’s share of globally recognised brands. However, it is expensive compared to the rest of the world, and the Republican dominated congress looks like it will be held to ransom by a handful of extreme views that could well wreak havoc with the government’s finances.

Will the emerging markets return to favour? Chart 15 shows the emerging markets smashed the developed markets over the 10 years up to the GFC (the rising blue line) and has underperformed since. At the end of 2022, the PE ratio for the emerging markets was 34% lower than the developed markets.

Line chart showing the correlation between emerging markets rel MSCI-World & USD

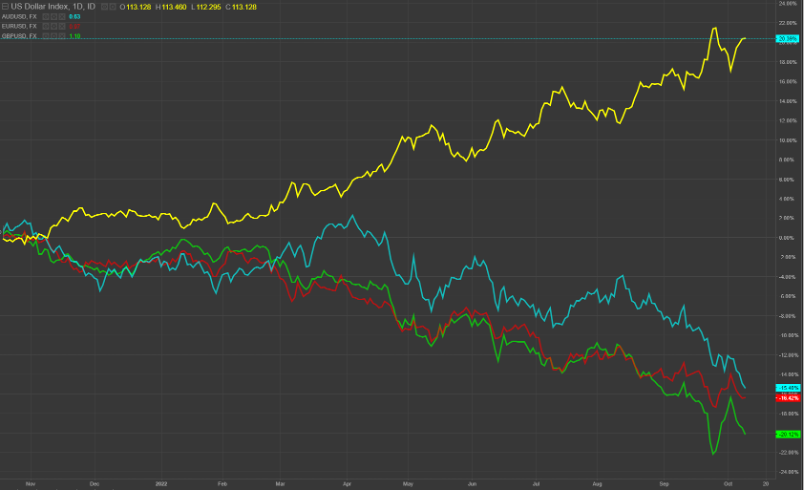
The emerging markets tend to do poorly when the USD strengthens, and it has just come off one of its strongest years ever, rising 22% at one point. Chart 16 shows the USD has rolled over dramatically, which should support EM.

Line graph showing the DXY Dollar Index / 40 week moving average

Looking ahead

As always, there are compelling sounding arguments on both sides. On balance, it would be surprising to see economies fall into a deep recession when unemployment levels are at 50-year lows and household incomes are healthy. Inflation appears to be falling at a rate that would justify central banks pausing, or at least slowing, to see what effects the interest rate rises they’ve already pushed through will have.

Having endured some significant losses in 2022, global markets have started 2023 strongly. Indeed, the ASX has had its best start to the year since 1988, three quarters of stocks in the S&P 500 are more than 20% off their lows, Europe has bounced 20% off its lows and the UK is only 2% off its all-time highs.

We know when markets turn positive it can be difficult to put your finger on why it’s happening at the time, but then they tend to run hard as investors play catch up. There is no assurance we won’t revisit the lows, but it’s looking less likely and after a tough year last year, you can see light in the proverbial tunnel.

The views shared in this article are the author’s views and don’t necessarily reflect those of the whole firm.

Don’t expect anyone to ring a bell at the bottom

Don’t expect anyone to ring a bell at the bottom

Investors have endured one of those years that tests patience and fortitude as share markets have ridden waves of despair and optimism. At its worst this year the Australian market was down more than 15 per cent from its highs, but the bellwether US markets have been rocked, with the S&P 500 down almost 26 per cent at its worst and the NASDAQ 33 per cent.

As is typical with bear markets, we’ve also seen some decent rallies, like June to August which saw an 11 per cent rise in the ASX200 and 18 per cent in the S&P 500.

Share markets are in the midst of another rally now, and the inevitable, and unanswerable, question on every investor’s mind: is this just another bear market rally or do we get on board?

It’s at times like this that smart investors might look to experts for authoritative insights on what to expect from financial markets. The reality is, however, none of those experts are completely reliable.

Central banks

The correction in financial markets this year was prompted by central banks, especially the US Federal Reserve, aggressively raising interest rates to tackle inflation. Yet on 29 June this year, the Governor of the US Fed, Jerome Powell, told a European Central Bank Forum,

“I think we now understand better how little we understand about inflation.”

That brutally honest, but nevertheless disarming confession, comes despite the Fed having hundreds of PhDs with access to the best information sources available.

Similarly, in 2012 the Fed started releasing where each governor expected interest rates and inflation to be over the coming three years, which came to be known as the ‘dot plots’. But it became clear the governors’ best guesses weren’t much better than anyone else’s, prompting Powell to say,

“The dots are not a great forecaster of future rate moves…just because it’s so highly uncertain. So, dots are to be taken with a big grain of salt.”

Likewise, you need only recall the now notorious reassurances from our own Reserve Bank as recently as November 2021 that interest rates would stay low until 2024, only to unleash the most aggressive rate rise cycle in decades six months later.

Economists

Economists’ opinions are often quoted not only for economic issues, like the outlook for inflation and unemployment, but financial markets as well. But in 2018 the IMF examined economists’ GDP forecasts for 63 countries over the 22 years to 2014 and found on average only 3 per cent forecast an impending recession eight months ahead of it actually starting, and only 9 per cent three months ahead.

Even Nobel Laureate, Ben Bernanke, the former Governor of the US Fed, said in May 2007 that subprime mortgage issues ‘wouldn’t seriously hurt the economy’. Only four months later the US share market began a 50 per cent dive, and those same loans led to the Global Financial Crisis.

Financial analysts and strategists

Most financial strategists will tell you that making forecasts about what markets will do over the next year is a mug’s game. There are simply too many variables, the most unpredictable of which is human sentiment, making the room for error enormous.

One study looked at the average S&P 500 forecast made by the 22 chief market strategists of the biggest banks and brokerage firms in the US from 2000 to 2014 and found the average miss was 14.6 per cent. That’s in absolute terms, meaning if the share market rose 10 per cent, the average forecast was for either 24.6 or -4.6 per cent.

Currently, many analysts argue share markets can’t have bottomed until corporate earnings have been downgraded enough to reflect the likelihood of a recession coming next year. So far US earnings forecasts for 2023 have been reduced by roughly 7 per cent, however, the S&P 500 was down by almost 26 per cent. It’s impossible to know if that difference wasn’t the market already factoring in lower earnings.

Experts may sound like they’re certain about where markets are headed, but in reality, they’re guessing like anybody else. If investors opt to wait for more ‘clarity’, by the time it comes, the markets will have already moved. The best option is to have a long-term plan and stick to it, because, as the truism goes, they don’t ring a bell at the bottom.

If you would like to discuss your investment options, please get in touch.

A bear market opportunity

A bear market opportunity

Winston Churchill’s admonition to never waste a good crisis is something all smart investors should keep in mind as financial markets wrestle with the potential for a recovery from the current bear market.

One opportunity not to waste is revisiting your weighting to Australian shares in an investment portfolio.

There is a well-recognised home country bias among investors all over the world, meaning most investors tend to be heavily overweight their own backyard, which is easy to understand given increased familiarity and ease of access.

For Australian investors two other factors have been important contributors to what Vanguard has previously estimated as an average of 73% allocation to domestic equities: the franking system which boosts dividend returns, and Australia’s economic record of avoiding recession for almost 30 years contributing to a perception of safety.

However, while franking credits are a terrific booster to returns, a better approach is to look at total returns from a portfolio, because it’s possible capital growth alone can far exceed the added return from dividends, especially in recovering markets.

And economic growth does not necessarily reflect in the share market, because its composition is very different to the broader economy, for example, the top 10 companies on the ASX 200 account for almost half the index, meaning it’s a heavily concentrated sample.

Harry Markowitz, one of the godfathers of modern portfolio theory, is famous for saying that diversification is the only free lunch in investing. Australia represents less than 3 per cent of global share market capitalisation, compared to the US being well over half and Europe around 20 per cent. This is where the opportunity lies.

Over the course of the current bear market, the drawdowns experienced by different countries have varied considerably. At the end of October, the ASX 200 was down 10 per cent from its highs, but the S&P 500 was off 20 per cent, the NASDAQ by 31 per cent, Europe 17 percent and the emerging markets 32 per cent.

There are many reasons behind that variability, but a big part of it is because this correction has especially impacted shares that were trading on higher PE ratios, which were often the more growth-oriented companies such as tech. Australia, and Europe for that matter, have a higher weighting to lower PE companies such as banks and resources.

This provides investors with the chance to take advantage of markets being on sale and rebalance portfolios to improve diversification by broadening what drives returns in the portfolio. For instance, at the company specific level, by the end of October there were household names that have no comparison in Australia that had been slashed from their recent highs: Nike was down by 48 per cent, Microsoft 33 per cent, Amazon 45 per cent, Disney 54 per cent, FedEx 49 per cent, Mercedes-Benz 32 per cent, Adidas 68 percent and Samsung 28 per cent.

It is entirely possible this correction is not over, and those names will get even cheaper, but trying to pick the bottom of a cycle is notoriously difficult, if not impossible. But there is no need to rebalance all in one hit, it can be done over time, in stages.

Likewise, at this point, it’s impossible to know which markets will perform best over the coming 10 years, but by spreading your bets you give yourself a better chance of avoiding the worst performing. For context, according to Vanguard, between 2010 and 2020, the Australian market returned 7.2 per cent per year, compared to the US market’s 15.9 per cent. Franking won’t double your returns.

If you would like to discuss your investment options, please get in touch.

Should you be hedging your offshore investments?

Should you be hedging your offshore investments?

Amidst the turbulence of global financial markets this year, one of the most notable things has been the inexorable strengthening of the US dollar (USD) against every other global currency. The corollary of the strong USD has been a relatively weak Australian dollar (AUD).

One of the great lessons of the COVID Crash in 2020 for anyone investing in overseas assets was the more than 40 per cent difference that investing in a hedged version made to returns over the following year.

Hedging is like a form of insurance where a manager neutralises the so-called ‘currency effect’ of the AUD rising, or becoming more expensive, relative to other currencies, so that the investment’s return only reflects the change in its underlying value.

For example, buying USD20,000 worth of US shares when the AUD is buying 65 US cents, will cost A$30,769 (20,000/0.65).

If the share price rises by 10 per cent over the next year and the currency remains unchanged, the investment will be worth A$33,846 (22,000/0.65).

However, if instead the AUD appreciates by 20 per cent, to 78 cents, the investment would only be worth A$28,205 (22,000/0.78). The currency effect has more than wiped out the benefits of the higher share price.

Buying a hedged version of the investment in the first place takes the currency effect out of the equation, so the return would equal the change in the underlying investment, in this case 10 per cent, regardless of what the AUD does.

Why not hedge all the time?

Given that example, it might sound sensible to simply buy a hedged version of any overseas investment and not worry about what happens to the Little Aussie Battler. But there are times when the heightened volatility of the AUD can work to your advantage and being unhedged can help returns.

For example, buying USD20,000 worth of hedged US shares when the AUD is trading at 75 US cents would cost you A$26,667 (20,000/0.75). If the shares fell in value by 10 per cent, the investment would be worth A$24,000 (18,000/0.75).

However, if the AUD exchange rate had fallen to 65 US cents over the same period, the value of the investment will have gone up to A$27,692 (18,000/0.65). Given the AUD is seen as more risky than the USD, and in a downturn investors often rush to safe haven assets like the USD, this scenario is not unrealistic.

Is the AUD cheap enough to hedge now?

Unfortunately, there is no scientific formula to work out whether the AUD is cheap versus other currencies. Last year, research was released that examined more than 50,000 currency forecasts from 136 different institutions over a 15-year period that concluded the forecasts were worse than what you could achieve from random predictions, in other words guessing.

Dan Miles, the Chief Investment Officer at Innova Asset Management, which uses a lot of quantitative (maths based) analysis to determine asset allocation and portfolio construction, says, “Historically, because the Aussie dollar has been seen as a risky currency compared to the US dollar, it’s done a pretty good job of helping to insulate investors against share market volatility. So our policy has been to remain unhedged unless the exchange rate gets to extremes.”

What is ‘extreme’? Miles admits there is no effective mathematical rule to apply but observes that the currency has averaged USD0.76 over the past 30 years, and got to as low as USD0.61 in the GFC and USD0.57 in the COVID crisis. At levels of around USD0.64, he believes it is defendable to be 50 per cent hedged.

Hedge your bets on hedging

Smart investors that are already holding overseas shares that are entirely unhedged, even at a loss, could consider switching to a hedged version for a portion of the holding if there is one available.

However, something else to bear in mind is that whilst the AUD has fallen against the USD this year, it has strengthened against the euro, yen and pound. Before deciding to hedge an investment it might pay to check what its currency exposures are.

Chart 1: the AUD has fallen against the USD, but strengthened against the euro and pound, USD index (+20.4%), AUD (-15.4%), euro (-16.4%) and pound (-20.1%)

Alternatively, another option is to buy a currency ETF as a kind of insurance overlay. For example, the BetaShares Strong Australian Dollar Fund (AUDS) is designed to increase by more than 2 per cent if the Australian dollar rises against the US dollar by 1 per cent. Their Strong US Dollar Fund does the opposite.

Finally, for long-term investors the third option is to do nothing. There is research that argues the long-term effects of currency fluctuations are negligible because it tends to gyrate around the average. So those times the AUD appears cheap simply offset those when it appears expensive.

If you would like to discuss whether hedging would be right for you, please get in touch.

How to get your head around fixed income

How to get your head around fixed income

Article featured in the AFR

Fixed income returns over the fiscal 2022 year were the worst on record. When share markets experience returns like that investors have understandably become conditioned to look for bargains, but fixed income markets don’t necessarily work the same way.

Any well diversified portfolio will include defensive holdings designed to reduce its overall volatility and cushion the effects of falling share markets. Fixed income investments normally play that role, and that typically means allocating to government or corporate bonds, which are two very distinct markets, driven by different factors.

Because bonds issued by governments of developed nations are almost certain to be repaid, the price they trade at is not normally influenced so much by their credit rating as the outlook for inflation in their home country. If the market expects inflation to rise, investors will demand a higher yield to compensate, which requires a lower price and vice versa.

By contrast, while inflation also plays a role in pricing of corporate bonds, credit risk is the biggest issue, that is, the risk the company defaults and you don’t get your money back. Consequently, corporate bond prices are more sensitive to the outlook for recession, when company earnings come under increased pressure. The more investors are worried about recession, the higher the premium, or credit spread, to investing in risk-free government bonds they will demand.

Andrew Papageorgiou, managing partner at Realm Investment House, explains, “Just like bargain hunting in the share market, there are short and long-term considerations for fixed income investing. However, unlike the share market, fixed income markets have nuances that are only revealed through information that’s tough for non-professional investors to get their hands on.”

For example, in considering whether it’s a good time to invest in Australian government bonds, it helps to know that, according to the swaps market, inflation is currently forecast to average 2.6 per cent over the next 10 years. If the 10-year bond is yielding 3.15 per cent, that gives you a ‘real’ yield (after inflation) of 0.55 per cent. Is that a fair return? The average real yield over the past 15 years was 0.8 per cent, which makes it look a little low, but the post-GFC average has been 0.13 per cent, which makes it look much better.

In the US the current real yield on 10-year bonds is minus 0.05 per cent, which sounds pretty lousy, but the post-GFC average has been minus 0.17 per cent. Still, with the uncertainty around inflation, a negative real return is tough to swallow. For instance, in June, the real yield was 0.5 per cent, but since then inflation expectations have tumbled.

Meanwhile, credit spreads, or the risk premium, for Australian corporate bonds are as high as they were during the March 2020 COVID crisis. Papageorgiou points out that’s not a good reflection of the current perceived risk of recession, especially compared to the crazy time of early 2020, but is more to do with technical factors. So parts of that market look attractive, particularly compared to the US, where credit spreads are much less generous.

For the longer-term outlook, Damien Hennessy, of Zenith Investment Partners, says the current market signals around whether inflation has peaked, or economies will recess are so mixed that it’s difficult to view fixed income as a set and forget strategy right now. He points out that bond yields in June spiked to levels where he recommended reducing underweight positions but have since fallen again making them less attractive.

For investors who are game to increase their allocation to fixed income, just like with shares, there are passive and active options. Rather than trying to pick individual bonds, which introduces concentration risk, a fund will provide diversification. For passive investors, Vanguard offers both Australian and international government bond ETFs, credit ETFs and blended ETFs.

For investors who prefer to leave the decisions to professional managers, there are many to choose from. A good adviser will be able to help with curated recommendations.

For investors who see fixed income markets as just too uncertain, one option for the defensive portion of a portfolio is cash, which also provides flexibility for picking up bargains. However, with inflation currently many times higher than the bank interest rates on offer, it is guaranteed to lose purchasing power.

Portfolios always benefit from holding defensive assets to protect them against volatility, and over the past 40 years the long-term decline in interest rates has been very kind to smart investors. However, just as with equities, the uncertain outlook for inflation is a game changer.

At Steward Wealth, we went underweight both government and corporate bonds a few years ago and instead invested into ‘private credit’, that is, deals that are not open to the public at large and are usually senior secured mortgages over building and property developments. These loans have the dual benefits of not trading on public markets, so their value doesn’t go up and down like a bond, and they typically pay generous interest of between 5-8 per cent per annum.

Those loans carry their own risks, which have become evident this year with several high profile construction companies going bankrupt. However, we are in regular contact with the lenders and feel comfortable with their assurances that their screening and due diligence processes have become even more stringent. At the same time, the commercial banks have reduced lending to the sector which is throwing up lots of very attractive opportunities at higher rates of return.

Want to discuss your investment strategy with a specialist?

Why you’ll make more by focusing on a portfolio’s total return

Why you’ll make more by focusing on a portfolio’s total return

Article featured in the AFR

Australians love their dividends. And what’s not to love? Those semi-annual dividend deposits are one of the great benefits of investing in a capitalist society.

John D. Rockefeller famously said, “Do you know the only thing that gives me pleasure? It’s to see my dividends coming in”.

One of the most popular strategies for investors, especially retirees, is to buy high dividend paying shares with the aim of generating sufficient income to live on while hopefully leaving the portfolio principal intact.

While this holds obvious appeal, particularly for investors who are anxious about outliving their money, and benefits from dividends typically being far more predictable than earnings, it is a very constricting approach and carries some risks.

High dividend paying companies tend to offer lower growth. Clearly, if a company is paying generous dividends, it leaves less income to reinvest into the company’s operations. While it’s by no means a universal rule, if a company is able to generate a high return on the equity invested into the business it makes more sense for management to do that rather than pay it out as dividends.

That means a portfolio full of high dividend paying companies is less likely to provide as much capital growth as a more diversified portfolio. If the strategy is to maintain the portfolio’s capital value, then that may not be reason to lose sleep, but over time, it does mean the portfolio won’t benefit as much as it may from the share market’s long history of growth. This is especially true during a period like we saw between 2009-2021 where growth-oriented companies outperformed strongly.

An alternative strategy for investing a portfolio can be to take what’s referred to as a ‘total return approach’, which takes account of both income as well as capital growth. The key to this strategy is to feel comfortable meeting target income requirements by paying a ‘dividend’ from the portfolio by harvesting some of the long-term capital gains.

In other words, imagine an investor with a $1 million investment portfolio who needs $60,000 per year to cover living expenses. If the portfolio generates income of $40,000, they would make up the balance by selling $20,000 worth of investments each year.

To illustrate the benefits of a total return approach, let’s presume it’s the start of 2012 and two investors each have $100,000 to invest as part of a larger overall portfolio. The first buys $100,000 worth of Telstra shares, which were trading on a prospective dividend yield of an amazing 12 per cent, including franking benefits.

The second buys $100,000 worth of CSL shares, which were trading on a prospective yield of a modest 2.6 per cent. However, they decide to sell as many shares as required at the end of each year to bring the total ‘income’ to $12,000 (to match the Telstra yield).

How did the two strategies stack up over 10 years to the very end of 2021? The Telstra shares will have delivered a total of $103,721 of income, but for the last four years the investor was forced to sell a total of $20,255 worth of shares to maintain the $12,000 targeted income. The closing value of the holding was $100,761, so the total return was $124,737 (i.e. net of the initial investment of $100,000) for a compounded annual return of a still respectable 8.4 per cent.

For our other investor, despite having to sell a total of $70,179 worth of CSL shares over the 10 years in order to meet the $12,000 per year income requirement, the closing value of $709,109 plus that $120,000 of ‘income’ delivered a total return of $729,109, or a compounded annual return of 23.6%.

Clearly you could hardly choose a more favourable pair of stocks to illustrate the point, but if the first investor had split the $100,000 equally between the big four banks for a target annual income of $10,000, after 10 years the total return would have been $146,498 or 9.4 per cent per year.

The same investment into the iShares S&P 500 ETF (IVV) and again selling shares to fund the required ‘income’, would have delivered a total return of $371,122, or a 19 per cent annual return.

Source: MarketIndex.com, Steward Wealth

With shares now on sale, smart investors should be mindful of constructing a diversified portfolio that benefits not only from those welcome dividend deposits, but from the inexorable long-term growth that share markets have to offer.

Want to discuss your investment strategy with a specialist?