A plain English guide to the financial market effects of the ‘Virus Crisis’

A plain English guide to the financial market effects of the ‘Virus Crisis’

With the inundation of COVID-19 news coverage we’re all having to live through, I thought I’d jot down a few thoughts on a bunch of different topics related to financial markets. Short and sweet(ish).

How does this bear market compare?

While every bear market’s different in terms of the cause, depth and duration, this one stands out because it’s a rare occasion where it started in the real economy and transmitted to the financial markets, rather than the other way around. You could argue the 1970’s OPEC-related slump was similar, but even there, the macro picture was very different with high inflation. That makes it harder to get a grasp of how things might play out and how effective the rescue measures from governments and central banks will be.

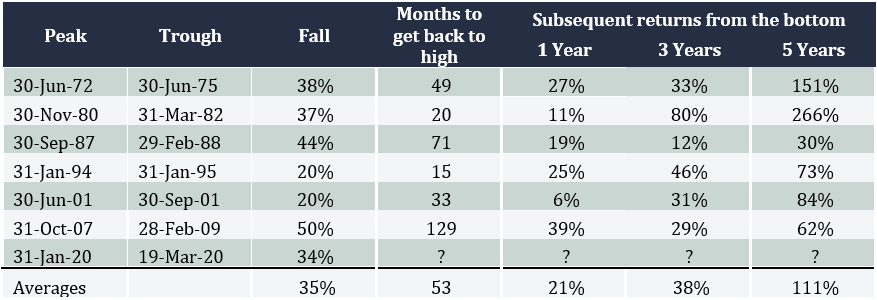
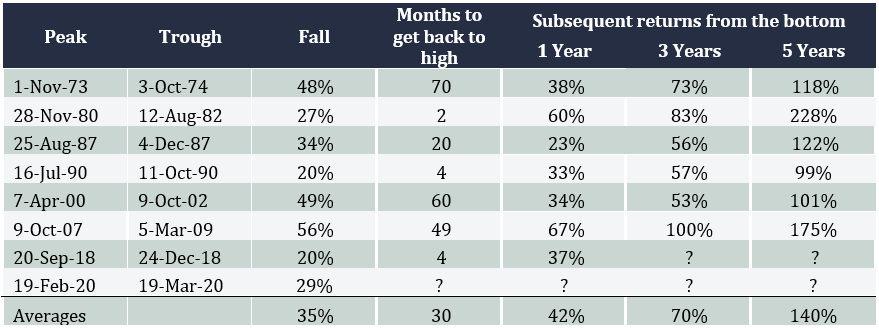
Over the last 50 years we’ve seen seven bear markets in Australia (that is, falls of more than 20%), including the current one, with an average decline of 35%. The US has also seen six with an average fall of 42%. The current ‘virus-crisis’ has seen our market drop 34% to the close on 19 March and 29% for the US.

One of the things that makes this different is because the crunch is coming from both the supply side and the demand side. When China shut down, those companies that rely on Chinese manufactured goods for their own business were struggling to fill the gap. And now that more and more of the world is going into quarantining and isolation, consumers aren’t spending. So the proverbial double-whammy.

Where are we up to with this one?

What level of economic slowdown is being priced in by share markets right now is tough to say with any accuracy.

Asset allocation consultant, Heuristic Investment Systems, reckons for the US, in an ‘average recession’ where GDP drops by 2%, a bear market tends to see the S&P 500 fall by 25-30%, and in a deeper recession, like the GFC, the average fall is 40-50%. On that basis, the markets are currently pricing in an average recession.

By contrast, the Bloomberg Chief Equity Strategist, Gina Martin Adams, says the S&P 500’s ‘trailing price to earnings (PE) ratio’, which refers to the earnings that were reported by companies over the past year, which at least has some certainty, is now about 15. Compared that to her ‘fair’ multiple, it implies a worse than average recession with earnings declining 22% over the next year.

What happens after bear markets?

The tables below show how far Australian and US share markets have fallen during each bear market over the past 50 years, how long they took to get back to where the index started, and then what returns were like 1, 3 and 5 years after.

For Australia, the average three year compounded annual return works out to be more than 11%, and in the US it’s an amazing 19%. Given it appears interest rates are likely to stay very low for a long time, that represents an attractive return, and is one of the arguments in favour of a sharp rebound in shares.

Australia bear markets since 1970: extent of falls and subsequent returns
A plain English guide to the financial market effects of the Virus Crisis image1
US bear markets since 1970: extent of falls and subsequent returns
A plain English guide to the financial market effects of the Virus Crisis image2

Why has this bear market been so volatile?

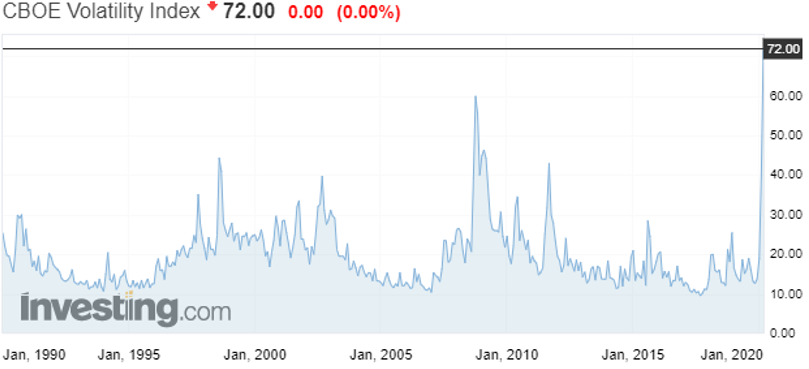
The VIX index in the US measures share market volatility, and the chart below shows it’s hit eye-popping levels in the past couple of weeks, every bit as stomach-churning as the GFC.

Share market volatility has spike to all-time highs
A plain English guide to the financial market effects of the Virus Crisis image3

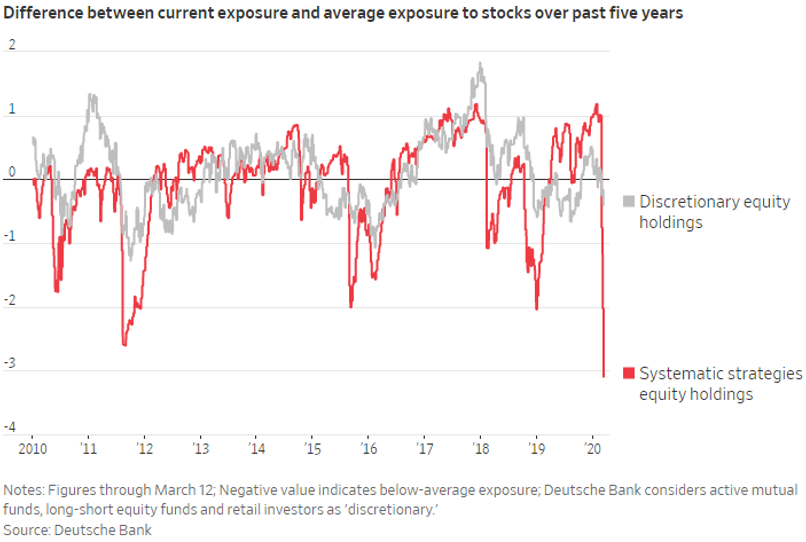
While it’s almost impossible to get definitive numbers, it appears much of the volatility is coming from so-called ‘systematic strategies’, essentially computer-driven funds that trade automatically depending on all kinds of different variables, like momentum or volatility or depending on what’s happening in other markets like bonds or commodities, and then there are the ‘high frequency trading’ funds that aim to jump in ahead of any trades at all. The chart below shows how sharply some funds have dumped their equity positions.

Computer-driven funds have been very active
A plain English guide to the financial market effects of the Virus Crisis image4

What’s happening in bond markets?

Bond markets have been every bit as crazy as share markets, but in a scarier way. Credit markets facilitate the flow of money around the financial system, with trillions of dollars’ worth of deals being done around the world on a day to day basis. It’s these markets that keep the banking system working properly.

Last week, however, the flow was getting choked off because companies were frantically trying to get their hands on cash. Large companies will typically arrange lines of credit with their banks that they can draw on when needed. If companies think there’s a risk they might need cash urgently, because, for example, their business has all but closed down during a quarantine, they’ll go to their bank and draw all that cash out. But there’s a limit to how much cash banks will have on hand, so when they started getting hit up by their customers, they had to go to the credit markets and try to raise cash by selling bonds. However, when everyone’s trying to raise cash at the same time, a market can quickly run out of buyers, so the risk premium they’re willing to trade at rockets (another way of saying the price they offer to buy at goes down), as shown in the chart below, and that’s how the financial flows were getting choked up.

Credit markets were running out of buyers, reflected by risk premia rocketing
(Chart is of the US High Yield Index Option-Adjusted Spread)
A plain English guide to the financial market effects of the Virus Crisis image5

Fortunately, the central banks were able to ride to the rescue and pump liquidity into the system to calm things down a bit, but we’ve seen similar huge jumps in what’s called ‘credit spreads’ across the whole credit market, right around the world, which is seeing a sharp repricing of corporate bonds.

What are central banks and governments doing?

In current markets, central banks and governments have quite different roles to play.

Central banks are focused on keeping credit markets operating, and between them they’ve promised to inject trillions of dollars to make sure that happens. That was a big part of the package of measures the Reserve Bank announced this week, which included cutting interest rates to 0.25% to reduce the cost of credit and basically saying the rate will stay there for as far as we can see, and it’s making some $90 billion of funding available to banks to lend out for which it will charge them only 0.25%. It also said it’s going to try to make sure the Australian 3 year bond trades at a yield of 0.25% and finally announced it’s going to join the quantitative easing brigade.

The US Fed has also cut rates to basically 0%, so has the Bank of England and the Reserve Bank of New Zealand. The ECB was already there (in fact their rates are negative) plus it said it will expand its balance sheet by €750 billion and allow qualifying banks to borrow up to €2 trillion at a rate of -0.75% – that’s right, they’ll pay banks to take the money from them!

There will be howls from free marketeers criticising the central banks for supporting asset prices, but that’s an unfair characterisation of what they’re doing, which is more like keeping the financial plumbing open to provide a bridge to governments’ fiscal spending.

And governments have certainly said they’ll spend. After years and years of central banks begging governments to open their wallets, we’ve seen what looks like massive programs being announced: $1.2 trillion in the US, £330 billion in the UK, €1 trillion from European governments to guarantee business loans, and, of course, what appears to be a relatively paltry $17 billion here in Australia. While they sound like huge numbers, rest assured, governments will need to do more if they want to backstop their economies.

This may finally be the time for governments and economists all over the world to wrap their heads around Modern Monetary Theory.

When will the market recover?

We’ve been fielding lots of inquiries from clients asking when they should buy but unfortunately there’s absolutely nobody on the planet that can give you a good answer to that question. What I think I can say is the market will start to recover once it believes the odds that we’re through the worst of it go to 50.1%, from 49.9%, but exactly how that can be judged I don’t know. It could be a slowdown in the rate of new cases, or even confirmation that current treatments are indeed working, or acceptance that governments will indeed spend enough to backstop economies.

Given the hopeless execution by the Trump administration in the US you’d have to think they have a long way to go, and here in Australia numbers are still doubling every 2-3 days.

A huge opportunity

One thing’s for certain, share markets are very cheap once again, and the further they go down the higher will be the returns on the other side. If you’re in the lucky position of being able to invest, don’t fall for just buying the most beaten up stocks, who knows, some of them may never recover. Similarly, if you already own shares, you should ask yourself if you’d buy the same ones now. Rather, my suggestion would be to think about the portfolio you wished you’d owned just before things went pear-shaped, and target that.

It’s impossible not to sound cliched, but these are genuinely extraordinary times, especially for Australia. Having endured a summer where it felt like the whole country was on fire, we now have a global pandemic wreaking economic havoc. I wish you all the best and stay safe.

Portfolio update

Portfolio update

With market volatility hitting multiyear highs on the back of the implications of COVID-19 and the oil price dropping, we convened an extraordinary meeting of the Investment Committee yesterday to talk about what’s going on and whether any action needed to be taken.

The noise level is reaching fever pitch, with all forms of media talking about little else – see the chart below – which exacerbates the sense of panic, and footage of women wrestling over toilet paper drives home the astonishing effect this is having on people.


Media mentions of COVID-19

Last weekend Russia and Saudi Arabia were unable to agree on production cuts, which saw the oil price fall almost 30% over the following week and then on Monday was blamed for a rout on international share markets. Whilst the lower oil price will have clear implications for energy companies and whatever debt they might have, you’d have thought it should otherwise be a good thing for most companies and pretty much all consumers.

Obviously the greatest concern for share markets is the impact the various quarantining measures will have on company earnings and global economic activity, and that is, as yet, completely unknown, and unknowable. Share markets have fallen anywhere from 10-20% from their recent peaks, setting records for the fastest retreat from all time highs in history, which could well be overcompensating for potential earnings declines or not enough. Likewise, government bond yields have plummeted to the point where all US bonds, all the way up to 30 years, have a yield of less than 1%.

In considering whether any action should be taken on portfolios, there are many, many factors at play, and it’s full of ‘on the one hand, but on the other’. For example, we know governments and central banks have indicated they will provide support, but on the other hand, we don’t how effective those actions will be. The challenge is to focus on those things we can be sure of, as opposed to those where we are just guessing.

Another important factor is how a portfolio is structured and what’s called its ‘beta’, which is simply the technical name for how sensitive it is to the changes in share markets. A beta of 1 means a portfolio is perfectly correlated to share markets, and a beta of zero means it has no correlation at all. Steward Wealth’s portfolios include investments that are designed to reduce beta, such as the alternatives and non-secure debt, and, of course, secure debt (which is the very low volatility, ‘cash-plus’ funds).

Also, not all share markets have been as weak as the Australian, which has been a terrific example of the benefits of geographic diversification. For example, after Monday’s correction the ASX200 had declined 20% from its peak, but the Japan ETF in the portfolio (UBJ.ASX) had fallen only 8%, and the Europe ETF by 10%. Those results have been helped by the Australian dollar weakening against the big three currencies: since the start of the year it’s fallen 6% against the US$, 7% against the Euro and 11% against the Yen.

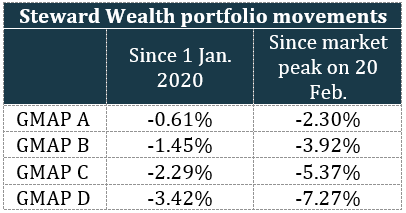
The table below summarises the movement in the four benchmark GMAP portfolios from the start of the year and since markets peaked on 20 February. This data is as at the close of business on 10 March and doesn’t include adviser charges.

Portfolio update_chart2

We hope you are as pleased with that outcome as we are.

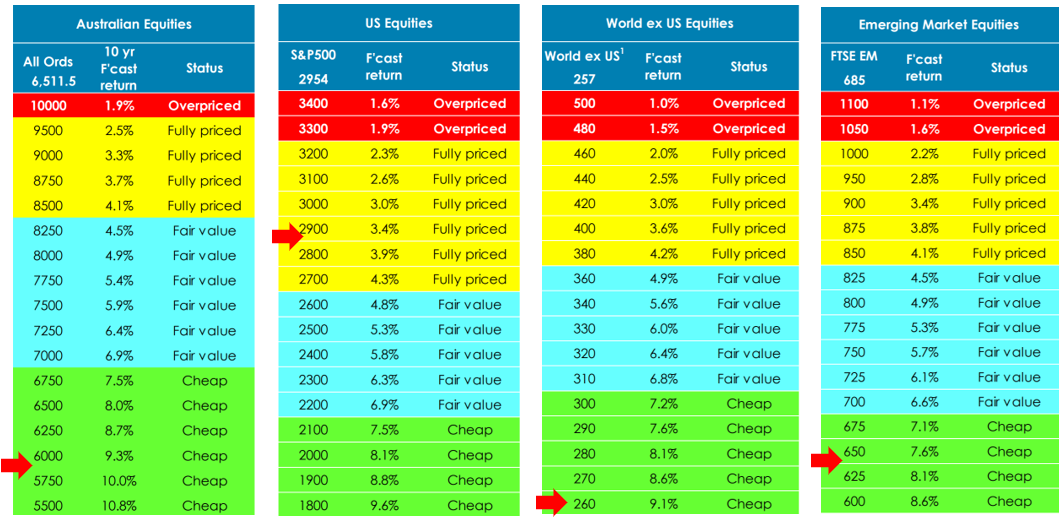
Another thing we can have a little more certainty about is valuations, which is where our asset allocation consultant, farrelly’s, is very helpful. As you’ll remember, we take a long-term approach to examining relative value, between asset classes as well as geographies. The latest tipping point tables indicate markets are uniformly offering attractive value, again, with the exception of the US.

Portfolio update_chart3

As we keep saying, there is no way of knowing when the current market volatility will subside, or where markets will be once it does, which makes trying to time ducking in and out of the market very risky. We much prefer to base portfolio moves on valuations, but we feel there are buffers in place to protect portfolios from the worst of what’s happening.

As always, please do call us if you’d like to discuss your portfolio or have a chat about what’s going on.

Coronavirus second update

Coronavirus second update

This update was written by Shane Oliver, Head of Investment Strategy and Cheif Economist at AMP Capital

Introduction

The plunge in share markets over the last week has generated much coverage and consternation. This is understandable given the rapidity of the falls – with US shares having their fastest 10% fall from an all-time high on record – and the uncertainty around the coronavirus (Covid-19) and its impact on economic activity. From their highs to recent lows US shares have fallen 13%, Eurozone shares have fallen 16%, Japanese and Chinese shares have fallen 12% and Australian shares have fallen 12%. This note looks at the issues for investors and puts the falls into context.

What’s driving the latest plunge?

The plunge basically reflects two things.

  • After very strong gains from their last greater than 5% correction into August last year, share markets had become vulnerable to a correction.
  • The uncertainty around the impact of the coronavirus outbreak which is on the verge of becoming a pandemic and its impact on global growth has unnerved investors dramatically. Shares had recovered from their initial fall on the back of the virus into early February on signs that the number of new cases in China was falling (which is continuing), limited cases outside China and expectations that policy easing would limit any damage. This has been blown apart in the last week as cases have popped up en masse in Italy, South Korea and Iran, more cases have appeared elsewhere around the world and this has resulted in expectations of a deeper and longer hit to global growth.

After big falls shares have become technically oversold, measures of negative investor sentiment such as the VIX (or fear) index and demand for option protection have spiked. So, shares could have a short-term bounce. But given the uncertainties around Covid-19 – with more cases in the US and Australia likely to pop up – the situation could get worse before it gets better, so the share pullback could have further to go – notwithstanding short-term bounces.

Considerations for investors

Sharp market falls with headlines screaming that billions of dollars have been wiped off the share market are stressful for investors as no one likes to see the value of their investments decline. The current situation is doubly stressful because of fears for our own and others health – particularly for the elderly. However, several things are worth bearing in mind:

First, while they all have different triggers and unfold a bit differently to each other, periodic corrections in share markets of the order of 5%, 15% and even 20% are healthy and normal. For example, during the tech/dot-com boom from 1995 to early 2000, the US share market had seven pull backs greater than 5% ranging from 6% up to 19% with an average decline of 10%. During the same period, the Australian share market had eight pullbacks ranging from 5% to 16% with an average fall of 8%. All against a backdrop of strong returns every year. During the 2003 to 2007 bull market, the Australian share market had five 5% plus corrections ranging from 7% to 12%, again with strong positive returns every year. More recently, the Australian share market had a 10% pullback in 2012, an 11% fall in 2013 (the taper tantrum), an 8% fall in 2014, a 20% fall between April 2015 and February 2016, a 7% fall early in 2018, a 14% fall between August and December 2018 and a 7% fall into August last year. And this has all been in the context of a gradual rising trend. And it has been similar for global shares – with the last big fall in US shares being a 20% plunge into Christmas eve 2018. See the next chart. While they can be painful, share market corrections are healthy because they help limit a build-up in complacency and excessive risk taking.

Related to this, shares climb a wall of worry over many years with numerous events dragging them down periodically, but with the long-term trend ultimately up & providing higher returns than other more stable assets. Bouts of volatility are the price we pay for the higher longer-term returns from shares.

Second, the main driver of whether we see a correction (a fall of 5% to 15%) or even a mild bear market (with say a 20% decline that turns around relatively quickly like we saw in 2015-2016) as opposed to a major bear market (like that seen in the global financial crisis (GFC)) is whether we see a recession or not – notably in the US as the US share markets tends to lead for most major global markets. The next table shows US share market falls greater than 10% since the 1970s. I know it’s heavy – but I like this table! The first column shows the period of the fall, the second shows the decline in months, the third shows the percentage decline from top to bottom, the fourth shows whether the decline was associated with a recession or not and the fifth shows the gains in the share market one year after the low. Falls associated with recessions are highlighted in red.

Several points stand out:

  • First, share market falls associated with recession tend to be longer and deeper.
  • Second, after the low the, share markets generally rebound sharply – which invariably makes it very hard for investors to time, as by the time they realise what has happened and get back in the market is above where they sold.
  • Finally, as would be expected the share market rebound in the year after the low is much greater following falls associated with recession.

So, whether a recession is imminent or not in the US is critical in terms of whether we will see a major bear market or not. In fact, the same applies to Australian shares. Our assessment is that a US/global recession is not inevitable. We have not seen the excesses – in terms of overall debt growth (although housing debt is a source of risk in Australia), overinvestment, capacity constraints and inflation – that normally precede recessions in the US, globally or Australia. And we have not seen the sort of monetary tightening that leads into recession. In fact, monetary conditions remain very easy. However, the uncertainty around the coronavirus outbreak and the likelihood of economic shutdowns designed to contain it beyond those in China do suggest a greater than normal risk on this front. That said even if there were a recession growth would likely rebound quickly once the virus came under control as economic activity sprang back to normal helped by policy stimulus.

Third, selling shares or switching to a more conservative investment strategy or superannuation option after a major fall just locks in a loss. With all the talk of billions being wiped off the share market, it may be tempting to sell. But this just turns a paper loss into a real loss with no hope of recovering. The best way to guard against making a decision to sell on the basis of emotion after a sharp fall in markets (as many including me are tempted to do!) is to adopt a well thought out, long-term strategy and stick to it.

Fourth, when shares and growth assets fall, they are cheaper and offer higher long-term return prospects. So, the key is to look for opportunities the pullback provides – shares are cheaper and some more than others. It’s impossible to time the bottom but one way to do it is to average in over time.

Fifth, while shares have fallen, dividends from the market haven’t. They will come under some pressure as the economy and profits take a hit from a deeper and longer coronavirus outbreak. But companies like to smooth their dividends over time – they never go up as much as earnings in the good times and so rarely fall as much in the bad times. So, the income flow you are receiving from a well-diversified portfolio of shares is likely to remain attractive, particularly against bank deposits.

Sixth, shares and other related assets often bottom at the point of maximum bearishness, ie, just when you and everyone else feel most negative towards them. So, the trick is to buck the crowd. “Be fearful when others are greedy. Be greedy when others are fearful,” as Warren Buffett has said.

Finally, turn down the noise. At times like this, negative news reaches fever pitch. Talk of billions wiped off share markets and warnings of disaster help sell copy and generate clicks & views. But we are rarely told of the billions that market rebounds and the rising long-term trend in share prices adds to the share market. Moreover, they provide no perspective and only add to the sense of panic. All of this makes it harder to stick to an appropriate long-term strategy let alone see the opportunities that are thrown up. So best to turn down the noise.


Coronavirus second update

Coronavirus update

This update was written by Michael Cembalest, Chairman of Market and Investment Strategy for J.P. Morgan Asset & Wealth Management

By now you have all probably seen the news on the spike in reported cases outside of China.  The coronavirus disease is apparently communicable even by those who are not showing signs of having it, which is making it harder to control.  The number of new infections in Wuhan/Hubei and the rest of China are falling sharply (latest new infection rate was 630 in Hubei and 20 in the rest of China).  However, markets are reacting to the jump in reported cases cumulative outside China (mostly in S. Korea, Italy, Japan and Iran), as well to the 700 people infected on the Diamond Princess ship (out of 3700 total crew/passengers).

 Here is the latest information from the Chinese Center for Disease Control on mortality rates.  While the average coronavirus mortality rate is reported to be around 2.3%, COVID-19 primarily affects older individuals with pre-existing conditions, whose mortality rates are much higher.  Individuals below the age of 50 and/or those with no pre-existing conditions have mortality rates well below 2% (almost 0% for people below the age of 40).  Be careful with mortality rates, there are a lot of them being reported, and they all depend on the methodology.  For example, as a percentage of hospitalized cases with a specific outcome (mortality or discharged/recovered), mortality rates are closer to 10%.  And out of all cases of currently infected individuals, 78% are in mild condition and 22% are in critical condition.

 It is hard to pinpoint what the economic outcomes might be, but they look worse than they did a few weeks ago.  The first chart below is an estimate of the impact of the virus on Q1 GDP in different countries.  The second chart looks at “supplier delivery times”, which reflects the extent to which supply chains are disrupted by the virus.  The last time the disruption rate was this high was in the wake of the Fukushima tsunami/earthquake.


 Within China, we are tracking indicators that reflect the impact of the lockdown on Chinese activity.  Here’s how to read the next chart.  Twenty days after the Chinese Lunar New Year (Feb 14) was the low point for economic activity due to quarantines and travel bans.  At that time, for example, electricity consumption was running at 40% of its normal level for that time of the year.  As of the latest reading, that hasn’t changed.  Only coal deliveries, passenger flows and home sales have picked up since the low levels, and even these have only risen by a  small amount.  I think it’s fair to say that this is the biggest negative shock the global economy has seen since the financial crisis.   It’s hard to know for sure, but the decline in the US freight index could reflect part of the knock-on effects of the situation in China.


 Even so, JP Morgan’s Investment Bank, as well as a lot of other research providers we follow, believe that there will be an eventual bounce once the crisis is over (second chart), and that global growth will revert to where it was before the virus outbreak.  This has been the pattern after other viruses, and after natural disasters such as the Kobe earthquake and the Fukushima tsunami.