With the inundation of COVID-19 news coverage we’re all having to live through, I thought I’d jot down a few thoughts on a bunch of different topics related to financial markets. Short and sweet(ish).
How does this bear market compare?
While every bear market’s different in terms of the cause, depth and duration, this one stands out because it’s a rare occasion where it started in the real economy and transmitted to the financial markets, rather than the other way around. You could argue the 1970’s OPEC-related slump was similar, but even there, the macro picture was very different with high inflation. That makes it harder to get a grasp of how things might play out and how effective the rescue measures from governments and central banks will be.
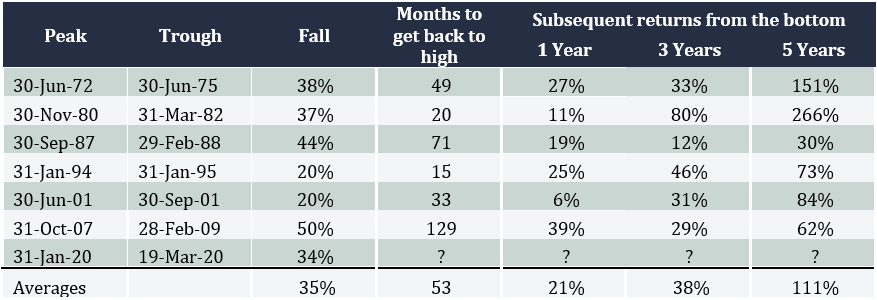
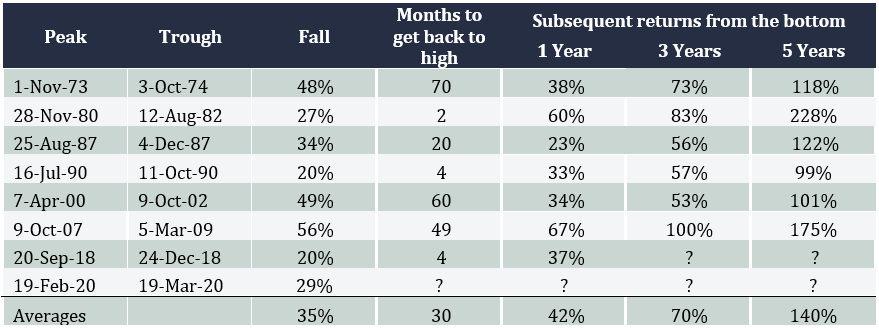
Over the last 50 years we’ve seen seven bear markets in Australia (that is, falls of more than 20%), including the current one, with an average decline of 35%. The US has also seen six with an average fall of 42%. The current ‘virus-crisis’ has seen our market drop 34% to the close on 19 March and 29% for the US.
One of the things that makes this different is because the crunch is coming from both the supply side and the demand side. When China shut down, those companies that rely on Chinese manufactured goods for their own business were struggling to fill the gap. And now that more and more of the world is going into quarantining and isolation, consumers aren’t spending. So the proverbial double-whammy.
Where are we up to with this one?
What level of economic slowdown is being priced in by share markets right now is tough to say with any accuracy.
Asset allocation consultant, Heuristic Investment Systems, reckons for the US, in an ‘average recession’ where GDP drops by 2%, a bear market tends to see the S&P 500 fall by 25-30%, and in a deeper recession, like the GFC, the average fall is 40-50%. On that basis, the markets are currently pricing in an average recession.
By contrast, the Bloomberg Chief Equity Strategist, Gina Martin Adams, says the S&P 500’s ‘trailing price to earnings (PE) ratio’, which refers to the earnings that were reported by companies over the past year, which at least has some certainty, is now about 15. Compared that to her ‘fair’ multiple, it implies a worse than average recession with earnings declining 22% over the next year.
What happens after bear markets?
The tables below show how far Australian and US share markets have fallen during each bear market over the past 50 years, how long they took to get back to where the index started, and then what returns were like 1, 3 and 5 years after.
For Australia, the average three year compounded annual return works out to be more than 11%, and in the US it’s an amazing 19%. Given it appears interest rates are likely to stay very low for a long time, that represents an attractive return, and is one of the arguments in favour of a sharp rebound in shares.
Australia bear markets since 1970: extent of falls and subsequent returns

US bear markets since 1970: extent of falls and subsequent returns

Why has this bear market been so volatile?
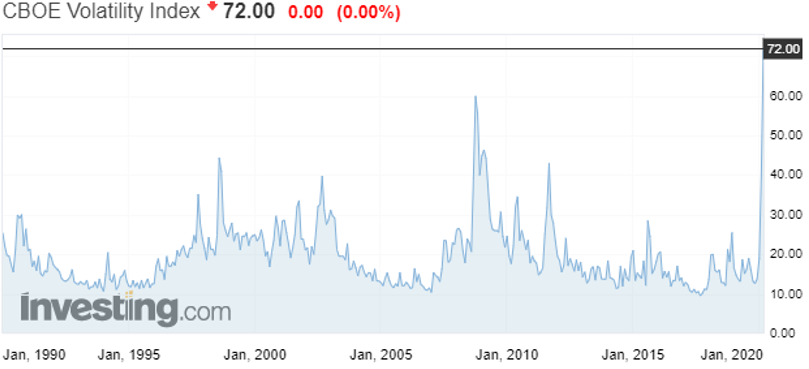
The VIX index in the US measures share market volatility, and the chart below shows it’s hit eye-popping levels in the past couple of weeks, every bit as stomach-churning as the GFC.
Share market volatility has spike to all-time highs

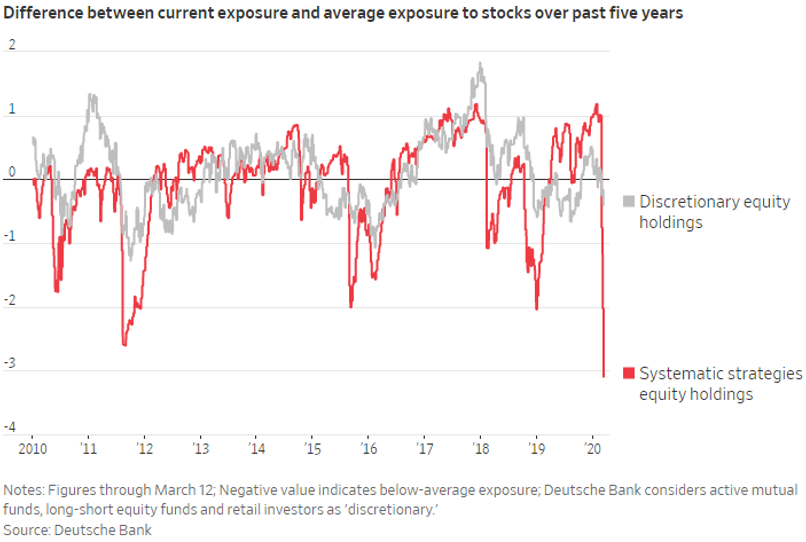
While it’s almost impossible to get definitive numbers, it appears much of the volatility is coming from so-called ‘systematic strategies’, essentially computer-driven funds that trade automatically depending on all kinds of different variables, like momentum or volatility or depending on what’s happening in other markets like bonds or commodities, and then there are the ‘high frequency trading’ funds that aim to jump in ahead of any trades at all. The chart below shows how sharply some funds have dumped their equity positions.
Computer-driven funds have been very active

What’s happening in bond markets?
Bond markets have been every bit as crazy as share markets, but in a scarier way. Credit markets facilitate the flow of money around the financial system, with trillions of dollars’ worth of deals being done around the world on a day to day basis. It’s these markets that keep the banking system working properly.
Last week, however, the flow was getting choked off because companies were frantically trying to get their hands on cash. Large companies will typically arrange lines of credit with their banks that they can draw on when needed. If companies think there’s a risk they might need cash urgently, because, for example, their business has all but closed down during a quarantine, they’ll go to their bank and draw all that cash out. But there’s a limit to how much cash banks will have on hand, so when they started getting hit up by their customers, they had to go to the credit markets and try to raise cash by selling bonds. However, when everyone’s trying to raise cash at the same time, a market can quickly run out of buyers, so the risk premium they’re willing to trade at rockets (another way of saying the price they offer to buy at goes down), as shown in the chart below, and that’s how the financial flows were getting choked up.
Credit markets were running out of buyers, reflected by risk premia rocketing
(Chart is of the US High Yield Index Option-Adjusted Spread)

Fortunately, the central banks were able to ride to the rescue and pump liquidity into the system to calm things down a bit, but we’ve seen similar huge jumps in what’s called ‘credit spreads’ across the whole credit market, right around the world, which is seeing a sharp repricing of corporate bonds.
What are central banks and governments doing?
In current markets, central banks and governments have quite different roles to play.
Central banks are focused on keeping credit markets operating, and between them they’ve promised to inject trillions of dollars to make sure that happens. That was a big part of the package of measures the Reserve Bank announced this week, which included cutting interest rates to 0.25% to reduce the cost of credit and basically saying the rate will stay there for as far as we can see, and it’s making some $90 billion of funding available to banks to lend out for which it will charge them only 0.25%. It also said it’s going to try to make sure the Australian 3 year bond trades at a yield of 0.25% and finally announced it’s going to join the quantitative easing brigade.
The US Fed has also cut rates to basically 0%, so has the Bank of England and the Reserve Bank of New Zealand. The ECB was already there (in fact their rates are negative) plus it said it will expand its balance sheet by €750 billion and allow qualifying banks to borrow up to €2 trillion at a rate of -0.75% – that’s right, they’ll pay banks to take the money from them!
There will be howls from free marketeers criticising the central banks for supporting asset prices, but that’s an unfair characterisation of what they’re doing, which is more like keeping the financial plumbing open to provide a bridge to governments’ fiscal spending.
And governments have certainly said they’ll spend. After years and years of central banks begging governments to open their wallets, we’ve seen what looks like massive programs being announced: $1.2 trillion in the US, £330 billion in the UK, €1 trillion from European governments to guarantee business loans, and, of course, what appears to be a relatively paltry $17 billion here in Australia. While they sound like huge numbers, rest assured, governments will need to do more if they want to backstop their economies.
This may finally be the time for governments and economists all over the world to wrap their heads around Modern Monetary Theory.
When will the market recover?
We’ve been fielding lots of inquiries from clients asking when they should buy but unfortunately there’s absolutely nobody on the planet that can give you a good answer to that question. What I think I can say is the market will start to recover once it believes the odds that we’re through the worst of it go to 50.1%, from 49.9%, but exactly how that can be judged I don’t know. It could be a slowdown in the rate of new cases, or even confirmation that current treatments are indeed working, or acceptance that governments will indeed spend enough to backstop economies.
Given the hopeless execution by the Trump administration in the US you’d have to think they have a long way to go, and here in Australia numbers are still doubling every 2-3 days.
A huge opportunity
One thing’s for certain, share markets are very cheap once again, and the further they go down the higher will be the returns on the other side. If you’re in the lucky position of being able to invest, don’t fall for just buying the most beaten up stocks, who knows, some of them may never recover. Similarly, if you already own shares, you should ask yourself if you’d buy the same ones now. Rather, my suggestion would be to think about the portfolio you wished you’d owned just before things went pear-shaped, and target that.
It’s impossible not to sound cliched, but these are genuinely extraordinary times, especially for Australia. Having endured a summer where it felt like the whole country was on fire, we now have a global pandemic wreaking economic havoc. I wish you all the best and stay safe.


