The commentary below is from our asset allocation consultant, farrelly’s. It is their relative value analysis that informs the Steward Wealth Investment Committee’s asset allocation decisions.
At the start of last week, our quarterly update began with “The market correction at the end of February has taken us back into Fair Value and Cheap territory for most asset classes. This is a time to be fully invested – even though it may feel uncomfortable. This is what long-term investing is all about.”
Today, that statement is even more true. This is a time to buy, not sell.
Friday the 13th and Monday the 16th
After 40-plus years in the industry, you think you’ve seen it all. And yet, Friday 13th March was like nothing I have ever seen. The Australian market was down close to 10% in the morning and then rallied 14% in the afternoon to end the day up 4%. Apparently, it was the biggest intra-day turnaround in Australian share market history. The New Zealand market did much the same but closed before all the ground was made up, while the US market exploded up by almost 7% in the last hour of Friday’s trading. And, then came Monday 16th with the Australian market falling 9.5%, and the S&P500 off 12%. These are massive moves – efficient markets don’t do this. Even inefficient markets don’t do this!
So, we are in uncharted territory. However, on reflection, we always are. Every bear market is different – different causes, different speed, different depth.
Every bear market is different
My first day at work in the investment industry was in February1976, just out of secondary school. My job was to copy all the stock prices from the newspaper and to update our 250+ stock charts by with a Rotring pen and Letraset. While I didn’t witness firsthand the horrors of the 1974 bear market (-53% in Australia with the leaders, BHP and the banks, falling 70% to 80%), my older colleagues would grow ashen faced as they described it. I could see it in the charts I was updating. It felt like I was there.
Then came the 1980-82 bear market which seemed to go on forever. In 1987, the bear market was over in a matter of weeks, although the scars remained for much longer. The 2000 tech wreck was a straightforward matter of avoiding the grossly overpriced US market loaded with tech stocks. The 2008 Global Financial Crisis was terrifying, as there was a real possibility we were witnessing the collapse of the global financial system.
And so, while reflecting on how different this bear market feels, I realised that each bear market has been different and terrifying in its own way. What is the same in each case is that valuations provide a very clear guide to what to do. The simple question we need to ask again is “what impact will all this have on long-term company earnings?”
Long-term Earnings Per Share
In farrelly’s view, the impact of coronavirus on EPS in 10 years will be modest. Companies will need to re-think the diversification of their supply chains. This is already happening. No longer will everything be produced by the most efficient, low-cost producer. Costs will rise a little, some of which will be passed on to consumers and some of which will reduce profits. But even a 10% hit to long-term profits will only reduce expected returns by 1% per annum over the next decade. Cheap assets are still cheap.
Impact of a recession
Over the course of the past week, our assessment of the possibility of a recession has gone from “distinctly possible” to “highly likely”. While recessions clearly have short-term impacts on EPS, longer-term impacts tend to be minor unless we see large-scale corporate failures and large scale capital raisings at depressed prices, particularly by the banks. Neither seems likely at this point.
Our expectation is that corporate failures will be low. The level of corporate debt is not excessive worldwide, interest rates will remain very low, and banks are unlikely to take an aggressive approach with corporates who fall behind on payments. Governments may step in to help as well, although in what form is not yet clear.
The banks – particularly in Australia – are extremely well capitalised with the majority of their lending exposure to residential property. What some have touted as a weakness will become a strength. The banks will have an increase in corporate loan losses, but these are likely to be modest and temporary.
Valuations remain sound
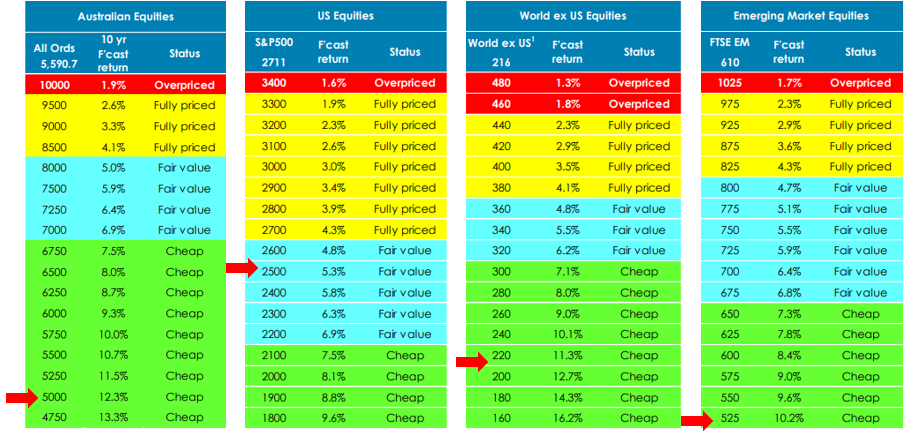
The Tipping Point Tables are a sea of green. At 10% to 12% per annum, expected returns of Risky Assets are a long, long way ahead of expected returns on Secure Assets. Even if farrelly’s earnings growth forecasts are vastly overstated, returns from equities and commercial property will be much better than returns from bonds or term deposits. For long-term investors, this is a buying opportunity.
Figure 1: Tipping Point Tables as at 18 March 2020

Markets over-react. This is no exception.
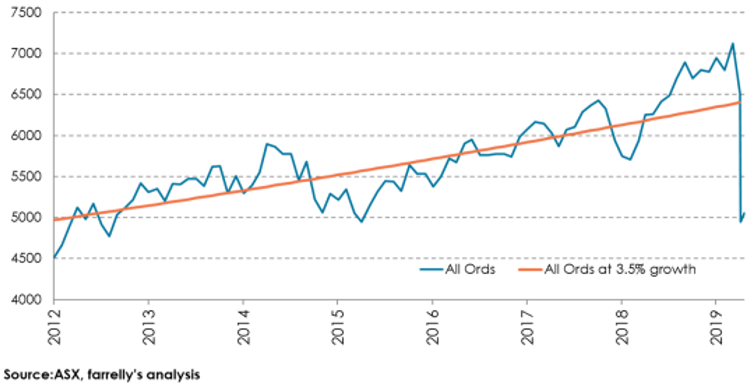
Figure 2 below shows how Australian share prices have moved since 2012 when our analysis suggested that share prices should grow at 3.5% per annum on average over the coming decade. The orange line shows what would happen if share prices travelled in a straight line – which, of course, they don’t. They over-react.
What we can see is that the share prices tend to vary around that expected long-term trajectory. When markets get overly optimistic, prices rise above the line and, when fear reigns, prices tend to be below the line. When utter panic sets in, prices can fall well below our target. Last week was an example of utter panic.
Figure 2: ASX All Ordinaries price growth vs 3.5% pa steady growth

farrelly’s expectation is that, over time, prices will work their way back towards the orange line. Of course, there are no guarantees. But, if our fundamental assumption that the Coronavirus will cause only modest long-term damage to company earnings is correct, then that is where prices will head, eventually.
The volatility will go away, but probably not any time soon
The economic impacts of the Coronavirus will be with us for at least another six, perhaps 18, months. There will be many more announcements along the way, some good news and some bad. The economic numbers are likely to be awful and will cause large falls when they emerge. However, in between times, we will get major rallies as investors reassess the value on offer. The net result is that we could see much lower prices, or we could be close to the bottom. We just don’t know.
Nonetheless, to put the recent volatility in perspective, for all the ups and downs this year, both the US and Australian markets are down 26% since the beginning of the year. These falls are nasty, but not unusual. The damage seems much greater. We believe the reason is that volatility has been so high – moves have been very large and very fast.
What we can learn from historical bear markets
farrelly’s has looked at the past half century to try to determine what makes bear markets tick. We have defined bear markets as falls of 25% or more, rather than the conventional 20% fall. This is because falls around 20% are more inconveniences than disasters. Think about 2018 – it was all forgotten by the end of 2019.
The high level conclusions of our research are:
- Bull markets do not die of old age;
- Most bear markets begin when markets are either Fully Priced or Overpriced. In fact, this is the first time in 50 years that we have had major bear markets starting when markets are rated as Cheap;
- Australia does not always follow the US;
- In the year prior to the start of a bear market, we often see a significant increase in cash rates; and,
- Bear-markets are often triggered or fuelled by a shock of some kind.
Figure 3: Bear markets (1968 to 2020)


Notes: 1. Bear-markets are falls of 25% or more; 2. Time is from trough to next peak; 3. Overpriced: negative forecast Equity Risk Premium (ERPf), Fully priced: ERPf less than 2.5%pa, Fair value: ERPf between 2.5%pa and 5%pa
Now, the question marks relate to how far this market will fall before it bottoms out. We don’t know the answer. On one hand, we know that there is a long time to go before the medical crisis is over and that this market reacts violently to bad news. On the other hand, the falls have already been quite significant and much bad news has been discounted. Only time will tell.
What we do know is that valuations are attractive. The chances of long-term investors earning returns well in excess of Term Deposits over the next five to 10 years are very, very high.


