China – time to buy?
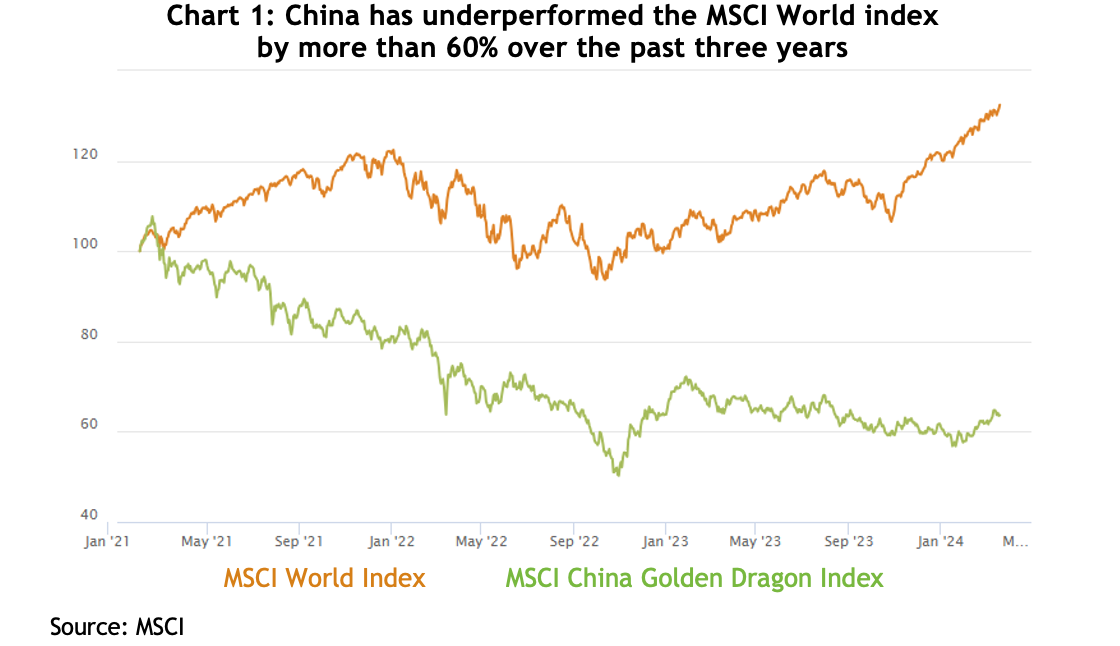
From its peak in early February 2021, China’s share market went through a grinding three-year decline of 40 per cent, while over the same period the MSCI World index was up 20 per cent. When one of the world’s largest stock markets underperforms by 60 per cent it makes sense to see if there’s a bargain to be had.
What’s happened to China?
The fabled China growth miracle hit a couple of huge speed bumps in the form of COVID and a serious shakeout in the property sector.
In the six years to the end of 2019, China’s annualised GDP growth rate declined in a very smooth, if not controlled, path from a ridiculously high 7.5 per cent to a still astonishing 5.8 per cent. Then COVID wreaked havoc. Between stringent lockdowns and the government’s refusal to make similar fiscal injections as western governments, the Chinese economy didn’t bounce out of COVID in the same way Australia and the US.
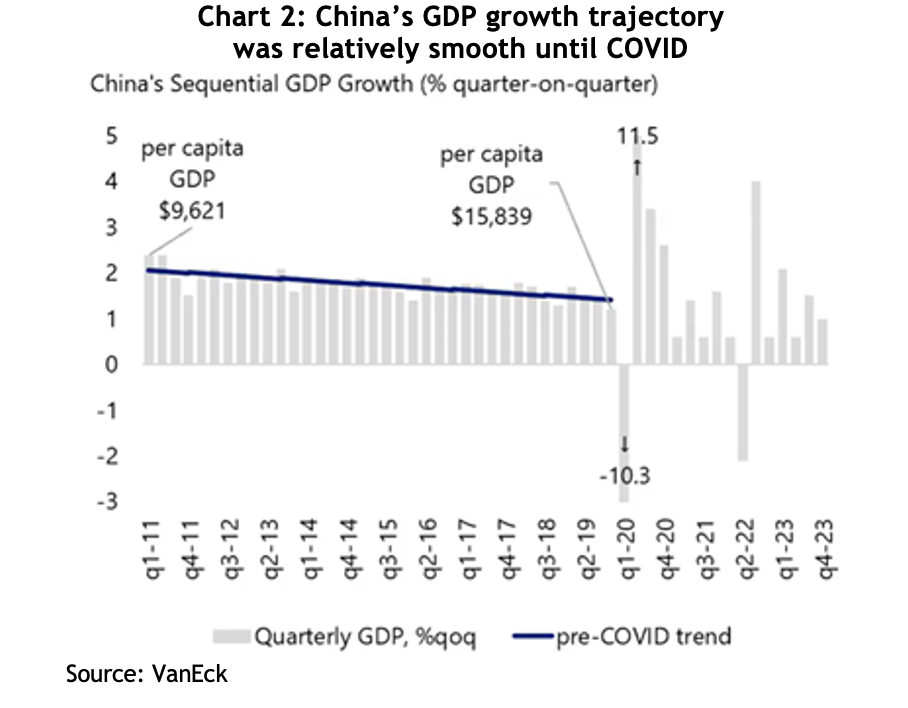
The COVID slowdown triggered an almighty reckoning in the property market, which accounted for a whopping 30 per cent of China’s GDP in 2022. The government finally tried to deflate a classic speculative property bubble, which led to two of the biggest property developers in China, Evergrande and Country Gardens, which between them had more than USD520 billion of debt, spiralling toward oblivion.
Recent data showed housing starts in China fell 30 per cent year on year and completions were down 20 per cent, while sales dropped 21 per cent and property values got crunched by 29 per cent.
While those numbers are very messy, the government was determined to avoid the banking catastrophe the US experienced in 2008. Dr Joseph Lai, of Ox Capital, reckons that although there will be significant bad debts, they appear to have already peaked and the banking system has proven to be resilient.
Positive signs?
There was general surprise when China’s 2023 GDP growth came in a bit better than expected at 5.2 per cent, and Citibank notes the February data contained some positive signals, with industrial production rising 7 per cent year on year, in stark contrast to the US where it was slightly negative over 12 months.
Investment was also “way higher than consensus”, with manufacturing investment up an impressive 9 per cent for the first two months of the year and infrastructure 6 per cent, much of it actively encouraged by Beijing as a way of reducing the economy’s dependence on property.
The government is actively promoting decarbonisation industries, with the usual head spinning results you get when China puts its mind to something. For example, electric vehicle production has risen about seven-fold from pre-COVID levels, and now China produces about one-quarter of the world’s EVs and accounts for more than half of registered EVs worldwide. Similarly, solar battery production has risen more than three-fold and it accounts for more than 80 per cent of global solar cell exports and 50 per cent of lithium batteries.
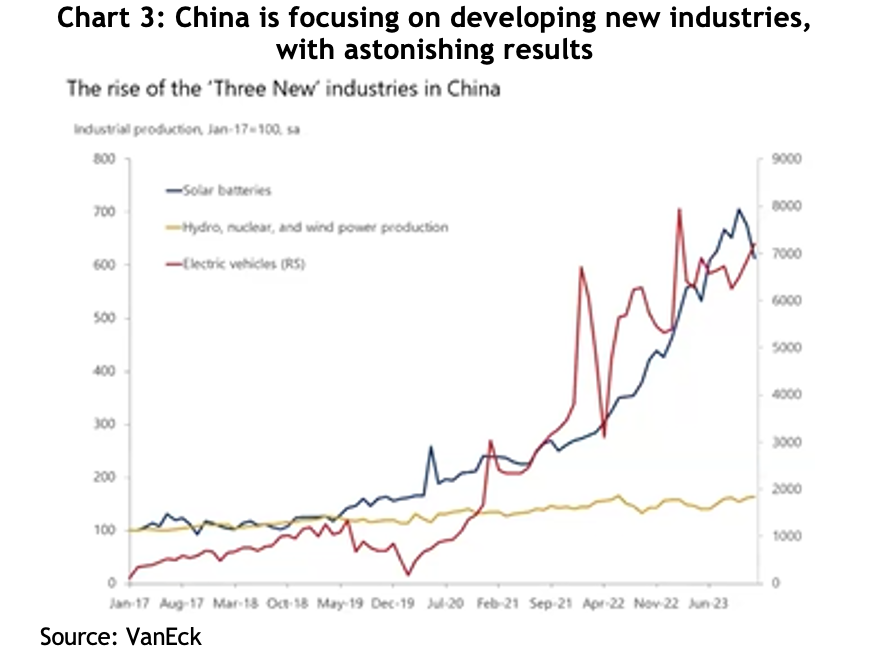
Although the critical consumer sector is still not as optimistic as it was pre-COVID, retail sales rose a healthy 5.5 per cent compared to a year ago.
The share market
If share markets directly reflected economic growth, the Chinese share market would have been the world’s biggest a long time ago. The fact is, economic growth can be generated by government spending that doesn’t necessarily benefit private companies, or come from sectors that aren’t represented in the index.
Having said that, the Chinese market does look cheap. After that 40 per cent crash and bottoming in early February, the CSI 300 bounced more than 13 per cent in seven weeks, but at a time when markets across the world are hitting new all-time highs, China is still 38 per cent away from theirs. That bounce caught the attention of a lot of technical analysts, but consensus is that it’s still early days given there have been false starts over the past couple of years.
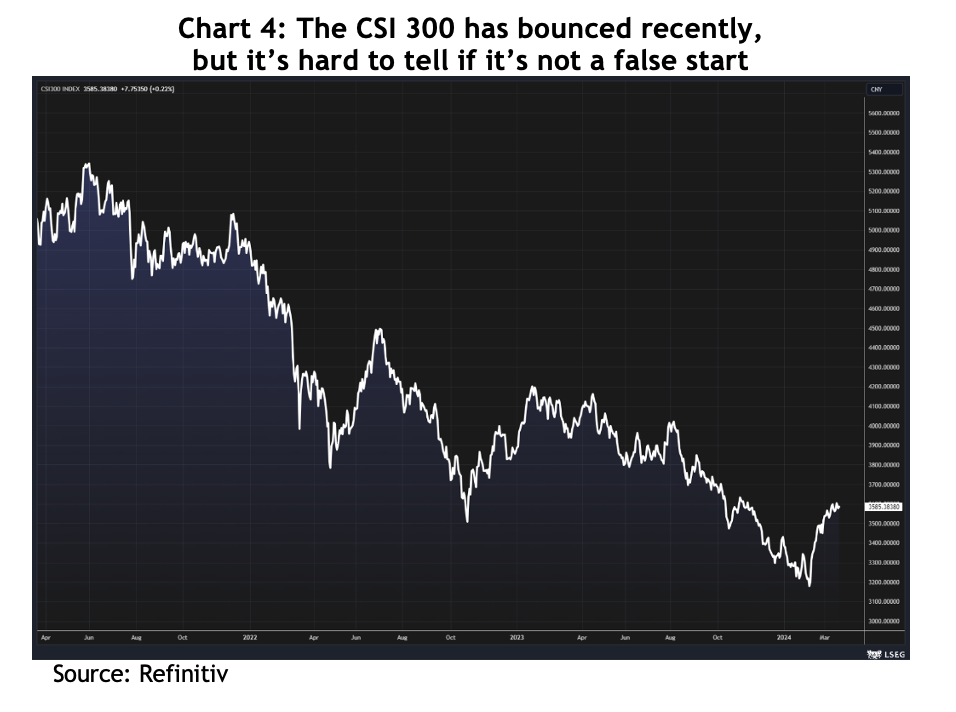
China’s price to earnings ratio for the next year snuck below 10x and is still about half the US’s and way below Australia’s 17x, while earnings growth over the next year is forecast to be about 14 per cent, compared to Australia’s very pedestrian 0-3 per cent.
All eyes will be watching for signs the Chinese government will increase its support for either the economy, or the share market, or both. There had been hopes the government would repeat the massive spending package of 2008 that helped drag the world out of the GFC, but it never came. There has been some easing of borrowing rates and ham-fisted restrictions on selling Chinese stocks by local financial institutions, but no killer package.
There is no telling if the Chinese stock market crash is over, but smart investors know that in carnage can lie opportunity. For those looking to access China, VanEck has two ETFs listed on the ASX: CETF invests in the 50 largest mainland companies, and CNEW uses an algorithm to invest in 120 quality companies across IT, healthcare, consumer staples and consumer discretionary.


