n the face of it, it makes sense: the economy looks like it could slow down a bit, which would have to affect companies, so you figure you should lighten off your share exposure and go a little more defensive. Unfortunately though, it’s not that straight forward: it turns out stock market returns over the short-term have little, if any, relationship to the most popular measures of economic activity. Even if you’re convinced the economy is going to slow down, your portfolio could still go up.
How many times have you read the headlines that the stock market seems to defy logic by going up on bad news? Trying to pin down what drives the share market in the short-term, let alone get ahead of it in anticipation of good or bad economic news, turns out to be a great way to wrong-foot yourself and potentially lose money.
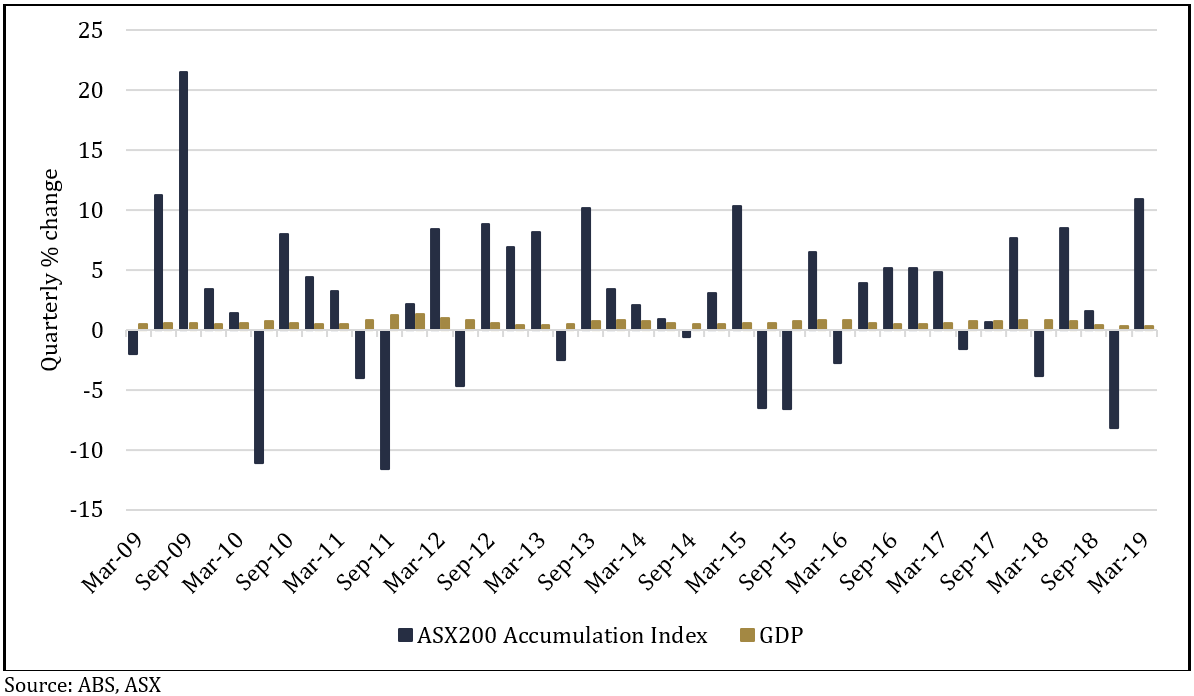
The chart below shows there’s no correlation between the quarterly changes in the ASX200 Accumulation Index (which includes dividends) and GDP figures over the last 10 years.
Chart 1: Quarterly changes in the ASX20 Accumulation Index vs GDP

There wasn’t a single quarter of negative GDP growth, but there were 13 negative quarters on the share market; the highest quarterly GDP growth figure was 1.3% and the lowest was 0.3%, whereas the highest return from the share market was 21.5% and the lowest was -11.6%. There isn’t even any discernible pattern from the direction of changes in GDP growth and the direction of the market.
There’s a bunch of reasons why the level of economic growth that’s reported might not resemble the returns seen out of the stock market. A major one is the stock market is not particularly representative of the overall economy, for example, financial companies account for 32% of the ASX200 but only 10% of GDP, and ‘materials’ (which includes mining) is 18% of the index but only 9% of GDP.
Another is that companies gear up their balance sheets with debt, meaning they can earn a higher return on their equity than they would get from just leaving it to the broader economy. For example, if a company has $100 of assets and earns $10 profit, that’s a return on equity of 10% (100/10), but if the assets are funded 50% by the company’s own equity and 50% by debt, then the $10 profit is a 20% return on equity (50/10).
That leverage finds its way down to the earnings per share a company reports, along with a host of other variables, which can the affect the biggest, and most unpredictable reason for the differences: sentiment. While the share market’s dividend yield and earnings tend to change relatively slowly over time, sentiment, which is reflected by the market’s price to earnings (or PE) ratio, can jump all over the place.
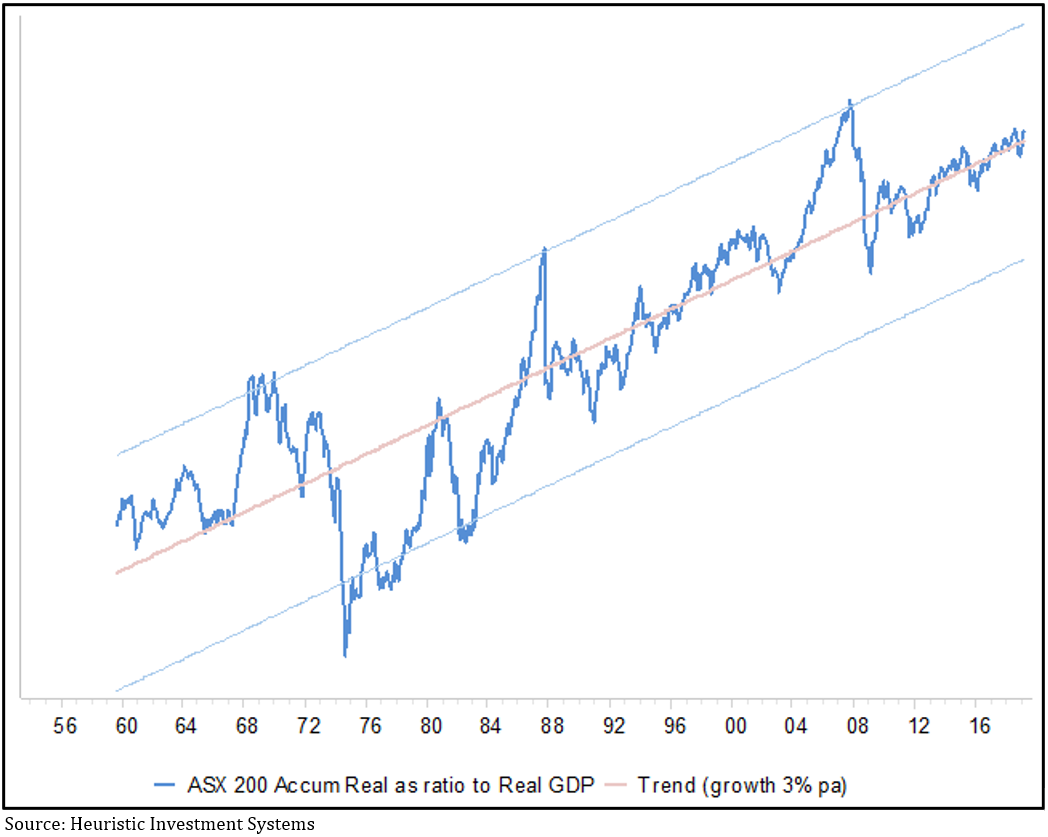
Don’t for a minute think economic growth is irrelevant for investors, in a healthy economy both trend upwards over time. However, chart 2, which shows the ratio of growth in the share market compared to GDP over the last 60 years, tells us the relationship never sits still: there are times when the share market can get way ahead of itself, only to inevitably fall back again and typically overshoot, before climbing back to the average.
Chart 2: Ratio of real growth in the ASX200 Accumulation index vs Australian GDP

There are three interesting takeaways from this chart: first, like chart 1, it confirms the relationship between GDP growth and share market returns is very jumpy, so trying to predict it will be difficult; second, the post-GFC period has been notably stable, and third, to the extent the chart can be used to indicate when share market valuations get out of whack, it doesn’t look especially expensive right now.
There are other economic data that measure things like the change in industrial production, or inventories, or trade volumes – in fact the menu is enormous. Some fund managers dedicate enormous resources to using those data to make short-term forecasts of what the market will do, with PhD’s building complicated models, but very few of them are consistently reliable. That’s because the most important part of the puzzle is the least predictable: sentiment, which is a function of a countless number of people reacting to a countless number of factors.
An added risk of paying attention to economic activity is you invariably find yourself relying on economists, who, frankly, can be pretty patchy when it comes to making good forecasts. Last year the IMF released a study covering 63 countries between 1992-2014 which found 97% of economists failed to forecast a recession less than six months before it began. In 2015, 23 of the US’s leading economists published a letter in the Wall Street Journal warning the Fed’s quantitative easing program risked ‘debasing the currency and causing inflation’, four years later, the opposite is the case. And in January of this year, not one of the 69 economists surveyed by the Wall Street Journal correctly forecast the 10-year bond yield would go below 2.5% less than six months later.
There are two key lessons for investors: stop fretting about economic growth, because while it has a clear long-term relationship to share market returns, don’t be so sure you can second-guess how the share market will react to changing economic prospects in the short-term; and be wary putting too much faith in economic forecasts, especially when they’re about the future.


