ince 1980 the average intra-year pull back in the US has been more than 14%, but over the past 12 months the biggest has been only 2.8% between the beginning of March and mid-April, and after finishing up 2.3% for October, the S&P 500 has completed 10 consecutive positive months for the first time in 90 years. Since the last ‘correction’ finished in February 2016 the most remarkable characteristic of the period since has been the almost spooky lack of volatility. But why is that? Should we be worried? And if you are, what should you do about it?
Reasons why
Given how extraordinarily low market volatility has been over this year it seems remarkable there’s no definitive reason for it. You can find theories that range from blaming newfangled options strategies capturing everything from alpha, beta, and gamma to vega, or the sheer weight of money in the system meaning there’s a permanent queue of buyers for the market, or the increase in passive investing dominating turnover in an entirely predictable way.
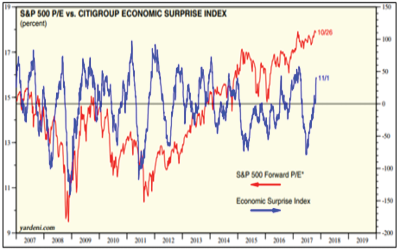
Another theory is the lack of surprises in economic data. But chart 1 shows that while economic surprises are positive now, they actually went sharply negative in the first half of the year yet market sentiment, as measured by the PE ratio for the S&P500, barely responded, despite being at a historically high level.
Chart 1: Negative economic surprises were not enough to badly dent sentiment
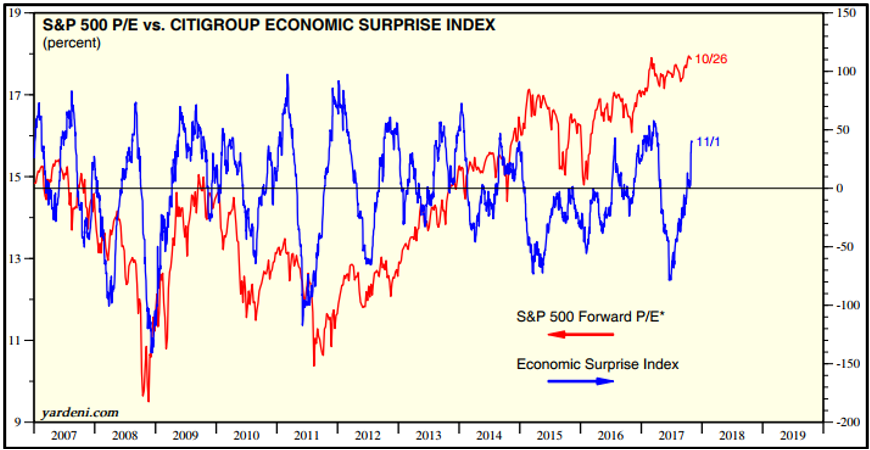
Source: Citigroup, Yardeni Research
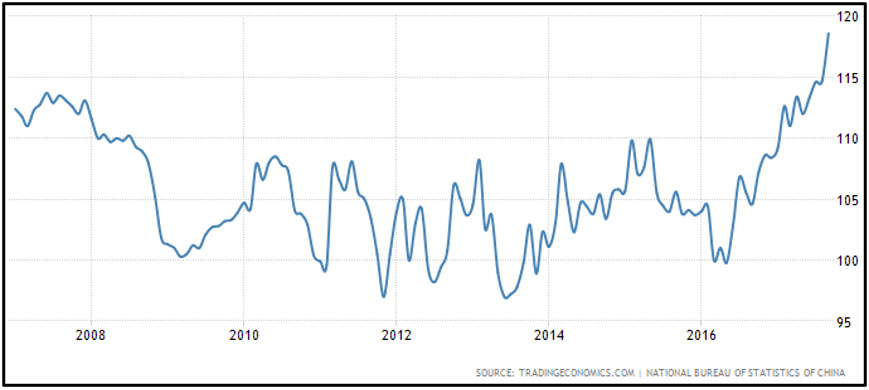
That would suggest investor resilience might be a key factor. I’ve never seen research examining if there is a link between investor resilience and consumer confidence, but given how important consumer spending is to an economy it’s conceivable there is one. If that’s the case, consumer confidence has been steadily rising across the world’s most influential economic areas to be at multi-year highs – see charts 2, 3 and 4 – which is something that doesn’t get a lot of press.….
Chart 2: US consumer confidence is at its highest since 2004
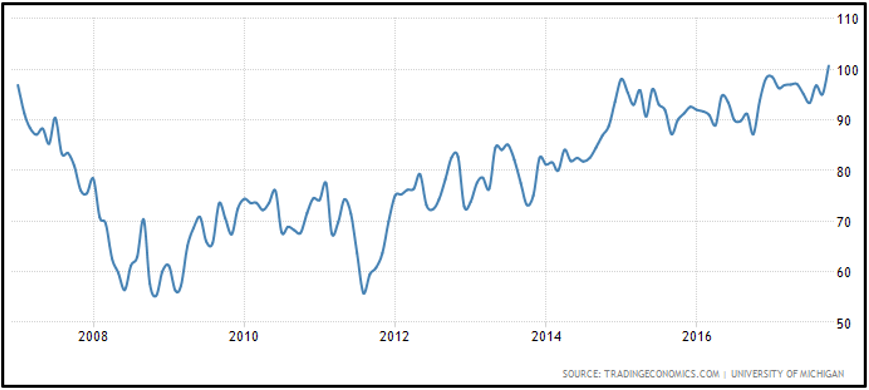
Chart 3: EU consumer confidence is at its highest since 2006
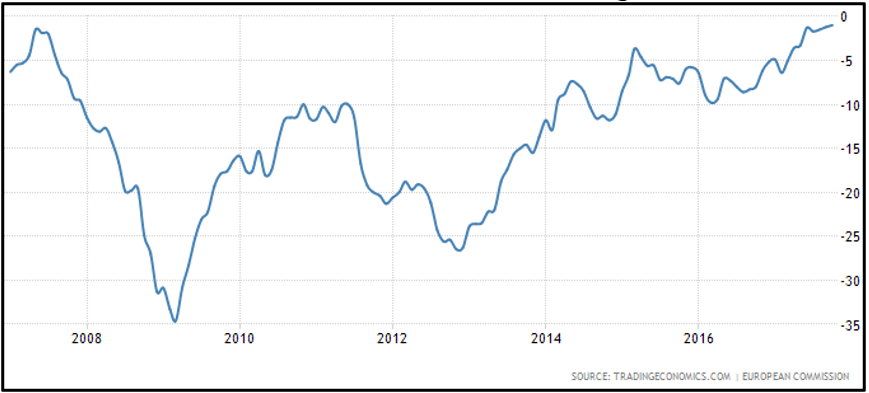
Chart 4: Chinese consumer confidence is at a 20 year high
As frustrating as it is, at the end of the day nobody really knows why volatility has been so low.
Should we be worried?
On one hand, commentators point to geopolitical risks as a destabilising threat, but over the past five years global markets have dealt with banking crises, terrorism, Chinese muscle flexing, Russian adventurism, and shock election results, why would it start worrying about North Korea now, especially if it doesn’t affect corporate earnings?
On the other hand, it’s pretty natural for investors to get worried, or at least concerned, when things are at an extreme, and there are plenty of extremes right now: record high share markets, record low interest rates, record high consumer confidence, record high debt levels, etc, etc.
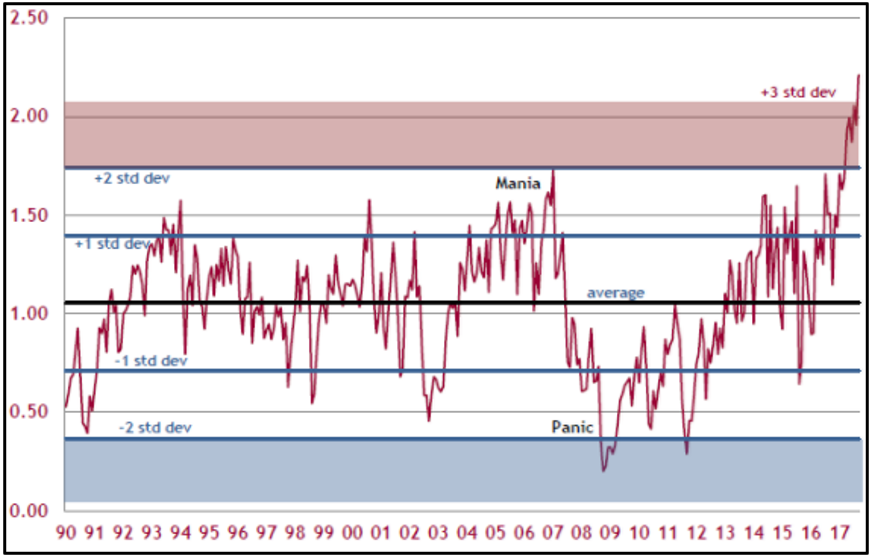
Bearish commentators are fond of pointing to the ‘complacency indicator’, which divides the market’s PE ratio by its volatility – see chart 5. Just the word ‘complacency’ is a pejorative description, implying a collective lack of awareness, and right now that indicator is more than three standard deviations above its 27 year average. For those less mathematically inclined, that means more than 99.7% of values in the chart are below its current level.
Chart 5: US equity market complacency (as measured by PE/volatility) is at multi-decade highs
Source: Hexavest, Datastream, Cuffelinks .
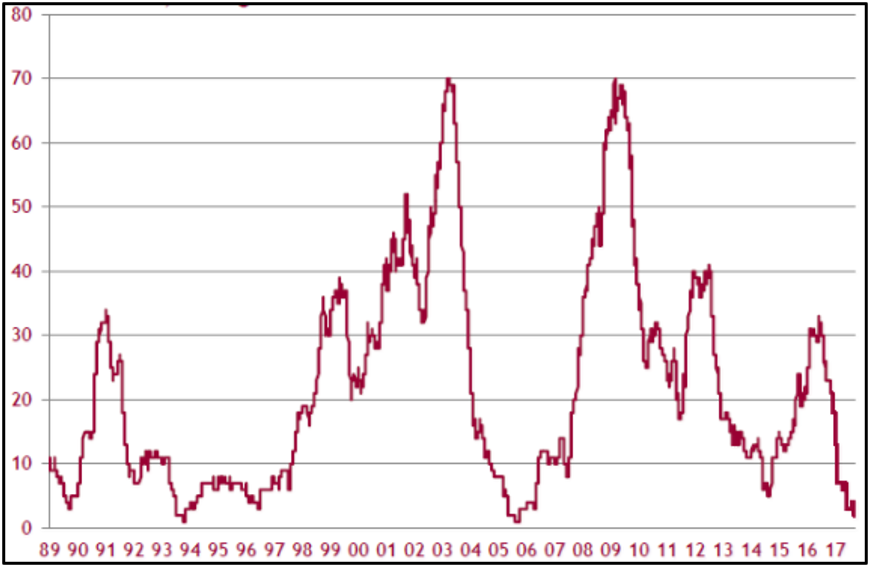
Chart 6 illustrates the extremes in another way; it shows the number of trading days over the past rolling 12 months that have experienced at least a 1% fall. Our brains are trained to spot patterns and this chart’s full of some pretty obvious ones involving both regularity and symmetry.
Chart 6: Number of trading days over the past 12 months with a 1%+ drop
Source: Hexavest, Datastream, Cuffelinks .
So if you’re worried, it’s understandable.
If you are worried, what should you do about it?
The first thing to point out is that investing and portfolio construction is not black and white: just because you’re worried about something doesn’t mean you have to be all in or all out. You know how sometimes you’ll be sitting in a taxi and ask for the heat to be turned up and the driver cranks it to maximum, when all they really needed to do was tweak it a bit. Portfolios can be like that.
Even though some market indicators are at extreme levels, nobody can tell you if or when something will happen, or how long it will last, or how bad it will be. To take your own ‘extreme’ measures might leave your portfolio underexposed to certain asset classes, and that’s more akin to speculating than investing.
The best you can do is adapt your portfolio to reflect your concerns so you can sleep easier at night. That might mean altering your growth versus defensive weightings, or considering some form of portfolio insurance, like alternative investments that act like a shock absorber for the portfolio.
Or it might just mean accepting that while volatility is really low right now it never dies, it only hibernates, and from time to time markets inevitably experience a correction. It’s part and parcel of investing.

