

Every share market correction throws up opportunities to pick up some bargains. And while those opportunities can make a significant difference to a portfolio, any investment will be tinged with trepidation that the correction isn’t yet over, and no sooner will the buy button be pressed than markets suffer another leg down.
Whilst there is absolutely nobody on the planet that can be certain, a very sound argument can be made that, on the balance of probabilities, it is likely we have seen the bottom in this current correction. That one sentence contains three caveats, which is to underline that no matter how sound the argument appears to be, it is no more than conjecture.
First, that call is much braver in relation to the US market than the Australian, which has benefited enormously from a relatively large weighting in commodity-related companies. Given the US’s influence on global financial markets, this argument focuses on the US.
JP Morgan points out the average share price decline of US stocks to the recent low on 8 March is pretty comparable to past large corrections, as long as the economy doesn’t go into recession. For instance, the average share price decline in the S&P 500 was about 22 per cent (note, that’s different to the decline in the overall index, which was just under 14 per cent), compared to the average seen in previous large selloffs of 28 per cent. For the much broader Russell 3000 the average stock fell 36 per cent this time versus previous averages of 34 per cent, and for the NASDAQ it was 48 per cent this time versus 41 per cent previously.
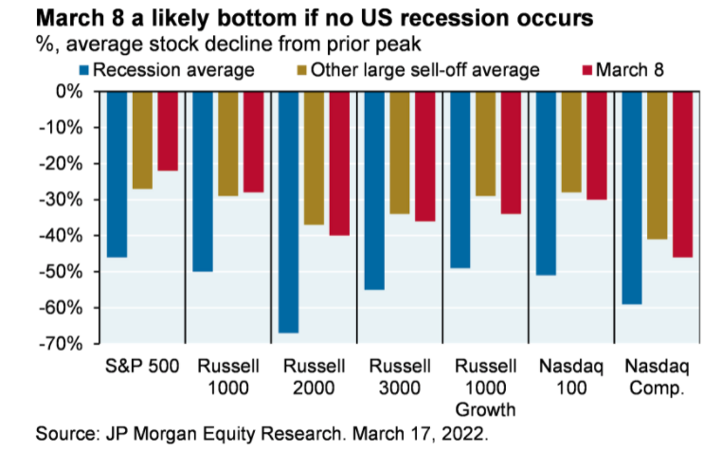
The catch is if a recession occurs, the average share price decline for the S&P 500 is 46 per cent, for the Russell 3000 it’s 55 per cent and for the NASDAQ it’s 59 per cent. So the question is whether the US likely to recess?
ClearBridge Investments publishes a Recession Risk Dashboard, comprised of 12 different variables that is updated monthly. At the end of March only one of those variables was flashing red, and one was yellow. Over the past eight recessions, the average was nine red indicators and one green.
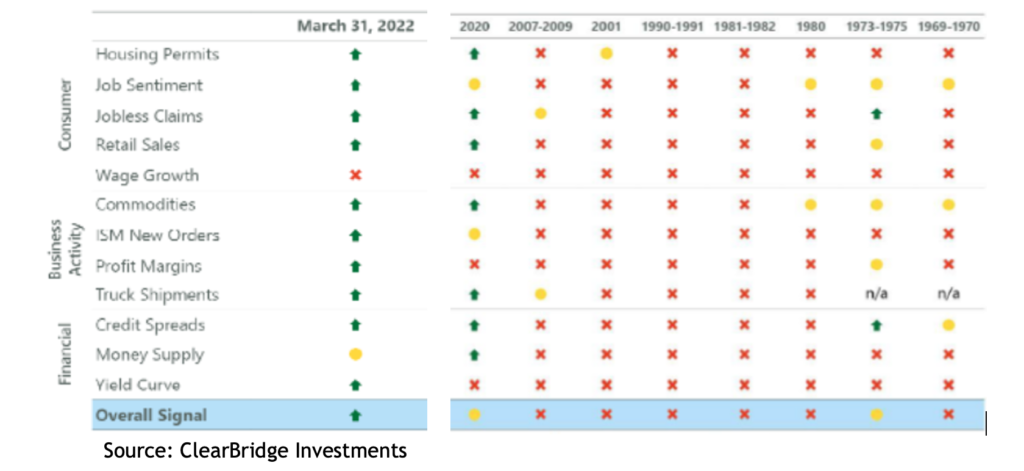
Source: ClearBridge Investments
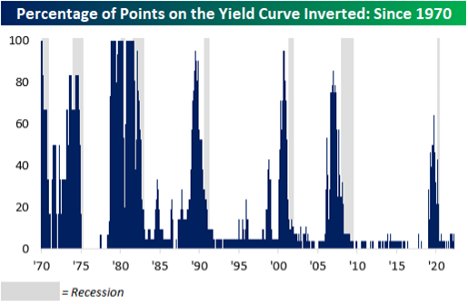
But what about the much discussed ‘inverted US yield curve’, which is where the yield on a shorter dated government bond is higher than a longer dated one, indicating the bond market expects growth to slow between those periods, and the fact every US recession for the past 50 years has been preceded by such an inversion?
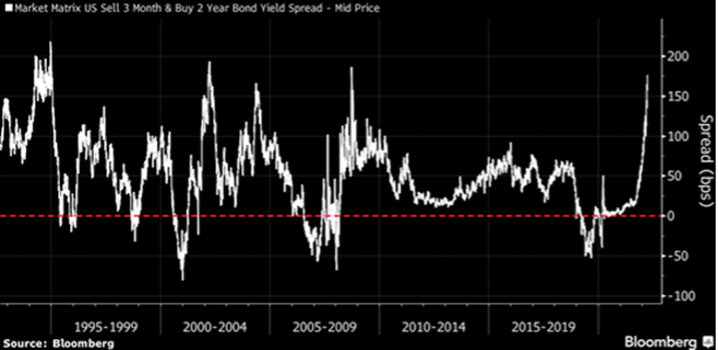
Critically, there are dozens of different US government bonds and a myriad of different yield curve relationships. The focus, and noise, has been on the 2-year/10-year bonds, where the gap was recently the lowest in 15 years. However, the most reliable recession indicator is the 3-month/10-year curve, where, at the same time, the gap was at its highest positive differential in 15 years.
Bespoke Investment Research of the US points out that, based on historical data, the 3-month/10-year yield curve implies a less than 5 percent likelihood the US will be in recession in 12 months’ time.
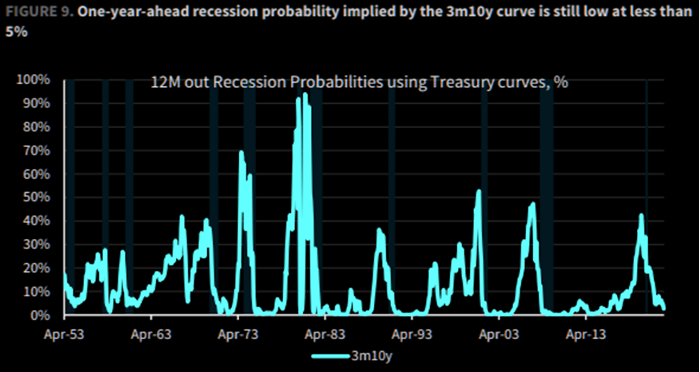
Source: Bespoke Investments
It also pointed out that currently about 5 per cent of the possible yield curves are inverted, whereas going back to the 1970s, it’s hit about 80 per cent prior to a recession. That is not to say a recession is impossible, but it seems unlikely.
Source: Bespoke Investments
In any case, for share prices to suffer the extra leg down, the economy needs to be either in, or on the cusp of, recession. Over the last five recessions (not including 2020, where the government pulled the plug on the economy) the average gap between the US yield curve first inverting and the economy recessing was 17 months, and while those recessions did coincide with significant declines in the S&P 500, the average gain between the yield curve inverting and the market starting to decline was a massive 43 per cent.
Not surprisingly, when Professors Eugene Fama and Kenneth French undertook a study of the predictive power of yield curve inversions they found there “is no evidence that inverted yield curves predict stocks will underperform Treasury bills for forecast periods of one, two, three, and five years.”
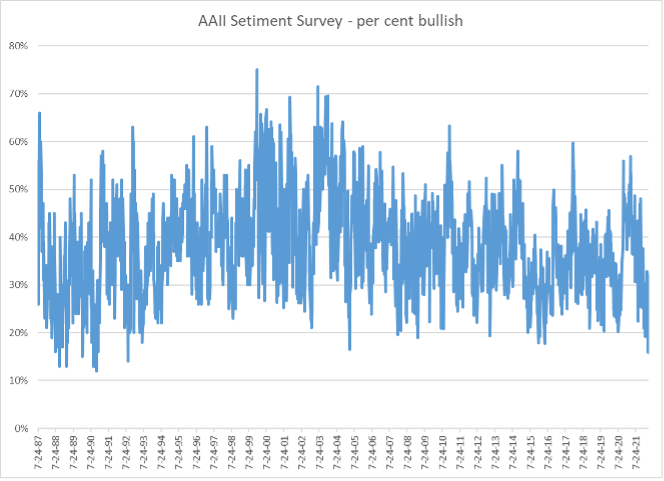
A final indicator is the AAII (American Association of Individual Investors) Sentiment Survey, which is based on a weekly poll of its more than two million members. The proportion of respondents who are bullish about the market outlook over the next six months fell to less than 16 per cent, which is one of its 10 lowest readings since inception in 1987, and the lowest level in almost 30 years.
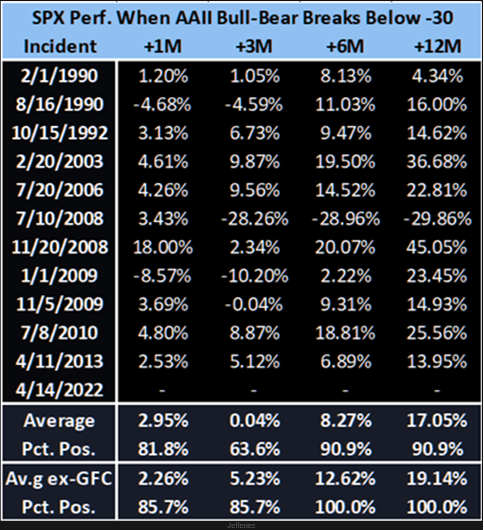
This is recognised as a strong contrarian indicator. US investment group, Jefferies, looked at the S&P 500’s performance after the ‘bull-bear spread’ (the bullish sentiment reading minus the bearish) dropped below -30 and found the average six-month return is 8.3 per cent and was positive 91 per cent of times (if you take out the GFC it was 12.6 and 100 per cent respectively).
The thing is, even if global share markets have seen the bottom for this correction, that doesn’t mean they will look the same as they did. For now at least, inflation has re-entered the investment equation and central banks are threatening multiple interest rate rises, which could see a change in the kind of companies that outperform. Smart Investors would do well to be mindful of the balance between ‘growth’ and ‘value’ stocks.
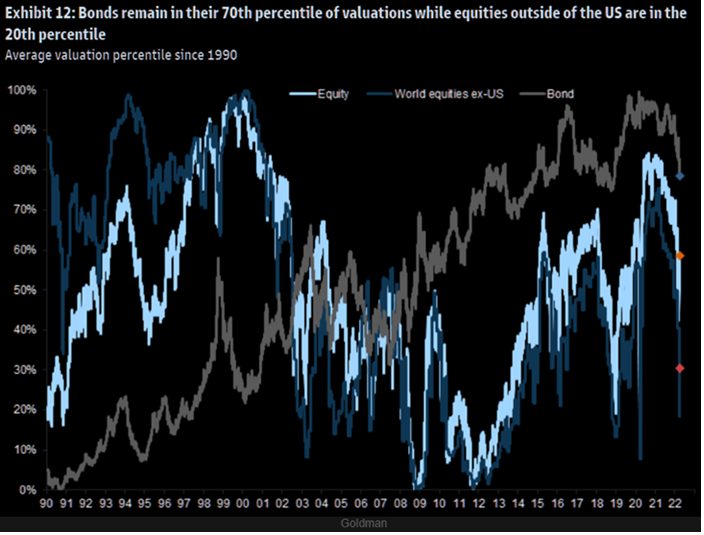
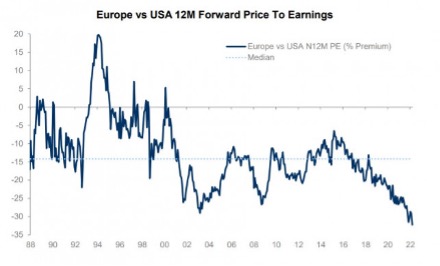
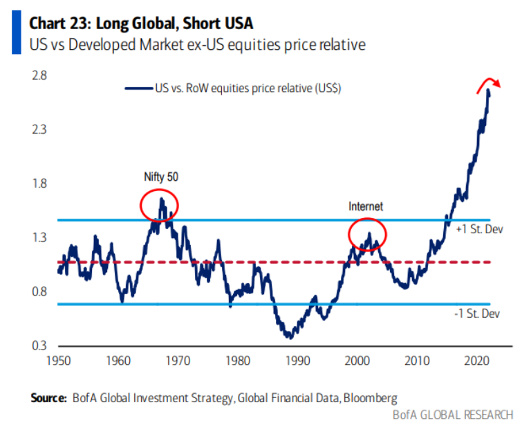
So where should you look for those bargains? Despite suffering their worst quarterly return in 40 years, bonds are still trading in the 70th centile of their historical valuations (i.e. they are expensive), whereas equity markets are around their 60th, and if you exclude the US, they’re in their 20th. So non-US equities appear to be cheap.
Indeed, if you use a very basic measure like the next 12 months’ price to earnings ratio (PE), Europe is as cheap as it’s ever been versus the US.
While technically the US still has much of the momentum, there’s an old saying in financial markets that ‘trees don’t grow to the sky’.
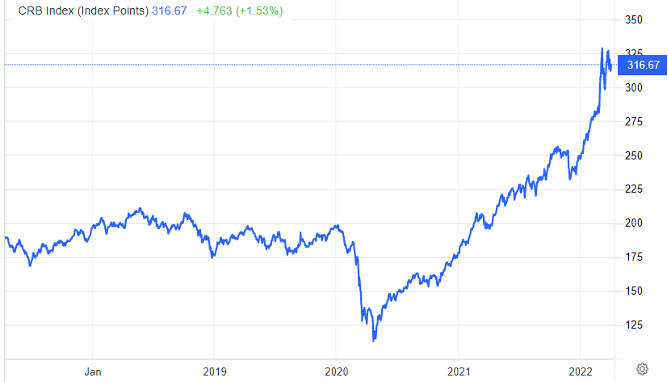
One area that is more value oriented is resources and commodities, which Australia obviously benefits from. The CRB (Commodity Research Bureau) Index, which covers a broad range of commodities, has risen 28 per cent year to date, and 62 per cent over the past 12 months.
The current correction, like all before them, is definitely throwing up some bargains. The most common risk investors face is waiting for clarity before investing. Financial markets always involve uncertainty, and by the time things are clearer, those bargains are likely to be long gone.


