The 2020 recession, why this time is different.

The 2020 recession, why this time is different.

There are number of things that make the global economic recession of 2020 different to any other we’ve seen, and while you’d never wish to go through an experience like it, there are definitely some silver linings.

The government forced the economy into recession

This was the first time in living memory that governments deliberately threw economies into recession. If you close down all but a few sectors and tell workers to stay home, obviously economic activity is going to crash.

Previous recessions have been attributable to the business cycle: typically there is a speculative build up which causes an imbalance that eventually tips over, and the worst recessions are those fueled by debt.

The standout example of this is, of course, the GFC. Building activity reached frenziewd levels in the US because buyers were able to access debt way too easily. The adjustment process was long and painful because credit, which is the lifeblood of a modern economy, all but seized up.

This time there were no baddies

When a recession is caused by excess building in some part of the economy, there is normally going to be a culprit you can point to. It might be banks, or it might be investors, but there’s a group that cops the blame and derision for crashing the economy.

That’s when the philosophy of ‘moral hazard’ argues if the culprits just get bailed out there’s no lessons learned to stop the same thing from happening again. Politicians and the media will often argue the responsible group should somehow be punished, perhaps with tighter regulations or even criminal charges.

This time (ignoring arguments about how COVID started and who or what is responsible), there is no real culprit to punish.

No holds barred support program

Because the government was responsible for switching off the economy and there was no concern about moral hazard, both they and central banks were able to throw the proverbial kitchen sink at supporting the economy.

Central bankers learned valuable lessons from the GFC that they had to make sure credit could continue to flow. The range of measures undertaken was unlike anything we’d seen before, and while things were ugly for a short time, markets were once again reminded how powerful central banks can be.

Remarkably, US financial markets have clearly recovered strongly despite the Federal Reserve barely tapping a range of the programs they announced – see chart 1 below.


Chart 1: US financial markets have recovered despite many of the Fed’s announced measures barely being utilized
Chart 1

The Bazooka

By far the most important support measures were from governments. One after another, governments wre throwing massive amounts of newly created money into their economies. Programs like JobKeeper in Australia and its equivalents overseas were critical in supporting families that otherwise would have been in dire financial circumstances.

The critical part is that it was newly created money, which governments can do directly, but central banks can’t. The central bank programs can help create new money by encouraging people to borrow (loans also create money) but that was going to be tough when the media was full of stories about the global economy crashing.

This is the opposite to what happened after the GFC, where, especially in Europe, governments preached from the gospel of austerity. Spending cutbacks sucked money out of economies and saw them slow to a grinding crawl.

Economies are on fire

Some of the data showing how sharply economies are bouncing back is remarkable. Here in Australia, we’re seeing restaurant bookings up to 50-80% compared with the same time last year, new car sales leaped 12% from last year and Commonwealth Bank credit card sales were up 11%. They are huge numbers and it’s not just because lockdown restrictions were eased.

The Australian government’s COVID support programs amounted to 13% of GDP. It’s hard to overstate how massive that is. In the wake of the GFC, the Chinese government ‘rescued’ much of the developed world by announcing a spending package equivalent to 12% GDP (clearly the absolute amounts are hugely different, it’s the proportion that’s significant). The early withdrawal of superannuation adds anotehr 2% to that. The household savings ratio hit almost 20% in the June quarter, only a fraction less than the highest it’s been in the past 60 years.

That’s an awful lot of pent-up spending power.

The silver lining

Ever since the end of the GFC, central banks have pleaded with governments to raise fiscal spending to help increase economic growth. But most governments, including Australia’s, were obsessive about balancing budgets and instead were more intent on reducing spending (the obvious exception to that was $1.2 trillion Trump tax cuts, which helps explain why the US economy was doing so much better than most others).

It’s taken the unique circumstances of the pandemic to show the power of fiscal spending to drive economic activity: low income families suddenly had enough money to go to the dentist and get the car fixed, and the money they spent doing that got spent again and again.

If governments take the lessons on board, it’s possible it could be the first step toward abandoning the flawed dictums of neoliberalism and addressing the massive wealth inequalities that lie at the heart of so many other problems we face. That would be a great silver lining.

Want to take advantage of the expected economic growth?

Call Steward Wealth today on (03) 9975 7070 to learn how.

The Post-Pandemic Boom

The Post-Pandemic Boom

    2021 is shaping up to be a year of strong economic growth, and, right now, the indicators are looking good for financial markets as well.

Australia

    • The government response to the COVID shutdowns  was swift and big. In total, the federal government is spending $272 billion, equivalent to 14% of GDP, and the states $122 billion. All that newly created money has to go nowhere.
    • Early on, households saved a lot of the extra cash. The June quarter savings rate hit 19.8%, 8x higher than the year before and only 0.5% below the 60-year peak set in 1974. The Commonwealth Bank estimates households will have about $100 billion of savings, or 5% of GDP, that has been accrued between the start of COVID and December.
Image1
      • To that you can add $34 billion of super withdrawals so far, with Treasury estimating an eventual total of $44 billion.
      • After a record plunge to 76 in April, consumer confidence has now had 11 consecutive weekly gains to 108.
      • It now appears Australians are spending those gains. Commonwealth Bank reported credit card spending jumped 11% year on year in mid-November. Restaurants in New South Wales enjoyed seated dining numbers 55% higher than a year ago, while Queensland was a whopping 79% and even shellshocked Victoria was up 54%
      • Retailers have seen record spending in the Black Friday sales, prompting Gerry Harvey to say, “This is like the greatest boom I’ve ever seen in my lifetime”.

US

      • The US fiscal package injected 13% of GDP and pushed the personal savings rate to almost double what it was at the start of the year.
      • Low interest rates have ignited the US housing market, where prices are now 10% above the pre-GFC levels. Homeowners’ equity is at a record high and the increase in the pending sales index is parabolic.
Image2
      • More than 80% of stocks in the S&P 500 are trading above their 200-day moving average, a sign of positive market breadth that has only been seen twice in the past 20 years.
      • We are seeing 52-week highs in share markets across the world, from China, to Japan, to Europe, to Australia.
      • Global equities have seen a record inflow post the COVID vaccine announcements.
Image3

While the indicators are stacking up well, there are, of course, no guarantees that markets will play ball and they sure do have a way of wrong-footing us. However, it’s noteworthy that nothing in the economy was ‘broken’ going into the pandemic downturn; there was no particular sector on the cusp of being crushed by excessive debt and while valuations were not cheap, they were certainly defensible.

Now is not the time to be sitting on lots of cash.

How has applying for a loan changed in Covid19?

How has applying for a loan changed in Covid19?

The economic impact of Covid19, and its resulting uncertainty around employment, has forced many people to reassess their current lending arrangements to ensure they are in the best position to ride out the proverbial storm.

While new housing finance has experienced a significant hit in 2020, refinancing has reached record highs increasing 25% in May. To put this in perspective, refinancing has historically made up about 26% of total lending but jumped to 43% in June. With so many choosing to refinance their loans what have lenders changed when assessing your application?

1. Certain industries and types of work are being treated with caution

Obviously Covid19 has had a disproportionate impact across certain industries with jobs in tourism, hospitality, entertainment, retail, personal transport (Ubers and taxis), personal services (beauty) and sporting professionals most affected. If you work in any of these industries, you can expect to be ask for additional information and be prepared for the lender to contact your employer to find out your true status and whether that’s likely to change any time soon.

If you are currently on JobKeeper payments or enforced annual leave, some lenders may take this into account and even use it as a reason to deny your application. Select lenders have excluded lending to these industries completely but on the flip side some are offering incentives for certain in demand industries such as healthcare.

2. Tighter assessment of income

Lenders are concerned that applicants may see a dip in their income compared to what they had earned pre-Covid-19. When verifying income, you may be asked for the very latest payslips and even evidence that these payments had been deposited to your bank account. Lenders are also especially tough on borrowers with less stable income types such as commission, contract, probation, overtime, bonus or casual income.

If you are self-employed, you may be required to produce current BAS declarations in addition to your latest tax returns to show recent revenue has not been significantly affected.

3. Change to how rental income is assessed

Prior to Covid-19 most lenders were generally happy to count around 80% of the rent you receive from an investment property towards your income. However, with COVID-19 reducing the ability of some tenants to meet their rental obligations, banks have subsequently reduced the amount of rental income they will count, in some cases down to 50%.

Further to this reduction, given the current restrictions in place, rental income generated from short-term accommodation or Airbnb are not being counted at all in certain circumstances.

4. Lower loan to valuation ratios for some borrowers.

In the past borrowers have been able to lend up to 95% of the value of their property with applications over 80% requiring the borrower to also apply for Lenders Mortgage Insurance (LMI). During Covid-19 select lenders have now restricted certain borrowers, for example the self-employed, to a maximum lend of 80% and industries that have felt the full impact of Covid-19 limited to 70% in some cases.

5. Proving your identity and signing documents have moved online

Previously your lender, or mortgage broker, was required to identify you in person by sighting your current identification documents. Most lenders have now changed their policies to allow this identification to take place electronically via platforms such as Zoom or Skype.

Likewise, prior to Covid-19, most lenders required you to physically sign and return your application and loan documents. Now almost all lenders have moved towards various electronic signing options for all documents including mortgages in New South Wales, Victoria and South Australia. Documents that still cannot be electronically signed inlcude guarantees as well as mortgage documents in other states.

6. Delayed processing times

With the influx of refinancing applications, plus increased scrutiny of each application on top of customers applying to have their repayments paused, some lenders have been overwhelmed by the additional workload and average turnaround times have significantly increased. Some lenders, particularly those with offshore processing, are taking more than 4-6 weeks, whilst others have managed to keep timeframes as low as 2-3 days.

It must be stressed that each lender has taken a slightly different approach to how they have adjusted to Covid-19 and the summaries in this article do not apply evenly. Seeking assistance from a mortgage broker has never been more valuable to help navigate the nuances of finding the best available lending solution.

Make sure you claim your working from home tax deductions

Make sure you claim your working from home tax deductions

While it’s difficult to find any real positives during COVID-19, as a result of the quarantine requirements forcing so many people to work from home the ATO has introduced a new shortcut method for calculating related tax deductions.

The method is very straightforward. All you do is calculate the total number of hours you’ve worked from home during the COVID-19 period and multiply those hours by $0.80. The final amount is your tax-deductible expense claim. If there are two people working from home, you can both claim the $0.80 per hour. Record keeping is fairly basic, all you need to do is keep a record of the hours you have worked from home.

Ian Alabakis, of Alabakis Chartered Accountants, told us the shortcut method is a special arrangement for COVID that was originally due to finish in June, but it can now be applied up until 30 September 2020.

This means, you will be able to use the shortcut method to calculate your working at home expenses for the period from:

  • 1 March 2020 to 30 June 2020 in the 2019–20 income year, and
  • 1 July 2020 to 30 September 2020 in the 2020–21 income year

Ian says the ATO may extend this period, depending on when work patterns return to normal and added that in most cases, if you are working from home as an employee, there will be no capital gains tax (CGT) implications for your home.

What you can’t claim

If you’re working from home because of the COVID-19 lockdown, you generally can’t claim:

  • Expenses such as mortgage interest, rent, insurance and rates
  • Coffee and other general household items
  • Costs related to children’s education

More details are available from the ATO.

Bubble Trouble Brewing

Bubble Trouble Brewing

This article by Jason Todd, a strategist at Macquarie Wealth, takes a measured look at whether the Australian share market is overvalued, and whether the tech sector is in a bubble.

The bulls versus the bears

When equity markets began to rise back in late March, we had no problem thinking that liquidity would do the ‘heavy lifting’ as long as COVID-19 cases were not still rising and economic expectations were not still falling. It was right to take this stance. Now the equation seems much harder to solve. COVID-19 cases are rising again but markets do not seem particularly concerned even though valuations have expanded by an extraordinary amount. There appears to be two schools of thought emerging to explain the current backdrop.

The first, suggests that markets are becoming irrational and are in the midst of a liquidity-fuelled rally that is fast taking on bubble-like characteristics. This view argues that investors are being driven by the fear of missing out (FOMO), paying an unjustified scarcity premium for earnings growth and that momentum rather than fundamentals matter. 

The alternative view is that markets are pricing in a combination of record low bond yields, an unwavering commitment by policy makers to keep economies and the financial system afloat and the willingness to pay a premium for structural growth. This is pushing valuations higher in areas where COVID-19 has accelerated change such as technology while pushing valuations lower in areas under downward pressure such as traditional retail and property.

It is hard to say which view will ultimately prevail as we think there are elements of truth to both sides. The risk-reward for certain pockets of the market are becoming hard to justify, but in general, we do not see broad signs of “bubble trouble” across equities. Traditional warnings signs such as speculation activity are not broadly evident even if tech valuations are looking troublesome.

Are equities in a bubble?

A ‘bubble’ is defined as a rapid rise in the price of an asset that is not supported by fundamentals. A typical sign of a bubble is a sharp increase in valuations to extreme levels. For the Australian market, valuations are high but outside of a reversion in the drivers supporting risk assets in general, we don’t think they have reached a self-correcting level.

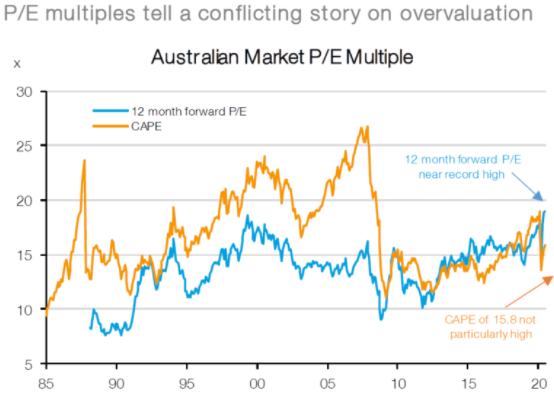
The 12-month forward P/E multiple for the Australian market has risen sharply since 23rd March and now sits at a near-record high of 19.1x. However, the P/E multiple has been boosted by the COVID-19 induced collapse in earnings which we think is not a permanent hit. In addition, the CAPE is only 15.9x. This is well below previous peaks and is below its long run average of 16.6x. So far so good…right?

Bubble Trouble Brewing image1
Source: Factset, IRESS, MWM Research, July 2020

Is there bubble trouble in pockets of the market?

We do not think Australian equity valuations are anywhere near bubble territory and nor do we think other traditional indicators of bubble-like behaviour are evident. However, we cannot say the same for Australian technology stocks which are now trading on an eye watering 60x forward earnings!

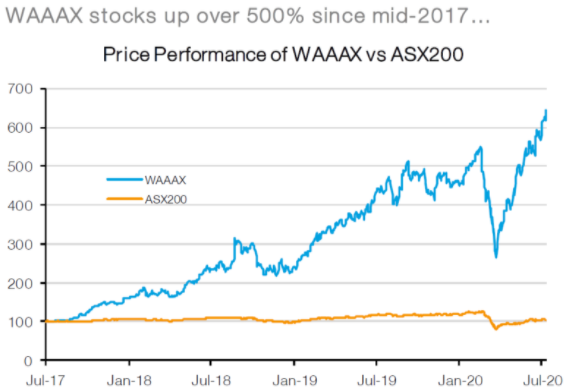
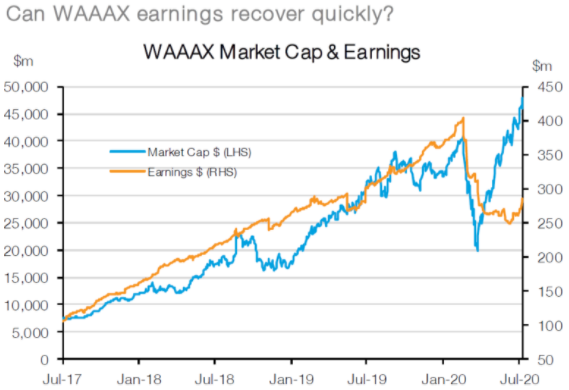
These valuation metrics look even more concerning when only the WAAAX stocks are considered (Wisetech, Afterpay, Appen, Altium and Xero). These 5 stocks have seen prices rise more than 500% over the past 3 years versus the broader ASX200 index which has barely risen above 0% over the same period. This has pushed 12-month forward P/E valuations for WAAAX to a new all-time high of 168x versus a paltry 19x for the ASX200.

Bubble Trouble Brewing image2
Source: Factset, IRESS, MWM Research, July 2020

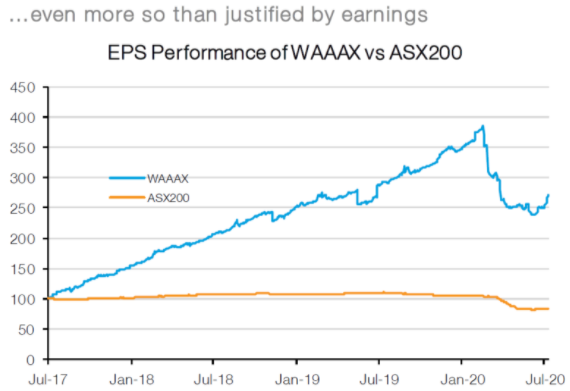
Part of the extraordinary price appreciation and valuation re-rating has been due to a much stronger and less cyclical earnings outlook, but it has also been fuelled by record low interest rates which disproportionately benefit high multiple/long earnings duration stocks. In fact, the WAAAX stocks have seen earnings grow 2.5x over the last 3 years – an impressive outcome versus the broader market which has seen earnings decline. However, this has been dwarfed by the near 6-fold increase in share prices over the same period!

Bubble Trouble Brewing image3
Source: Factset, IRESS, MWM Research, July 2020

To put this in context, the WAAAX stocks have seen earnings increase by A$181m and their market cap expand by a staggering A$41bn. Back in 2017 investors were willing to pay 71 for each $1 of earnings and now these same stocks are commanding 168 for each $1 in earnings. In other words, investors have been willing to ‘pay up’ for the superior earnings performance of WAAAX stocks but at an increasingly higher and higher rate.  

Is there a global growth stock bubble?

The re-rating of growth stocks is not unique to Australia. The WAAAX ‘bubble’ is part of a larger issue relating to the willingness of investors to bid up stocks which have a strong, structural, and/or transparent earnings growth outlook. ‘Growth’ stocks (of which WAAAX is a component) have been fiercely bid up as one of the few sources of structural earnings growth in the Australian market.

In other words, in a world where earnings growth is scarce, any earnings growth has become more valuable. This has also been seen in the recent performance of the FAANG’s (Facebook, Apple, Amazon, Netflix and Alphabet – formerly Google). This collection of stocks has also seen valuations ratios explode in recent years with momentum rising even faster in recent months because of an acceleration in their earnings outlook thanks to COVID-19. 

Bubble Trouble Brewing image4
Source: Factset, IRESS, MWM Research, July 2020

The other big factor, ultra-low interest rates, has also played a part. All other things equal, a lower discount rate would not only increase the fair value P/E multiple of the market generally but would also increase the dispersion between high and low P/E stocks. However, the current unprecedentedly high P/E dispersion exceeds the extremes seen during the Tech bubble of late 1999/early 2000, which suggests caution may be merited.

What’s the right price for “scarcity” value?

In a world where earnings growth is scare, what is the right price for the rarest of structural earnings stocks like technology, which the market is assuming can access that growth? Is it 50x future earnings, 100x future earnings, an eye watering 168x future earnings or something even higher? Only time will give us the right answer, but we think it is worthwhile trying to determine what conditions would need to prevail in order for these stocks to maintain these multiples (or the alternative – what would need to change for these stocks to suddenly lose their scarcity premium?). Gavekal’s Louis Gave believes there are 4 factors that would drive this reassessment:

  • An improvement in the macroeconomic growth outlook and higher interest rates.
  • Markets stop seeing technology companies as having scarcity value (i.e. government regulation).
  • Another scarce asset becomes popular (i.e. gold? Bitcoin?); and
  • Technology stocks disappoint.

We think equity markets are optimistically priced and waiting for economic fundamentals to catch up, but they are not at an extreme (bonds are even more expensive). Similarly, retail sentiment is bullish but not exuberant, cash levels have come off their highs, but remain exceptionally elevated and capital raisings are still being gobbled up (predominately by institutional and not retail money). On the other hand, there have been some anecdotal signs of rising market ‘madness’ in the US with investors fiercely bidding up bankrupt companies, retail account openings have exploded (in part because many have been stuck at home) and some daily price moves have been extreme.

The technology sector is another kettle of fish. In the US, valuations are high but nothing in comparison to our own WAAAX stocks. On the other hand, there are still few signs of speculative activity stretching more broadly into financial assets and the scale of global (and domestic) liquidity injections is nothing we have seen before. We are not saying that fundamentals don’t matter because in the end they always do, but it is quite possible that the combination of easy money and a slightly better cyclical outlook push multiples for both technology and the broader market even higher!

Over the coming 12 months, we think investors should maintain a pro-growth portfolio allocation (overweight equities versus bonds and cash) and be prepared to look through any near-term fluctuations or use weakness to reallocate back into the equity market. Despite near-term risks, we think the downside risks are more likely to slow the recovery rather than put the cyclical recovery at threat. This could lead to a more drawn out rebound, but if economic growth and corporate earnings continue a path back to trend, then, in combination with record low interest rates, this will be sufficient to propel markets higher. In addition, while valuations for equity markets are not overly appealing, they are even worse for the bond market with yields not far from their lower bound and as a result bonds continue to give away a substantial yield premium to equities.