Every now and again something comes along that is really significant; maybe not put a man on the moon type of stuff, but far reaching nonetheless. Our asset allocation consultant’s, farrelly’s (and yes, that’s a deliberate lower case ‘f’), latest quarterly editorial concludes global interest rates, that is central bank cash rates as well as bond rates, are going to stay really low for a really long time, like ten years plus (the article follows below).
So what? you might ask. Well, this could have a sizeable effect on projected long-term returns in two ways. First, it’s likely to mean much lower returns from secure debt. Second, it’s also likely to see the price investors are willing to pay for risky assets go up relative to un-risky assets. For shares, that means higher PE ratios over the longer term.
The Old Normal
Farrelly’s identifies a few reasons for the lower interest rate forecasts mainly based on the prospect of global growth being substantially lower because of declining demographics. That is, the prospect there will simply be fewer workers. Those numbers appear to be pretty much baked in, so there’s little likelihood of any big surprises. Add to that high government debt levels that will constrain spending and you’ve got the makings of a low growth environment.
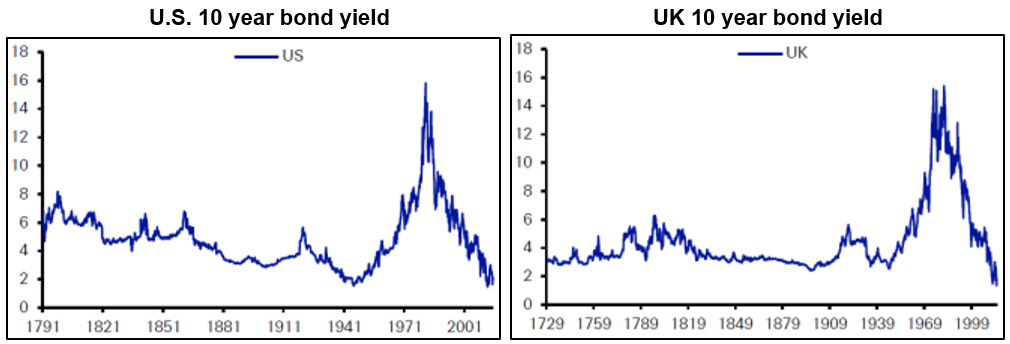
But there’s another aspect to the argument: that what we will see is simply a return to how things were before bond markets went out of whack between the 1970’s to a few years ago. Have a look at the two charts below, which show the long bond yield for the U.S. and UK over hundreds of years.

Source: Deutsche Bank, GFD, Bloomberg LLP
It’s very clear the anomalous period started with the oil-induced inflation shocks of the 1970’s, peaked with the Volcker Fed smashing cash rates to 20% to get the inflation genie back in the bottle, and through to the current deflationary phase. So any talk about ‘normalisation’ should be framed around the last 40 years being anything but normal in interest rate markets.
With yields at all-time lows it’s entirely possible bond markets have overshot the mark – that’s what markets tend to do. So the fixation by bond fund managers about when yields will rise again is not misplaced, but in a low growth environment a ‘bounce back’ could well look more like 3% rather than 5%.
What are the markets telling us?
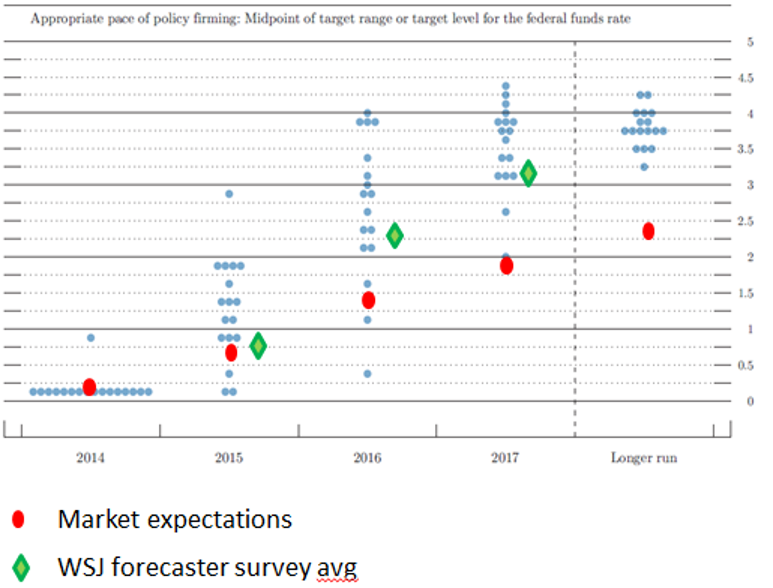
Last year the U.S. Fed started giving us an idea of where they see interest rates are heading, with each of the Fed governors placing a dot on a chart indicating where they think interest rates will be by a certain time. Not surprisingly, these so-called ‘dot points’ have become another obsession of analysts and speculators who try to interpret every Fed nuance – see below.
The Fed’s dot points, compared to economists’ forecasts and market expectations

There are a few interesting observations you can make about this chart. First, the dispersion in forecasts among the 17 Fed governors is astonishing, and a little disconcerting. These are the people who determine the price of money in the economy, a decision that has global ramifications, and yet for the current year there’s a range from 0.25% to 2.9%! Given we are believers in long-term forecasting, even if you look at the longer-run forecasts you still get a range of 3.25% to 4.25%, which is still pretty big.
Second, economist forecasts appear to be trying to pick somewhere between the weighted average of the Fed governors and the market. Very few economists like to stand out from the herd.
Third, the market’s expectations are a lot lower than the Fed’s. Certainly, the market doesn’t always get things right, but given the Fed’s growth forecasts over the past six years have always proven to be wildly optimistic, it shouldn’t be surprising the market is more cautious.
The consequences
If farrelly’s is correct in its forecast of much lower rates for a lot longer, then we’re all going to have to get used to lower investment returns in the future. Obviously things won’t go in a straight line – they never do – but over the medium to longer-term a low growth environment is likely to produce lower returns.
Much lower interest rates for much longer
By Tim Farrelly
Last quarter’s Editorial was titled “Low Interest Rates For Longer”. What a difference three months makes. Last quarter we suggested that Australian interest rates would be around 3% per annum in 5 years time and not back to 4% per annum until 2025. This quarter we have changed our mind, farrelly’s thinks long term rates will be even lower – the long-term cash forecast has been revised down to 3.2%per annum. With that change, we have increased our 2025 target PE ratios and lowered long-term forecasts for secure assets.
Why the change of heart – or, perhaps, a hardening of heart? Predominately, it has been the market; world wide the interest rates implicit in bond prices have simply collapsed. Sometimes, that is what it takes to join the dots. Sometimes the information is all there but the penny doesn’t drop until the market moves.
Secular stagnation
This is not a new idea. PIMCO has been talking about it for some time; former US Treasury secretary Larry Summers has been telling anyone who will listen; and, in these pages, we have quoted the work of Reinhart and Rogoff on many occasions. Essentially the story is that there are two major forces – demographics and government finances – which will act as major drags on economic growth in coming decades.
Long term growth in demand is essentially driven by consumers. Even business investment tends to occur in order to satisfy consumer demands. As a result, in the long term, growth in demand is tied to consumer spending and consumer spending is tied to income less saving. Consumer income is driven by the size and productivity of the workforce. So, the growth rate of consumption is determined by the growth of the number of workers plus the rate of increase of productivity.
Let’s now compare the last 50 years with the next 50 years. In Australia and the United States, we have three great forces driving the growth of the workforce; the baby boomers, women entering the workforce and major immigration programs. Productivity boomed in the wake of technology advances, high rates of investment and a much larger percentage of the population receiving higher education. Savings rates plummeted from around 10% of income to close to zero.
These tailwinds all contributed to much higher than normal GDP growth and, because these trends have taken such a long time to play out, 3% to 4% per annum GDP growth has come to be thought of as the natural rate of economic growth. However, with all of these demographic forces disappearing, a number of questions emerge. Just what is the natural rate of economic growth? Can, or indeed should, government spending take up the slack? Is lower growth bad? And critically, for us, what is the neutral rate of interest in a slower growth world?
Falling workforce growth rates
As can be seen in Figure 1, the rate of growth in the Australian working age population has fallen dramatically over the past decade and will stay low for decades to come.
Figure 1: Growth rate of the Australian working age population.

Source: ABS, farrelly’s analysis
Unsurprisingly, this is happening all around the world. Figure 2 shows the results of a study by the McKinsey Global Institute which compared past and future growth based on work force growth rates and assumed solid future productivity growth. The productivity assumption is probably an aggressive one. If these forecasts are wrong, they are probably too high.
Figure 2: GDP growth (%pa) – the past 50 years and the next 50 years

Source: McKinsey Global Institute
Even with aggressive productivity assumptions, the McKinsey study has global growth falling by 40% over the next half century. As can be seen in Figure 3, also from McKinsey, for all the enormous technological advances of the past 50 years, GDP growth in the most advanced nations has been at around 1.5% per annum. Those with the fastest productivity growth came from those who start furthest behind. There’s little joy in that for the most productive nations including Australia – despite what we read in the press.
Figure 3: Worldwide productivity growth 1964 – 2014
Source: McKinsey Global Institute. (Productivity is measured in 2012 US The second major source of slower growth will be public sector savings. Sometime in the next few decades, government debt as a percentage of GDP will be reduced. This is another reduction in the amount of capital available for consumption and therefore another drag on growth. All of which make a very good case for much lower growth in the developed world over the next three to four decades. Welcome to the new normal.
Impacts of lower economic growth on investment markets.
The first area that springs to mind is EPS growth. Oddly enough we anticipate that lower GDP growth will have very little impact on EPS growth. That is because companies will adapt to this environment and adjust their capital spending accordingly. Lower capital spending amounts to less need for share issuance and more buybacks. Earnings will grow more slowly, but earnings per share should grow much as before, and it is EPS that we care about. The really big impact on investment markets looks as if it will be via much lower real interest rates which have collapsed all around the world over the past quarter. The big question is “Just how low will rates go from here?” Is this just a temporary fall or is this where we will be for decades? Where do we get a good guide? In more recent times Japan seems to provide a possible road map. In Japan, as growth slowed, real rates went to zero. In Europe, we have the makings of a repeat. If, indeed, zero real rates will be the way of the future, we should expect to see cash rates in Australia average around 2.5% per annum in the years ahead. The market clearly thinks that low rates will be with us for a very long time, as shown in Figure 4. These are the real rates available on inflation-linked bonds(ILBs). Given that investors generally want a premium for locking in rates, we have taken a little off the ILB yields to arrive at estimates of the market’s expected real and nominal cash rates for the next decade.
Figure 4: Real rates on 10 year Inflation-linked Gov’t Bonds and estimated cash rates

Source: Barclays Capital, farrelly’s estimates.
These rates represents a dramatic change from those which we have come to think of as normal. As shown, the market rates imply average Australian cash rates of around 2.7% per annum over the next decade. Even the RBA, until a month ago at least, considered that 2.5% per annum cash rates were extremely accommodative. Perhaps that is now just going to be close to average.
Our estimate for Australian cash rates is a little higher than the market’s at 3.2% per annum – but only just. The markets estimate for New Zealand cash rates is in lines with farrelly’s.
Real cash rates over the past 100 years
All of this will require a huge change of thinking. Looking back at average real returns from cash over the past 100 years shows just how unusual the last 30 years have been. The idea of positive real interest rates, which we have grown used to since the 80s, is actually something of an outlier.
Figure 5: Cash real returns (%pa) over the past 100 years
Source: Dimson Marsh & Staunton, The Triumph of the Optimists. Note 1 : Japanese data is from 1950 -1980 to eliminate impact of the war years.
If we are going back to a world of close to zero real interest rates, then we need to make some adjustments to our forecast assumptions. Forecast returns on cash and debt need to be reduced, and our terminal valuation assumptions for PE ratios need to be lifted. This has the impact of making forecast returns on risky assets go up and forecast returns on secure assets fall. The Tipping Point Table looks very different this quarter.
Changes to the forecasts of 2025 PE ratios and A REIT yields
The forecast PE ratios have been increased. If risk free rates have fallen and the risk premium stays the same as we have previously assumed, it implies that fair value returns should fall and therefore fair value PEs should increase. The more we pay, the lower our future returns – good news in the short term, less so in the long term.
The assumed decrease in the interest rate structure is 0.75% per annum This reflects farrelly’s assumed neutral Australian Government bond yield falling from 4.25% per annum to 3.5% per annum. For Term Deposits (TDs), it means the rate at which we assume we will roll over TDs in five years’ time has fallen from 5.0% to 4.25% per annum today. (The average return on TDs over the next decade is assumed to be 4.0%p.a. made up of 3.65% for the next five years and 4.25% per annum for the second five years.)
Changing the assumption for the terminal A-REIT yield is conceptually the most straightforward of the adjustments to assumptions for risky assets. Take the old 2024 assumed terminal yield of 5.9% and take off 0.75% to arrive at a 2025 target yield of 5.1%. Easy.
To calculate similar changes with the fair value PE ratios for equities we first turn the current PE assumptions into Earnings yields by inverting them (1/PE =EY. Earnings yields are earnings divided by price whereas PEs are price divided by earnings.) We then reduce those old fair value earnings yields by 0.75%, and then turn that new EY into a PE ratio. Figure 6 below shows the changes to PEs and yields assumptions.
Figure 6: Changes to 2025 valuation assumptions

Source: farrelly’s assumptions
Welcome to the new normal!
Low GDP growth, very low real rates, higher PEs and valuation multiples – it’s a new world. A new normal. We all need to get used to it! In particular, it will require that we review spending plans. Lower rates means less money to spend.


