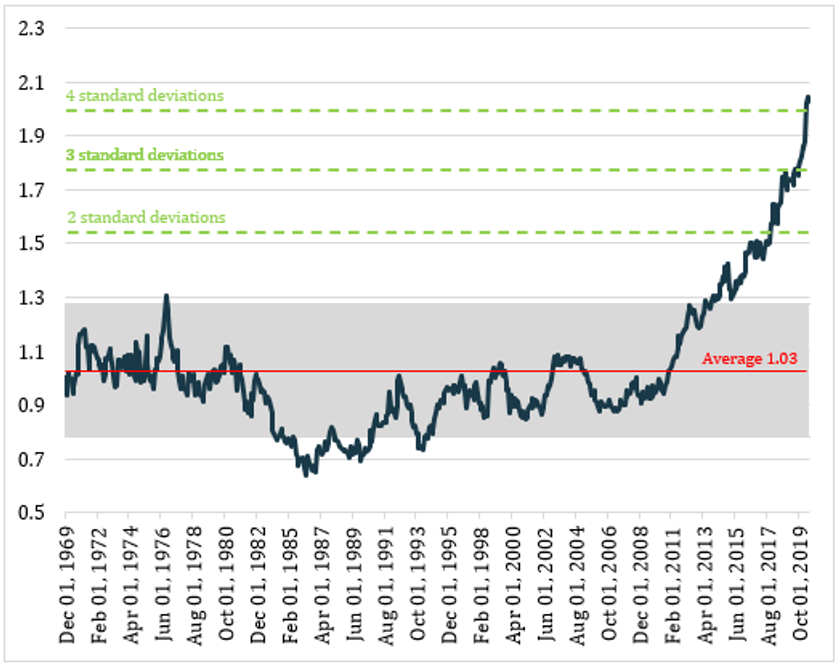
Over the past 10 years, US shares have delivered more than double the returns of European shares. That relative outperformance has become so extreme it is currently four standard deviations above the 50-year average, with 17% of the 102% outperformance coming in just the four months since the end of February.
Chart 1: The outperformance of US vs European share market returns has reached extreme levels

Why the outperformance?
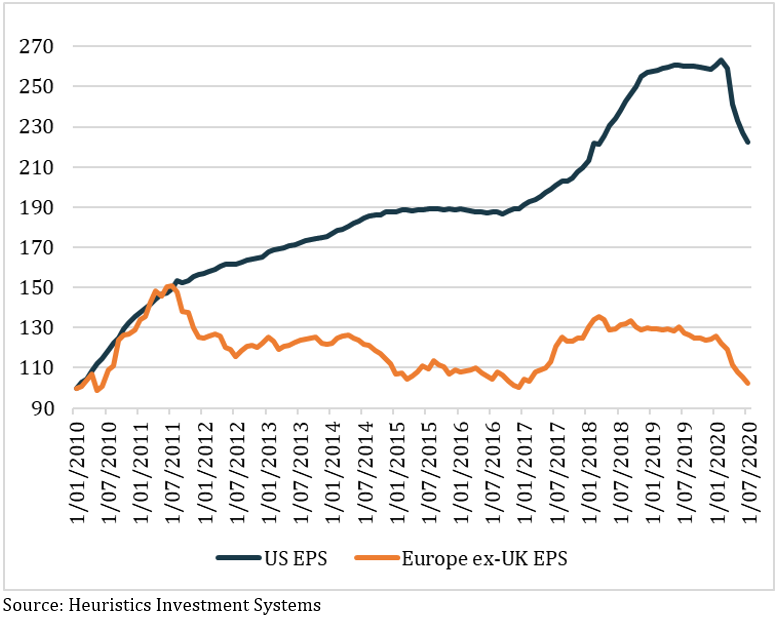
Earnings growth: over the long-term share markets are driven by earnings, so it should come as little surprise that US companies have delivered more than double the earnings growth of their European counterparts over the past 10 years.
Chart 2: US earnings growth has been more than double Europe ex-UK over the past 10 years

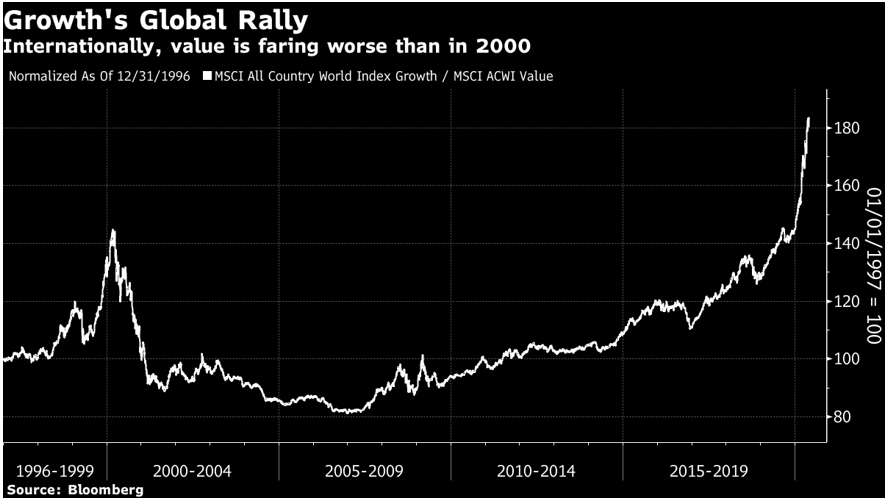
Growth stocks vs value stocks: the past 10 years has seen the greatest performance gap on record between ‘growth stocks’, which include companies with higher revenue and earnings growth forecasts, and ‘value stocks’, those companies that tend to have lower forecast growth for revenue and earnings and therefor trade on lower price to earnings (PE) ratios. This is in large part explained by record low interest rates making anything with growth look extraordinarily attractive.
Chart 3: growth stocks have outperformed value stocks by the greatest margin on record over the past 10 years

Europe’s weighting to ‘value sectors’, (in this case consumer goods, financials and industrials), is a hefty 52%. In the US, those three sectors have a total index weighting of 29%.
The tech stocks: the best performing growth sector has been technology and most of the world’s leading IT and social media companies are, of course, based out of the US. As a consequence, the S&P 500 has a 27% weighting to the IT sector, and Vanguard’s US IT ETF has returned 20.3% per annum for the past 10 years.
By contrast, not only is Europe’s weighting to IT a mere 6%, but the iShares Europe Technology ETF has returned only 12.6% per annum for the past 10 years. So Europe cops the double whammy of a smaller weighting and lower returns..
Higher GDP growth: in the wake of the GFC, European leaders became obsessed with an austerity-driven approach to re-establishing economic order and fiscal spending was constrained in an effort to reduce public debt. Meanwhile, although the US talked about fiscal restraint, there were huge spending programs soon after the GFC and then the Trump administration pushed through tax cuts on top of that.
The upshot is that over the past 10 years, at almost 5%, the US’s average budget deficit as a proportion of GDP was close to double that of Europe’s, and GDP growth has been 50% higher at 2.3% vs 1.6%. Of course, there were other factors involved, but economies face a real headwind when government spending is low and companies’ and households’ willingness to borrow isn’t high enough to offset it.
Valuations
Having risen so strongly for 10 years, the US share market is now a lot pricier than almost all other markets. The Cyclically Adjusted PE Ratio (CAPE), which aims to account for inflation and the business cycle, for the US currently sits at 30 and for Europe it’s 19.
It’s important to remember the CAPE ratio provides absolutely no help about when, or arguably even if, a market will rise or fall, it’s simply an indicator of relative value. However, Damien Hennessy of Heuristics Investment Systems says, “We’ve been advising our clients to consider a tactical overweight position in favour of European shares over US on the basis that the US’s economic tailwinds may have played out, together with the uncertainty of the approaching election.”
A catalyst
Trying to forecast what the catalyst might be to cause the US and European share markets to converge is pure guesswork, but there are a couple of clear candidates.
Last week the European Union had what has been described as a breakthrough moment when a A$1 trillion recovery package was approved. There are still some hoops to jump through before final approval, but the fact it has even been proposed is a huge step toward finally using fiscal policy to support growth rather than relying on lower and lower interest rates.
Meanwhile, in the US, the Whitehouse and Congress are still negotiating some kind of extension to the government support programs that have underpinned a bounce back in consumer spending, but which are set to expire at the end of July. Given Trump faces an election and is trailing in the polls, he will presumably stop at nothing to make sure there is an extension of some kind, but it’s already so late there will almost certainly be a gap in household payments. This is very likely to show up in consumer confidence and spending.
Finally, as Hennessy point out, in past recoveries following a bear market, value stocks have tended to outperform growth by 5-7% over a 6-12 month period.
As always, when things look this extreme, it doesn’t mean you sell all your US exposure and switch it into Europe. You could have said they were extreme two years ago and you’d have missed out. It does mean, however, you might consider reweighting to reflect that four standard deviations is an awful lot.


