0399757070
The stock market doldrums

The stock market doldrums

Ancient sailors dreaded The Doldrums, a region near the equator whose atmospheric peculiarities would rob them of wind, leaving boats becalmed while the crew watched their supplies dwindle and cabin fever took hold. It took patience and faith that conditions would eventually improve, to see them through without doing anything they’d regret.

As the ASX 200 approaches the end of August, it is not only at the same level it was in May 2021, so two years in the doldrums, it’s also at the same level as immediately prior to the COVID correction of February 2020, that’s a full three and a half years of going sideways – see chart 1.


Table showing the 2022 share market returns in local currencies


But as anyone who’s been invested over that time, and as the chart makes obvious, the Australian share market has been through some eye-popping gyrations in the meantime, enough to test the patience of plenty of investors.

It is no doubt frustrating that the ASX 200 has been trading in a 500 point, or 7 per cent, range for the better part of the last two and a half years and disheartening that the market appears to be in the grip of another correction after such a promising June and July, but a look at history gives some helpful perspective.

First, markets going sideways is not at all unusual. After the Australian All Ordinaries (the predecessor to the ASX 200) fell 25 per cent in the famous crash of October 1987, it took six and a half years to get back to a new high. Then after the horror of the GFC, the peak from late 2007 wasn’t revisited for almost 12 years. Despite those and a few other noticeable spells in the doldrums, over that 42-year period, the index has grown at a compound rate of 6.5 per cent per year, meaning investors will have (on average) doubled their money every 11 years.

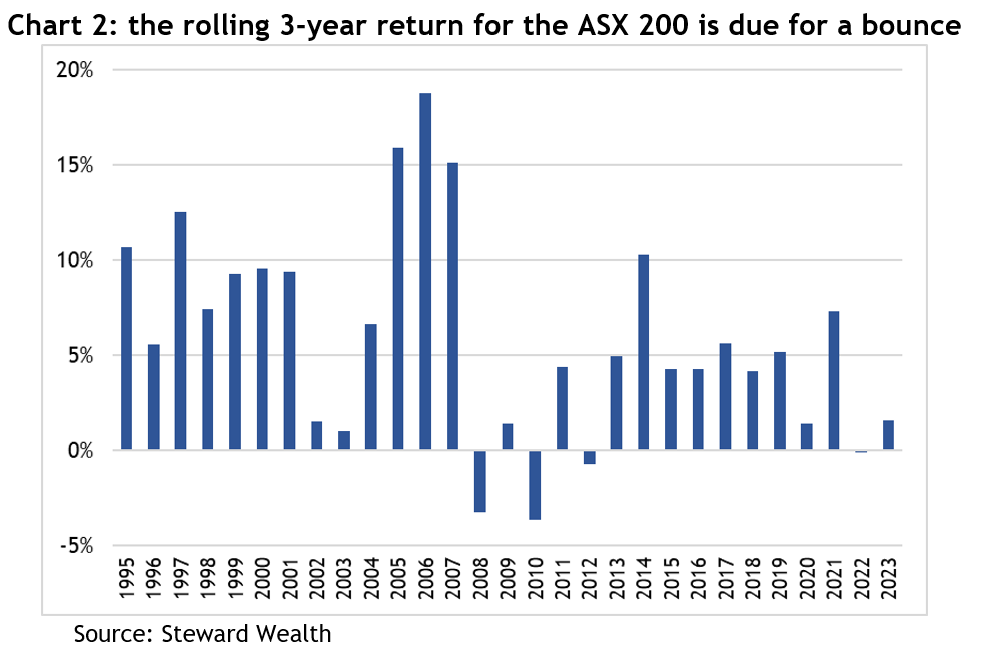
Second, if you look at the rolling three year returns over the past 30 years (so add the returns from 1993, 1994 and 1995 and divide by 3; then 1994, 1995 and 1996; and so on) the average has been a return of 5.9 per cent (which, coincidentally, is the same as the average annual return over the same period). The rolling three-year return to early August (well, not quite a full three years) has been 2.6 per cent, less than half the average, and it follows -0.1 per cent last year – see chart 2. In other words, while there are no guarantees about what will happen, history shows you can’t keep a good market down for ever.
 

Bar graph showing the main negative influence of share prices was sentiment based on source of return 2022 AUD


As for the correction markets are going through, the volatility arrived bang on its seasonal schedule. The US Volatility Index, referred to as the VIX, normally goes through a gradual decline from 19 to 17 between January to July, then rises sharply to peak at 22 by the beginning of October – see chart 3.


Line graph showing the probability of recession over the coming 12 months in the Fed's Survey of Professional Forecasters


For the ASX, August is usually the fourth lowest monthly return, and we still have September to look forward to, which is the lowest – see chart 4.

    Line graph showing the Morgan Stanley Leading Earnings Indicator against the Actual S&P 500 LTM EPS Growth Y/Y


    Also, prior to the pullback, the US market had risen 19 per cent between mid-March to the end of July, without a serious pullback. The sheer weight of accumulated trading profits together with sentiment readings hitting extreme bullishness primed the market for a breather.

    But even the pullbacks we’ve had this year have been a bit doldrumy. The biggest drawdown for the ASX 200 so far has been 8 per cent, back in March. Over the past 30 years, the average drawdown during a calendar year has been more than 12 per cent. That kind of volatility should be considered as part and parcel of investing.

    Now for the silver linings. All those return statistics so far have ignored dividends. Over the past five financial years, the capital return from the Betashares A200 ETF (the cheapest ETF of the top 200 Australian shares available on the market), averaged 3.3 per cent per year. Adding dividends took that to 7.6 per cent, and franking credits made it a respectable 8.9 per cent. Dividends matter.

    The other safeguard investors can take advantage of is portfolio diversification. Different parts of the world grow at different rates, for example, the State Street S&P 500 ETF (SPY), returned 17.8 per cent per year over the same five-year period, exactly double the ASX.

    Similarly, an allocation to fixed income such as private credit, offered attractive yields of as much as eight per cent.

    Share markets go up, down and sideways, but thankfully, over the longer-term, they invariably trend upwards. In times when markets are becalmed, smart investors should be like the ancient sailors: be patient and have faith, a tailwind will come along again.

    Where you can find higher returns with less risk

    Where you can find higher returns with less risk

    Every smart investor dreams of higher returns with less risk. While scepticism is definitely in order for most investments claiming to offer it, there is growing evidence to suggest private assets do indeed hold out that tantalizing prospect.

    First, what are “private assets”? They are any kind of asset that can bought or sold outside of a public exchange and can include everything from companies to loans, to property or even stamp collections.

    Unlisted property syndicates are a form of private market investing that have been popular among individual investors for years. But the biggest growth among institutional investors, and lately individuals as well, has been private equity, so investing in companies from startups through to well-established or even multibillion-dollar ventures, and private credit, where you invest in a loan.

    It’s easy to think public markets must be bigger than private markets, but it’s in fact the opposite, and in a big way. Worldwide, at the end of 2022, there were more than 140,000 private companies with annual revenues of more than US$100 million, compared to approximately 19,000 public companies. And globally, it’s estimated the private credit market is worth more than US$1 trillion per year.

    According to Hamilton Lane, the world’s largest private equity consultant, private equity and credit have outperformed their public market equivalents in 20 of the last 21 years, and with significantly less volatility, which is often used as a proxy measure of risk. In fact, they estimate cumulative private equity returns since 2000 were about four times higher than global shares.

    Similarly, KKR, one of the largest private equity companies in the world, reports that between 1981-2021 the Burgiss US Buyout Universe index returned 16.7 per cent per year compared to the S&P 500’s 10.0 per cent. Investing $1000 into the private equity index in 1981 would have been worth $482,000 by 2021, compared to $45,000 in US shares.

    One of the principal reasons private equity outperforms public share markets is because there are no insider trading laws in private markets. If a transaction is not open to all and sundry, then there is no requirement for everyone to have access to the same information.

    That means there are almost no obstacles to the super detailed due diligence private equity managers can undertake in analysing a potential acquisition, including access to things like board papers, financial projections or interviewing employees, the stuff a public equities fund manager would go to jail for!

    Then once a manager acquires a company, not only will they have full visibility of its financial progress, it will also typically have a board seat and discretion to hire and fire executives of its choice. That’s a level of transparency and control that public fund managers can only fantasize about.

    Private equity still has a bad reputation among some investors as predominantly an exercise in stripping assets from an acquired company, loading it with debt and then dumping it on unsuspecting investors through a share market listing. Whilst there may be a handful of private equity managers who still operate that way, these days the best managers carefully plan a multi-year strategy to transform acquired businesses.

    Critics of private assets argue the lack of volatility is because the investments are not revalued on a minute-by-minute basis like shares or bonds are. That is indeed true, but that lack of liquidity in the underlying investments is not necessarily always a bad thing. One of the main reasons share markets are volatile is because they are subject to the vagaries of human sentiment, especially fear and greed, which invariably causes markets to overreact on both the upside and the downside, reflected in gyrating price to earnings ratios.

    By contrast, typical private equity deals are run on a multi-year timeframe by cold-blooded managers who are neither driven by sentiment nor required to disclose earnings results on a regular basis. Whilst that can mean private assets don’t benefit as much from sharply higher PE ratios, nor do they suffer from sharply lower ones either.

    The main risk of investing in private assets has always been liquidity risk. Private equity funds will normally lock investors’ money up for 7-10 years, which is why they have largely been open to only institutional or ultra-high net worth investors. And they’ve loved it, with global participation in private markets estimated to have grown from US$600 million in 2000 to US$9.7 trillion in 2022.

    But over recent years, the so-called democratisation of private markets has seen novel funds that offer monthly or quarterly liquidity, making this exceptional asset class available to individual investors who are happy to take a long-term approach to investing.

    It is possible to calculate a portfolio’s liquidity requirements, to meet things like pension payments or regular expenses, and keep sufficient public market investments to cover them, then invest the balance in a diversified mix of private market assets. 


    Interested in how private assets could work in your portfolio?

    Complete the following to receive our ebook on private assets.

    10 + 3 =

    A bear market opportunity

    A bear market opportunity

    Winston Churchill’s admonition to never waste a good crisis is something all smart investors should keep in mind as financial markets wrestle with the potential for a recovery from the current bear market.

    One opportunity not to waste is revisiting your weighting to Australian shares in an investment portfolio.

    There is a well-recognised home country bias among investors all over the world, meaning most investors tend to be heavily overweight their own backyard, which is easy to understand given increased familiarity and ease of access.

    For Australian investors two other factors have been important contributors to what Vanguard has previously estimated as an average of 73% allocation to domestic equities: the franking system which boosts dividend returns, and Australia’s economic record of avoiding recession for almost 30 years contributing to a perception of safety.

    However, while franking credits are a terrific booster to returns, a better approach is to look at total returns from a portfolio, because it’s possible capital growth alone can far exceed the added return from dividends, especially in recovering markets.

    And economic growth does not necessarily reflect in the share market, because its composition is very different to the broader economy, for example, the top 10 companies on the ASX 200 account for almost half the index, meaning it’s a heavily concentrated sample.

    Harry Markowitz, one of the godfathers of modern portfolio theory, is famous for saying that diversification is the only free lunch in investing. Australia represents less than 3 per cent of global share market capitalisation, compared to the US being well over half and Europe around 20 per cent. This is where the opportunity lies.

    Over the course of the current bear market, the drawdowns experienced by different countries have varied considerably. At the end of October, the ASX 200 was down 10 per cent from its highs, but the S&P 500 was off 20 per cent, the NASDAQ by 31 per cent, Europe 17 percent and the emerging markets 32 per cent.

    There are many reasons behind that variability, but a big part of it is because this correction has especially impacted shares that were trading on higher PE ratios, which were often the more growth-oriented companies such as tech. Australia, and Europe for that matter, have a higher weighting to lower PE companies such as banks and resources.

    This provides investors with the chance to take advantage of markets being on sale and rebalance portfolios to improve diversification by broadening what drives returns in the portfolio. For instance, at the company specific level, by the end of October there were household names that have no comparison in Australia that had been slashed from their recent highs: Nike was down by 48 per cent, Microsoft 33 per cent, Amazon 45 per cent, Disney 54 per cent, FedEx 49 per cent, Mercedes-Benz 32 per cent, Adidas 68 percent and Samsung 28 per cent.

    It is entirely possible this correction is not over, and those names will get even cheaper, but trying to pick the bottom of a cycle is notoriously difficult, if not impossible. But there is no need to rebalance all in one hit, it can be done over time, in stages.

    Likewise, at this point, it’s impossible to know which markets will perform best over the coming 10 years, but by spreading your bets you give yourself a better chance of avoiding the worst performing. For context, according to Vanguard, between 2010 and 2020, the Australian market returned 7.2 per cent per year, compared to the US market’s 15.9 per cent. Franking won’t double your returns.

    If you would like to discuss your investment options, please get in touch.