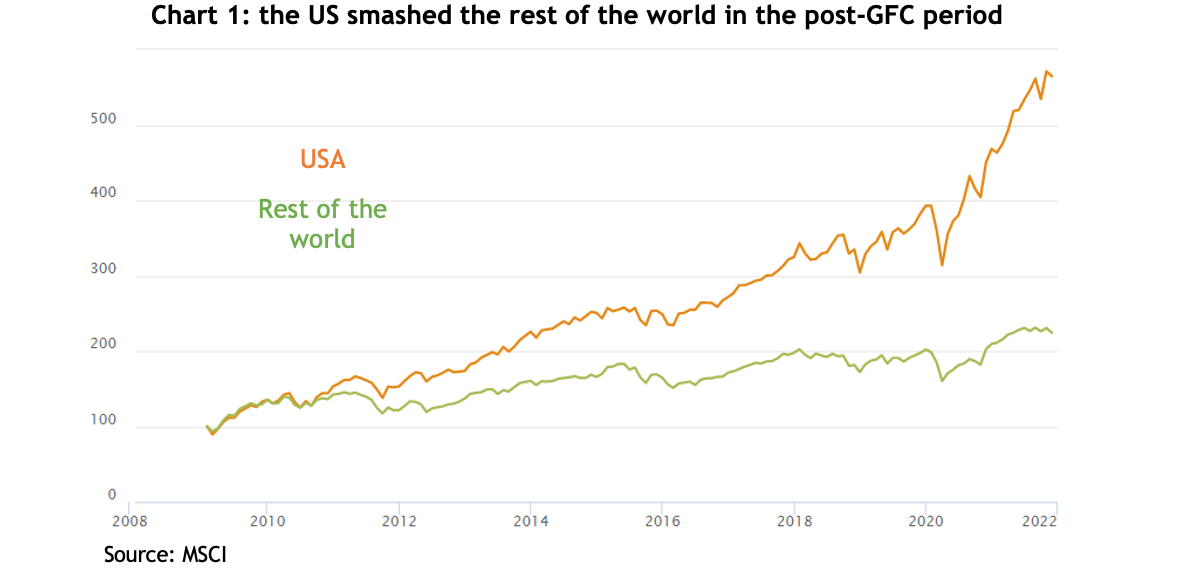
Between the end of the GFC in early 2009 to the end of the 2021 share market melt up, US shares returned an astonishing 486 per cent, a compounded annual return of 14.5 per cent. It was enough to make other share markets look positively pedestrian: Europe was up 228 per cent, the emerging markets 251 per cent, Japan 266 per cent and the laggard was Australia, at 198 per cent.
If you didn’t have some exposure to US shares you missed out on one of the greatest bull market runs in history. And much of that stellar performance was due to the tech sector: over the same period the Russell 1000 Technology Index rose by a whopping 1477 per cent.
Regime change
Having gone through the pain of a bear market, it’s tempting to presume the markets and sectors that did best in the last rally will lead the way again, but in fact, often that is not the case.
Instead, the end of a bull market often sees a regime change and when that happens the former market leaders can underperform for years. For example, Japan has never regained its 1990 high, the NASDAQ took 14 years to recover its dotcom boom levels and some finance stocks that were in the S&P 500 top 10 in 2007 have yet to recover as well.
In other words, when a market or sector booms, the bust on the other side can take years to play out, especially when the leading sector ends a bull market on high valuations.
Are US shares expensive?
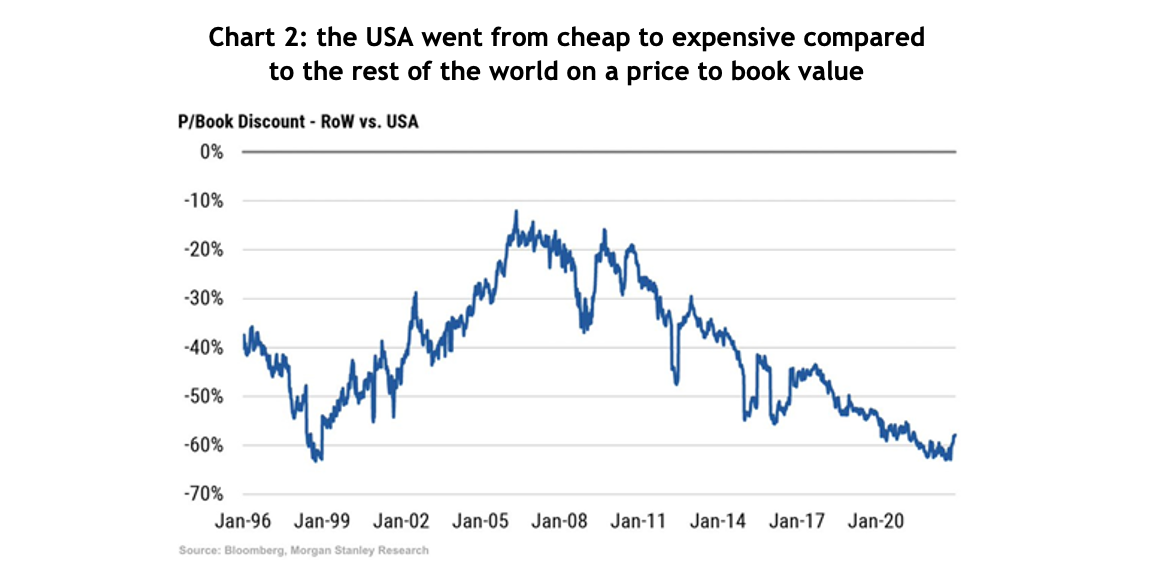
In short, compared to other markets, yes, and on various measures. The ‘CAPE’ ratio (Cyclically Adjusted Price to Earnings ratio) measures the last 10 years’ inflation adjusted earnings, and while it’s a terrible indicator for timing markets, it’s a good indicator of long-term valuations. At 28, the US is not only miles above its long-term median of 16 but is more expensive than any other market: with Europe on 16, Australia 17 and China 8.
Similarly, Morgan Stanley calculated that on a price to book value measure, at the end of 2022 the rest of the world was trading at a 60% discount to the US, the lowest in almost 25 years.
And JP Morgan estimates that at the same time, the US was trading on a price to earnings ratio of 16.7 times, bang in line with its 20-year average, compared to Australia on 14.2, Japan on 12.2 and Europe on a bargain basement 11.7.
A potential change in the top sector
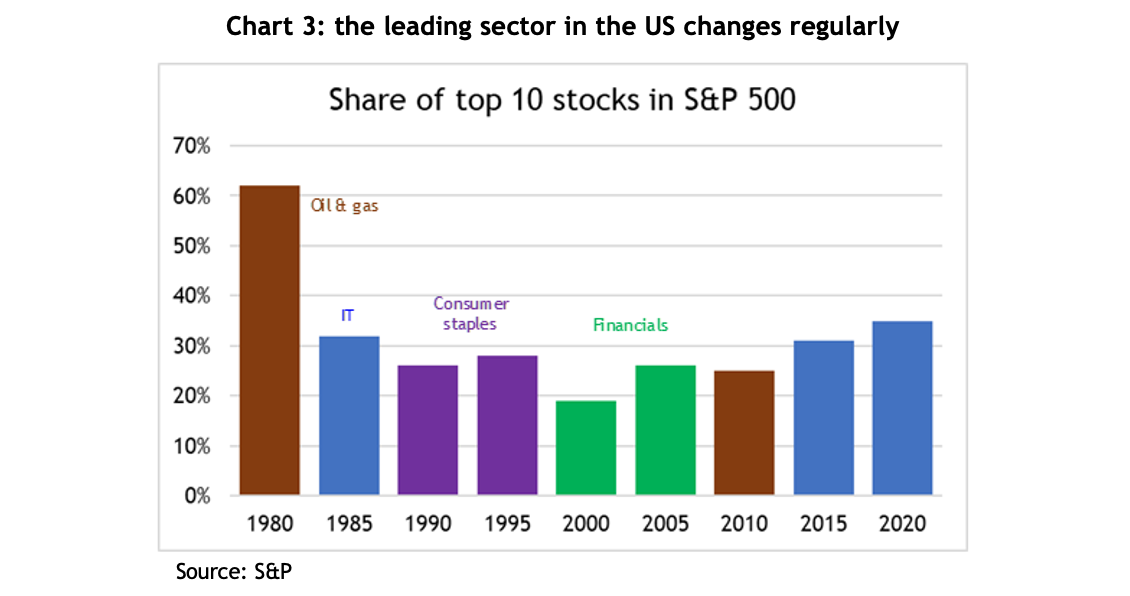
When the US market undergoes a regime change, it is not unusual for the leading sector in the index to change as well. In the 1990s consumer staples became the largest sector, then it was financials, and in the post-GFC period the tech sector became the dominant engine of growth.
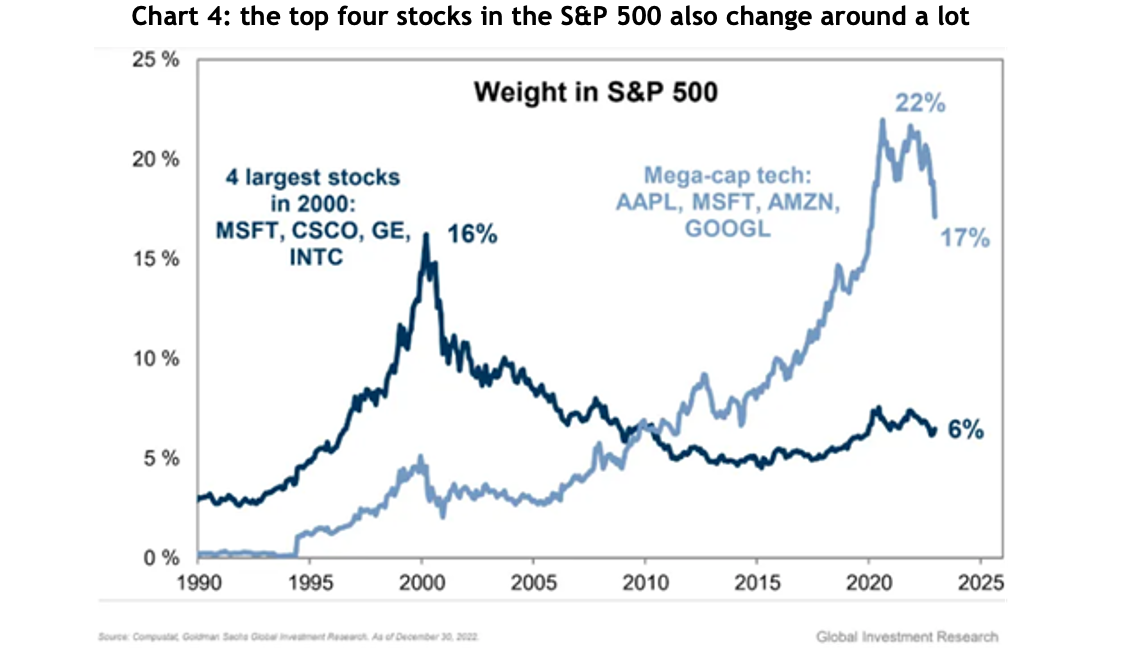
Likewise, the top companies change around as well, sometimes dramatically. In 2000 the four largest stocks in the S&P 500 were Microsoft, Intel, Cisco Systems and General Electric, boasting a combined weighting of 16 per cent of the total index. By the end of 2022, the same four had a combined weighting of 6 per cent, with Microsoft accounting for 5 of that.
At the height of the market in 2021, the top four companies accounted for 22 per cent of the S&P 500’s total market capitalisation. That has already dropped to 17 per cent, and if history’s any guide, it could have a lot further to fall.
Letting go can be hard
Financial markets are far more dynamic than many investors’ mindsets. Humans are usually reluctant to let go of a paradigm, presuming that what worked best in the last investment cycle will win out again.
That partly explains why the best performing stocks in the Russell 2000 index over January were unprofitable tech stocks, and those which had fallen the most: the presumption being that if the market’s rallying, just buy what’s been hit the hardest.
A regime shift doesn’t happen quickly, and it doesn’t mean you should sell all your US and tech holdings immediately. A smart investor understands these things are not binary, but more a question of relativities. Changing by increments can produce a better result.

