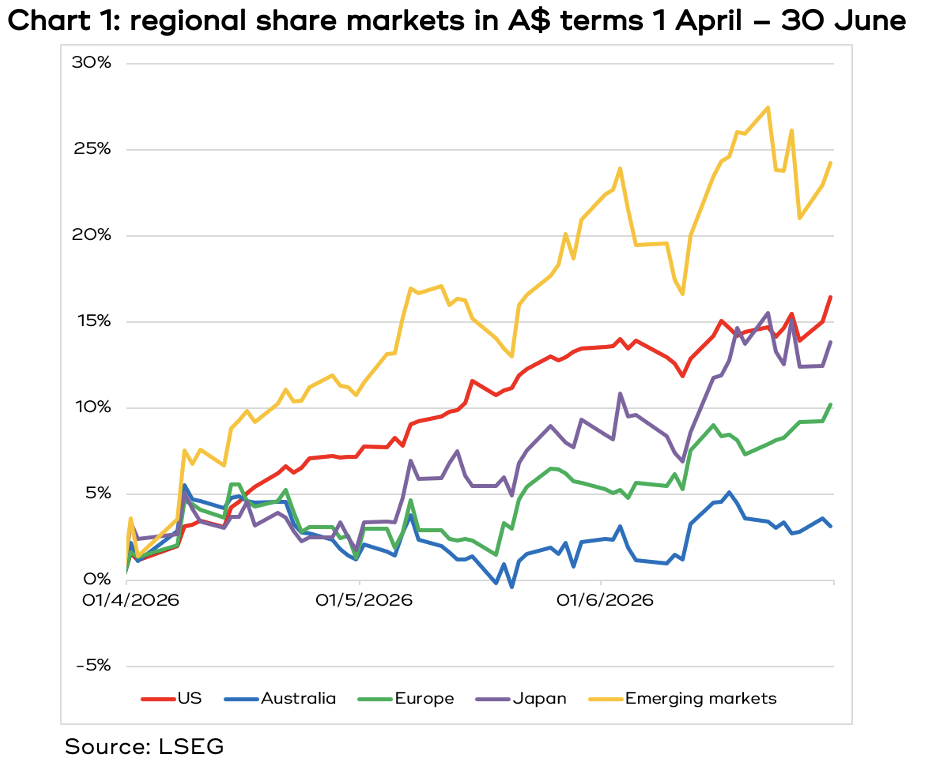
The global bull market carried on in the June quarter as the global tsunami of AI capex rolled on, and despite the grim prognostications that the closure of the Strait of Hormuz would wreak economic havoc.
Diversification paid off in FY2026
Once again, global share market returns over the financial year to the end of June were spread across a wide range, with the emerging markets continuing the Cinderella like resurgence they started last year, rising almost 44%, but Australia trailing well behind the pack with a return of 8.5% – see chart 2.
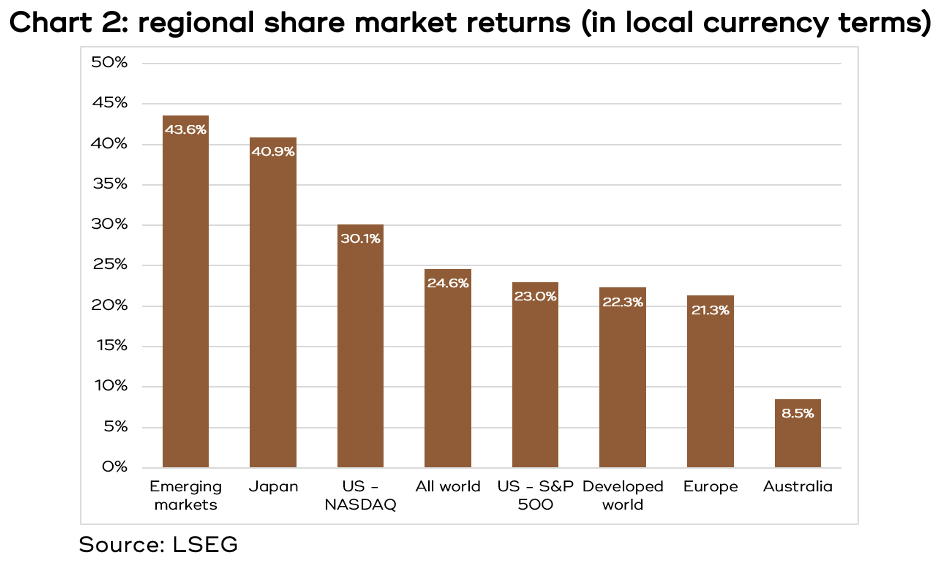
It was yet another salutary reminder of the benefits of a diversified portfolio and the inherent risks the Australian market faces if some of the biggest companies fail to perform (looking at you CSL).
Currency impact
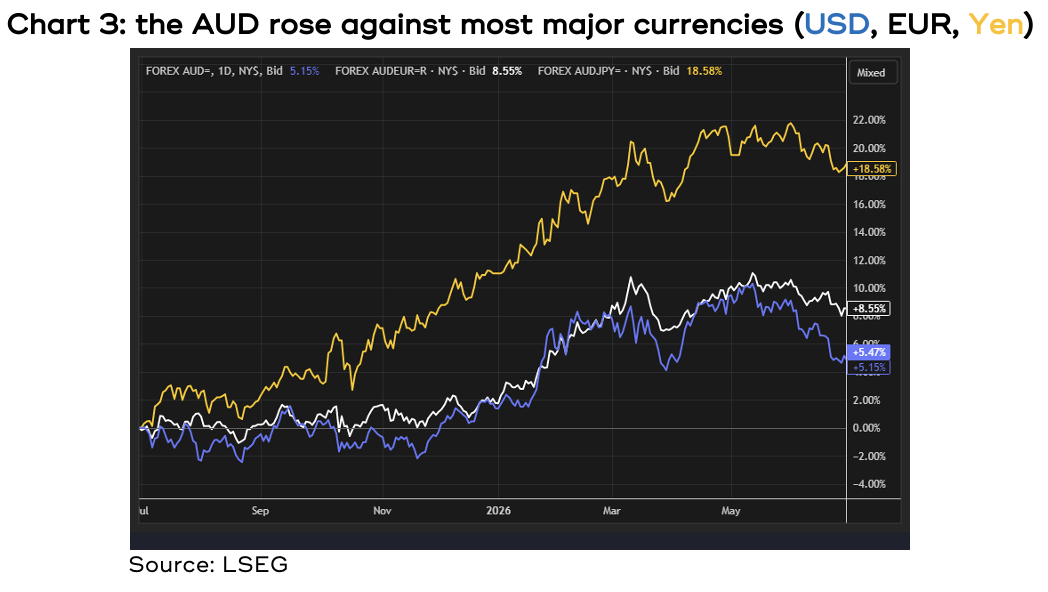
The AUD rose against most overseas currencies during F2026, partly because the Reserve Bank was one of the few central banks actively raising interest rates – see chart 3.
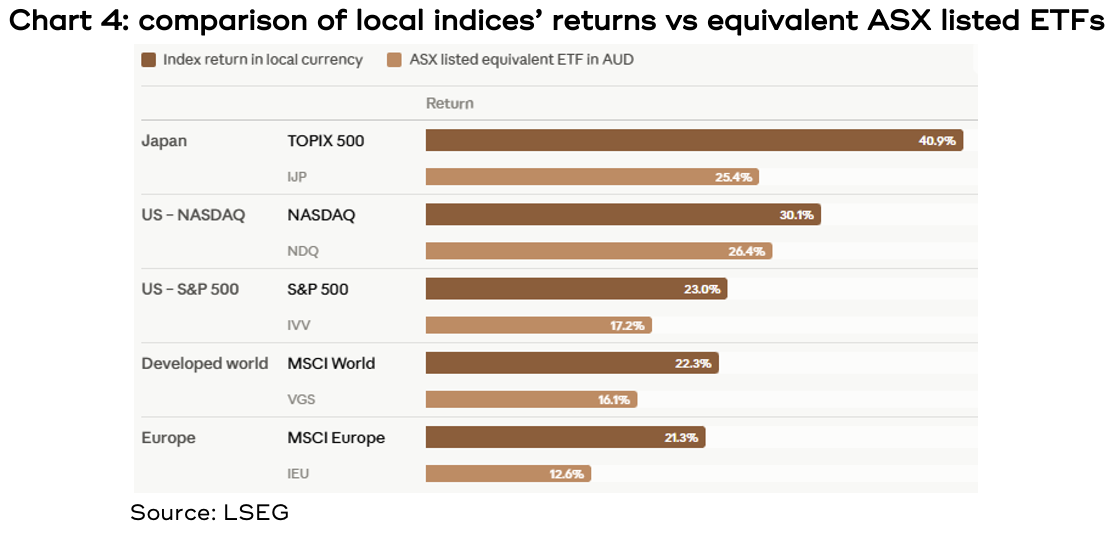
The rising currency has the effect of lowering returns for investors in AUD (a USD buys fewer AUD). Chart 4 lists the returns in local currency of the US, Japanese, European and global markets (which are priced in USD), and compares the returns of their equivalent ASX listed ETFs.
It’s all about AI
We’ve talked before about the monumental sums of money being spent on AI capex by the so-called “hyperscalers”. Those companies, like Google, Microsoft, Amazon, OpenAI and Anthropic, earned that name because they are locked in an arms race trying to establish supremacy in the AI market, which involves each of them trying to increase the computer grunt they own and control as fast as possible. It’s estimated there will be about US$750 billion spent in the US alone in 2026, and chart 5 shows the amount being spent on information processing equipment is approaching about 5% of total US GDP, already significantly more than the peak seen in the dotcom era.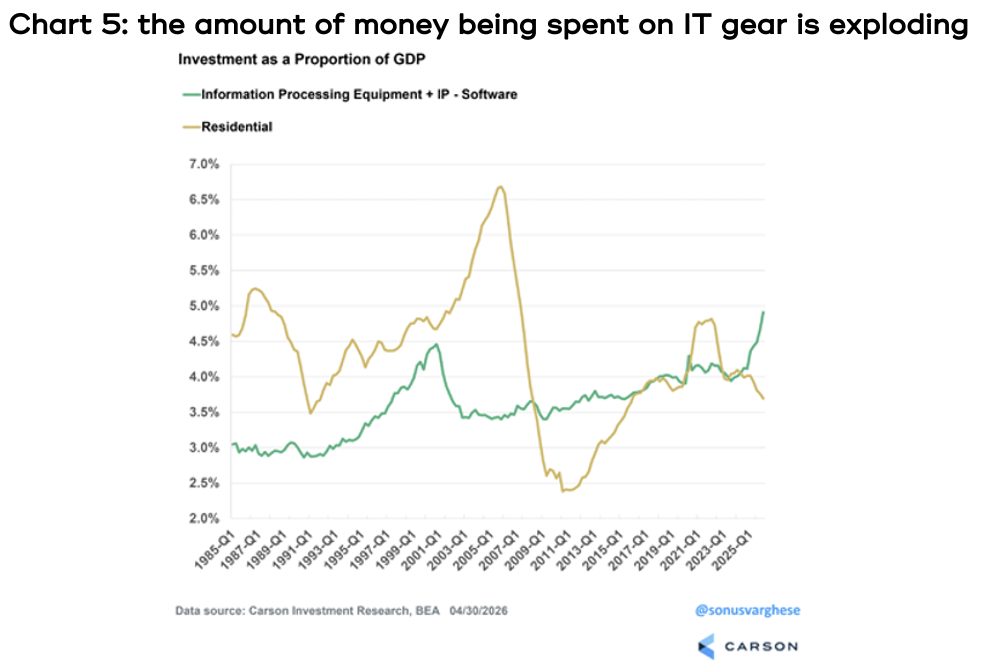
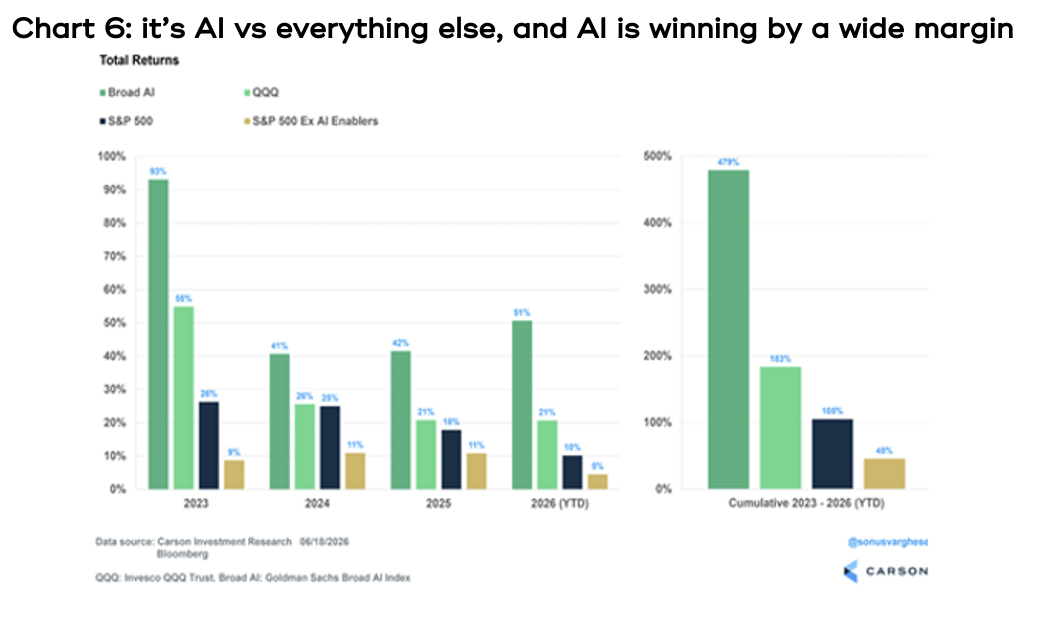
The AI revolution, which is shaping up as the biggest thing in generations, has driven returns in the US market. Chart 6 compares the returns of the Goldman Sachs AI Enablers Index (the darker green bars) against the broader market, including the S&P 500 ex those enablers (mustard). Since 2023, the AI Enablers have returned almost 480%, while the index returns without those enablers was less than one-tenth of that, at 45%.
Growing talk of a bubble
That headlong spendathon by the hyperscalers has massively increased demand for computer chips (semiconductors), while it takes years to increase supply. The result has been a spectacular rise in the share prices of the world’s biggest chip manufacturing companies – see chart 7.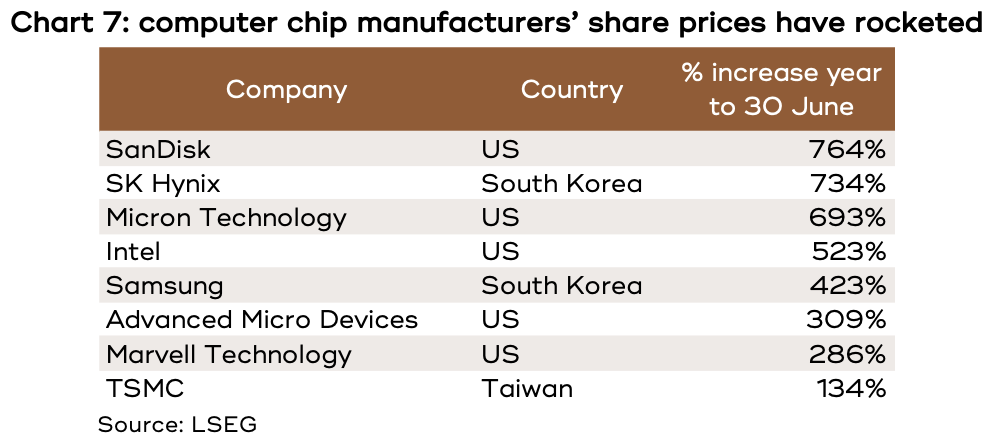
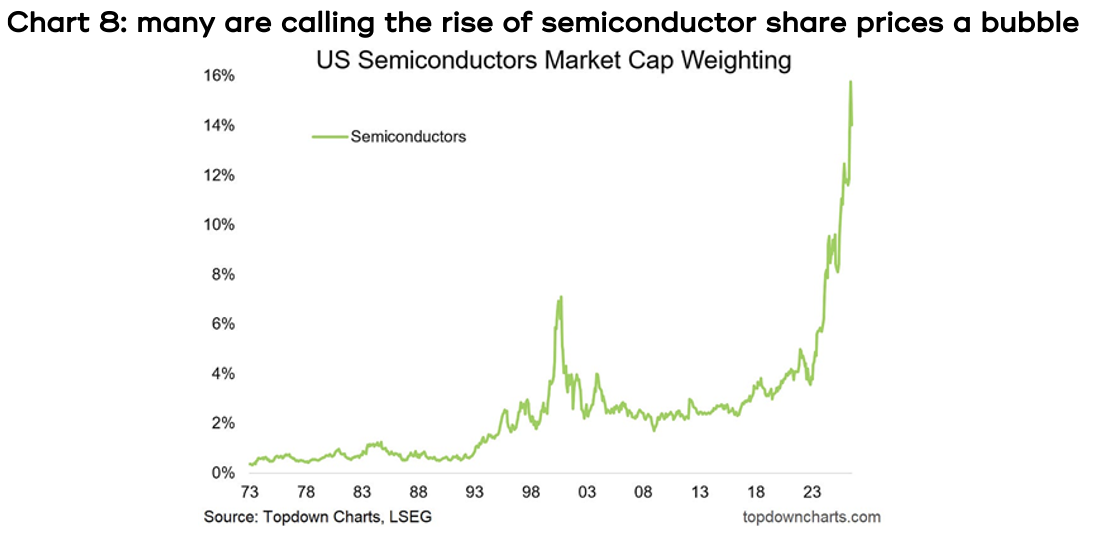
The result has been what many are calling a bubble in semiconductor stocks. Chart 8 shows the parabolic increase in the weighting of semiconductors in the S&P 500.
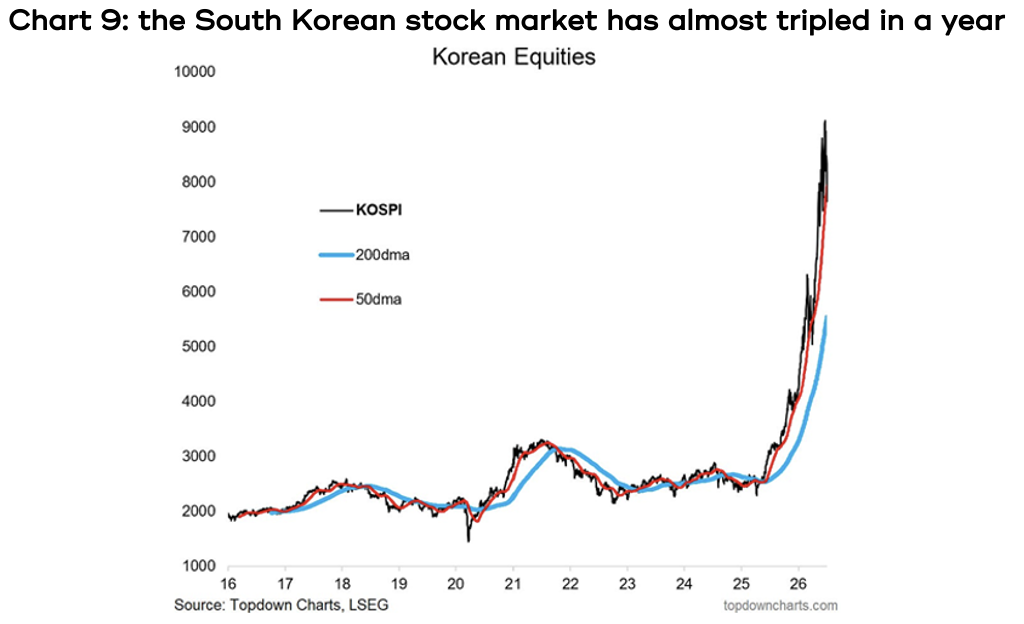
And the South Korean stock market, home to two of the biggest chip companies in the world, has almost tripled in the space of a year, which is cited as another bubble, see chart 9.
When you see 12 month returns like that, it’s natural to question whether it can possibly make sense. However, there are always people in the market who see every glass as half empty, and it’s human nature to see bearish commentary as smart and only looking out for your best interests. So, a few points for context:
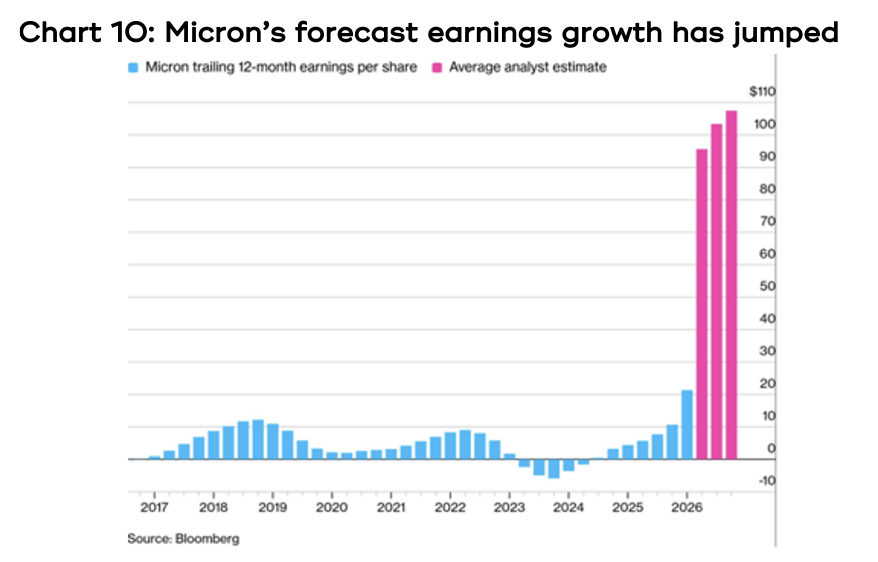
- Since the start of 2025, Micron’s share price has risen 1,305%, but its forecast forward earnings growth has gone up by 1,440%, see chart 10. Given we keep banging on about share prices following earnings growth, it makes sense Micron’s share price would rocket higher.
- Despite its remarkable rise, the South Korean market is trading on a forward PE (price to earnings) ratio of only 8.7x, almost half the Australian market’s 17x. And last week, the South Korean government announced a US$880 billion AI spending program. That’s a lot.
- CEOs of chip companies are describing the demand for their products as insatiable. Even Apple and Microsoft are unable to source sufficient chip supplies.
- It takes between 3 to 5 years to get a semiconductor manufacturing facility (called a fab) up and running, and, depending on the type of chips being made, costs anywhere between US$8 billion and US$40 billion. In fact, TSMC’s total investment in building a fab in Arizona now exceeds US$165 billion.
- On top of global demand for data centre capacity potentially tripling by 2030, Bank of America forecasts annual shipments of 1 million humanoid robots by 2030, with each one containing upwards of US$13,000 worth of computer hardware. One market forecast is that the robotic semiconductor market will grow from US$11.2 billion in 2025 to US$41.2 billion by 2030.
The Great Rotation
Four of the hyperscalers, Meta, Microsoft, Amazon and Google, are members of the so-called Magnificent 7 (the other three are Apple, Nvidia and Tesla), the group of stocks that did most of the heavy lifting in the US markets’ rise over 2023-2025. Chart 11 shows how the free cash flow of those four companies has crashed since the start of 2025, as it gets spent on AI.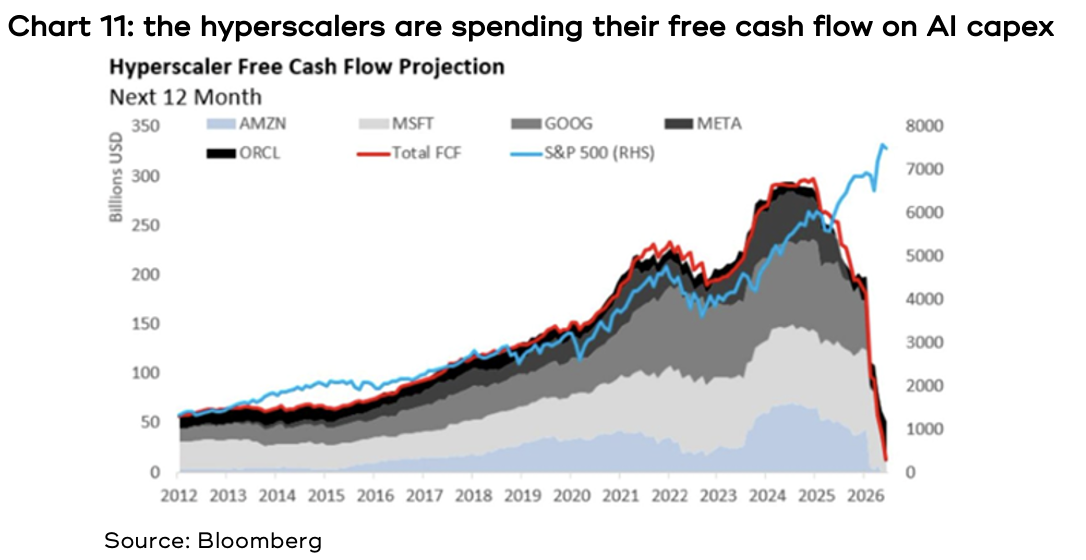
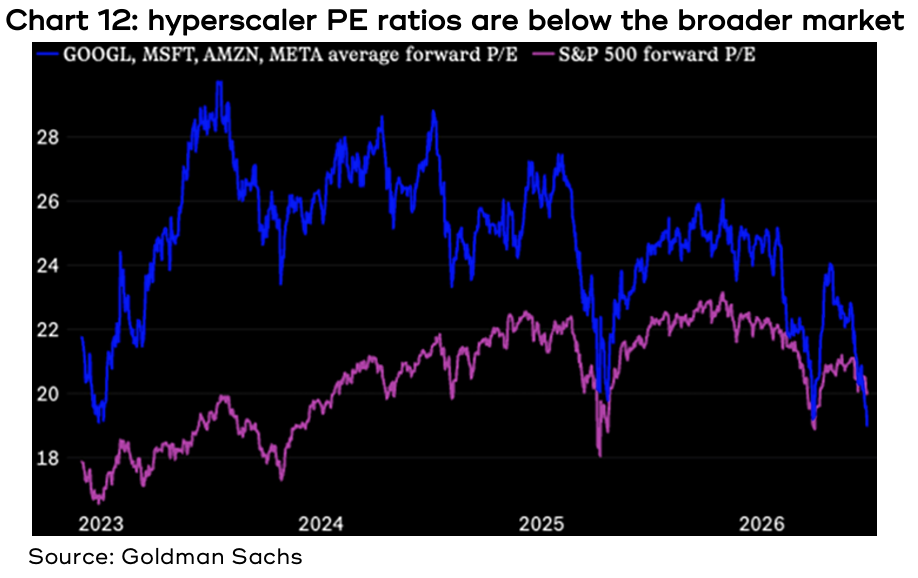
Possibly because of that, investors have been rotating out of the hyperscalers and into other companies that are providing the picks and shovels of the AI boom, which has seen the valuations of those giant tech companies fall to below the broader market, see chart 12.
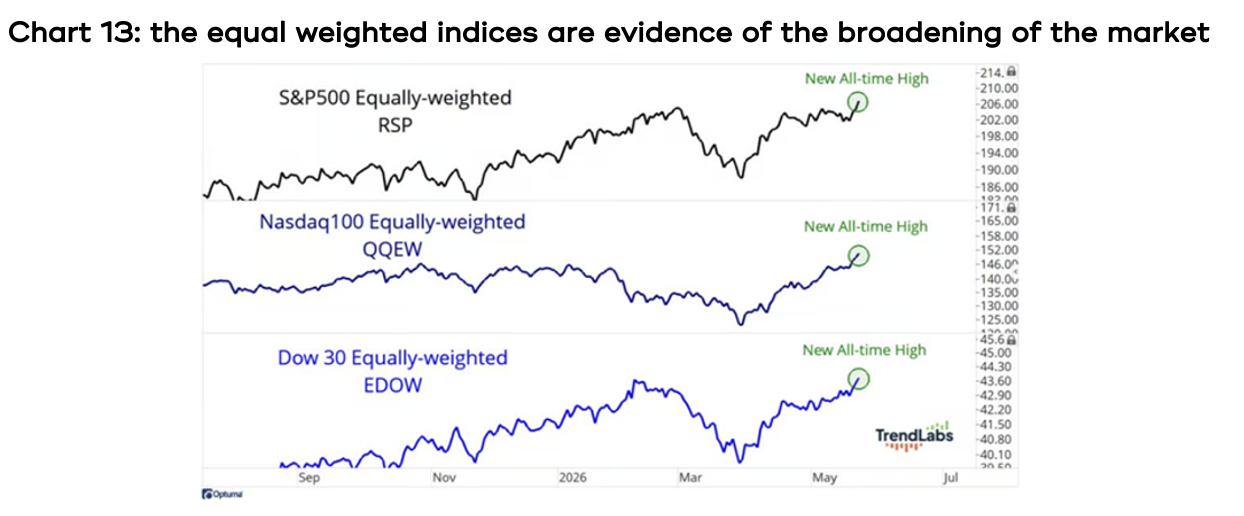
A strong indicator of that broadening of investment is that the equally weighted versions of the S&P 500, NASDAQ and Dow all hit record highs recently – see chart 13. To explain, an equally weighted index of the S&P 500 has the same amount invested across all 500 companies in the index, so 0.2% each, as opposed to the market cap weighted index which invests according to each company’s size. When the equally weighted index hits all-time highs, it’s not because of a handful of tech giants doing all the hard work, it’s all the companies working together.
Reasons to be cheerful
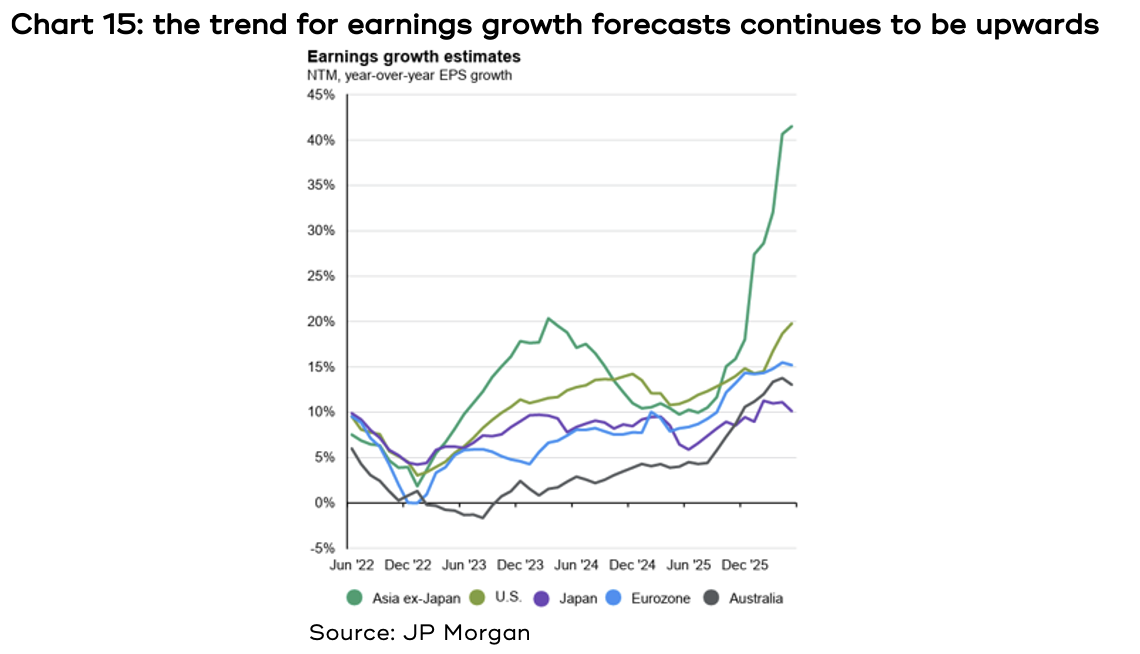
Despite the strong market returns over the last 12 months, there are many sound arguments that the outlook for share market returns supports remaining fully invested. Forecast earnings growth across all global regions for the rest of 2026 and 2027 are strong, see chart 14, and the trend continues to be upwards, see chart 15.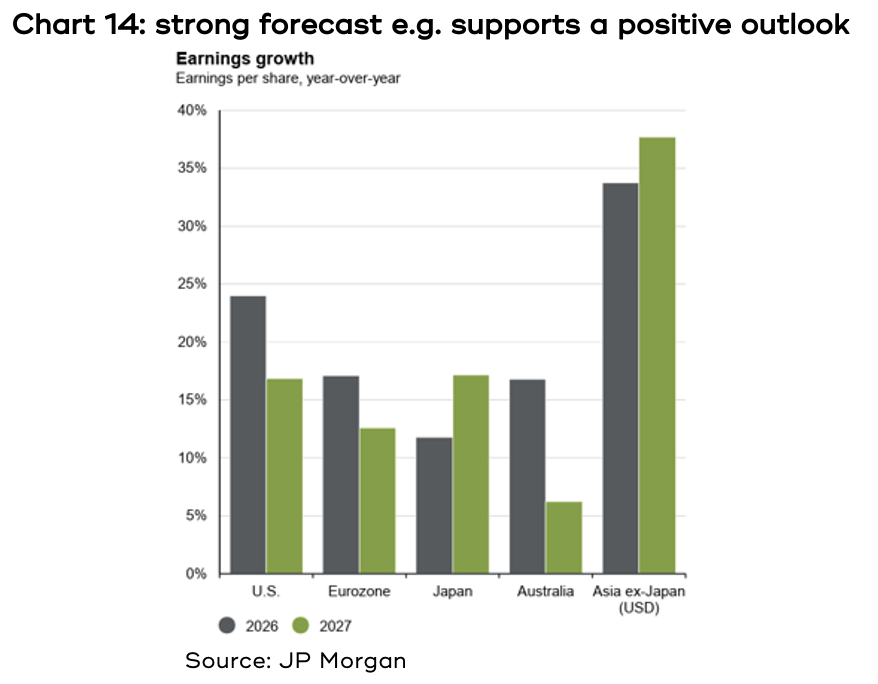
June saw weakness in the US markets, especially in the Mag7 stocks. However, the underlying market mechanics contained some positive messages: whilst the S&P 500 fell for five straight days, the number of companies’ share prices going up exceeded the number going down each day, which is a very rare event. Also, small and mid-cap companies had a strong month, rising 3% each.
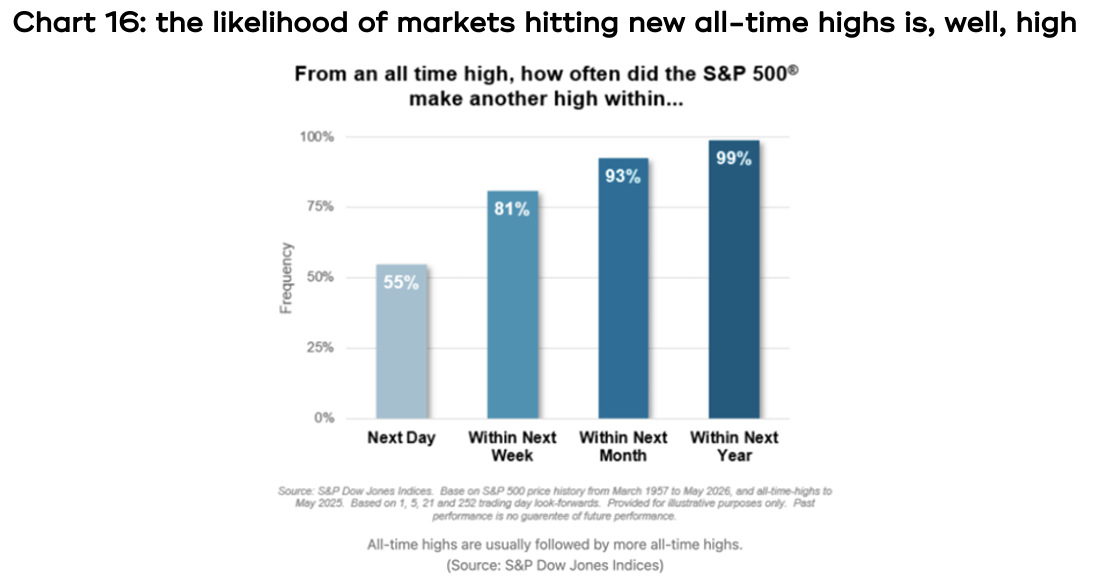
For those who are reluctant to invest when markets are at all time highs, for fear of “getting in at the top”, chart 16 shows that the likelihood of the S&P 500 hitting a new all-time high within 12 months is 99%. That’s why markets trend from bottom left to top right.
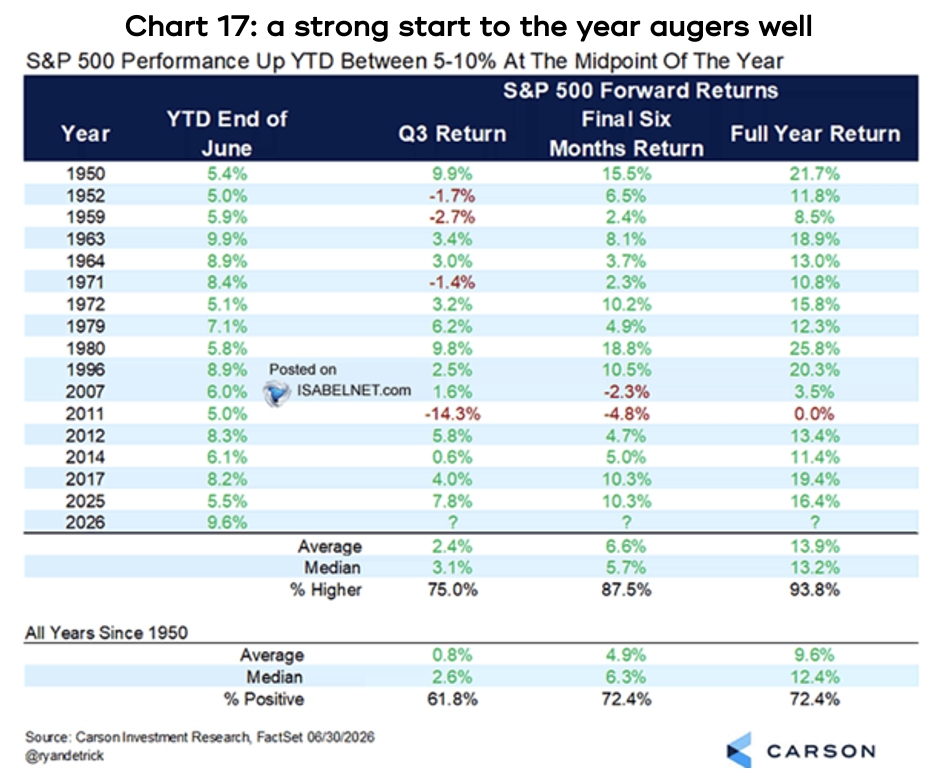
This is another interesting statistic: since 1950 there have been 16 occasions where the S&P 500 has risen between 5-10% in the first 6 months of the year, and in all but one of those years, the market has finished higher (the outlier finished exactly square), with an average increase of 13.9% - see chart 17.
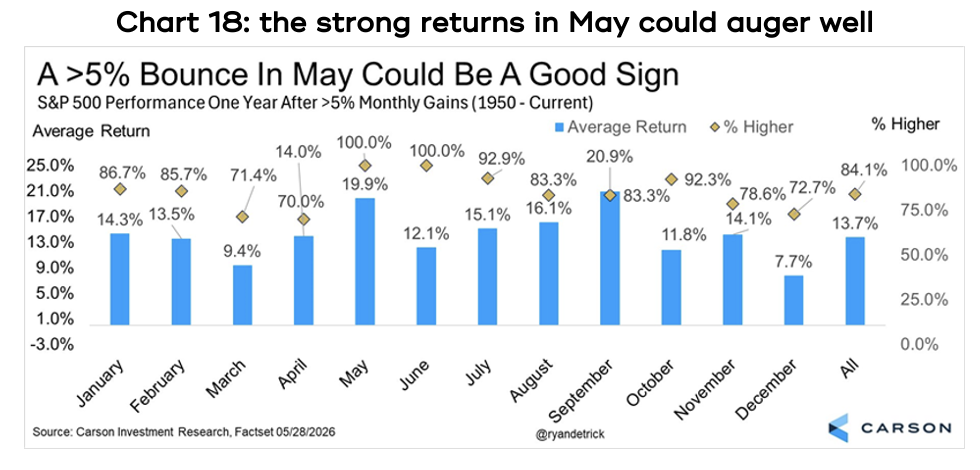
Also, May was a very strong month across global markets, with the S&P 500 rising by 5.3%. There’s a lot going on in chart 18, but what it tells us is that since 1950, when the S&P 500 has risen by at least 5% in May, 12 months later the market had risen by an average of 19.9%, and the hit rate was 100% (i.e. it went up every time).
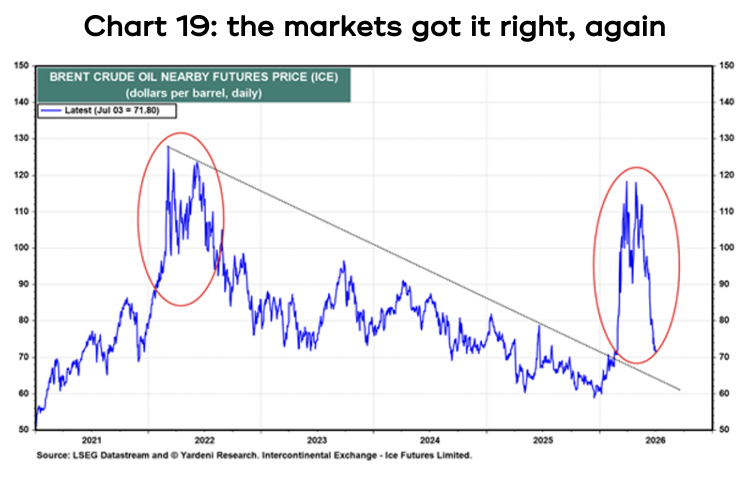
Finally, for those that fear that share markets are unduly optimistic. It’s worth recalling that after the outbreak of the Iran War, there were countless experts catastrophising about the impact the closure of the Straits of Hormuz would have on the global economy, with dire predictions of oil hitting US$200 per barrel.
The markets never seemed to buy into it, with the oil price maxing out at about US$120, and share markets bottoming in late March, well before the any formal ceasefire. The oil price is now back down to about US$70, see chart 19. It appears the markets got it right, again.