
The lead up
Through to mid-July, US financial markets had been pretty cruisy. The S&P 500 had returned 19% year to date, with one pullback of about 5%, and the most commonly referred to measure of volatility, the VIX index, if anything was suggesting markets were complacent.
On 11 July, US inflation came in a little lower than expected and the markets got even happier, hitting a fresh all time high on expectations that the Fed would finally be able to start lowering interest rates while the rest of the economy still looked in reasonable shape, on target for the so-called ‘soft landing’, meaning the economy would make it through a rate tightening cycle without going into recession.
An unemployment speed hump
Then on 2 August, the US unemployment rate was reported at 4.3%, which was higher than had been expected and marked the fourth consecutive monthly increase. Suddenly the market swung around to worry that the US economy was heading for a recession, or a ‘hard landing’, and bond markets raised the likelihood of the Fed cutting rates in its September meeting to 100%.
On that Friday, the S&P 500 fell by 1.8%, but the Russell 2000 small cap index, which only a couple of weeks earlier had enjoyed a 10% rally over a few days when markets were counting on a soft landing, dropped 3.5% on the newfound risk of a hard landing.
The Bank of Japan increased interest rates
On 18 July, Japan’s inflation rate came in at 2.8%, which the Bank of Japan considers incompatible with a cash rate of 0.1%, so they raised rates to 0.25%.
Whilst that hardly sounds like it should cause much of a stir, it did, in large part because the Bank of Japan said there were more rate rises to come.
Enter the carry trade
Japan has had a zero or negative cash rate since October 2010. A popular strategy for hedge funds and traders has been the ‘carry trade’, where they borrow money in Japan at next to nothing, then invest the proceeds into other risk assets, like shares, bonds or currencies, often in offshore markets like the US.
It helps to understand the scale of the Japanese carry trade. Whilst nobody knows the exact number, Deutsche Bank estimated it to be around ¥20 trillion (more than A$200 billion).
A lot of these traders tend to make very similar bets, mostly following what’s called momentum strategies, which boils down to buying things that are going up and selling things that are going down, and mostly in very large, liquid assets. But because they’re using borrowed money, they operate under very strict stop loss restrictions, which means if the asset they’re invested in falls below a specific price, they have to sell.
One of the quirks (some would say problems) of today’s financial markets is that it’s estimated fundamental trading on global markets, that is, buying and selling of financial assets by long-term investors, accounts for only around 5% of daily turnover. In other words, those traders are mostly buying and selling off each other or robots.
A simultaneous rush for the exit
The carry trade strategy worked really well, until the Bank of Japan started talking about higher rates at the same time that the US was factoring in lower rates. Suddenly, a lot of traders were facing margin calls on their Japanese loans, meaning they either had to stump up more cash to reduce the leverage or sell assets to pay down the loan. A lot of them chose (or were forced) to sell assets – and WHACK!
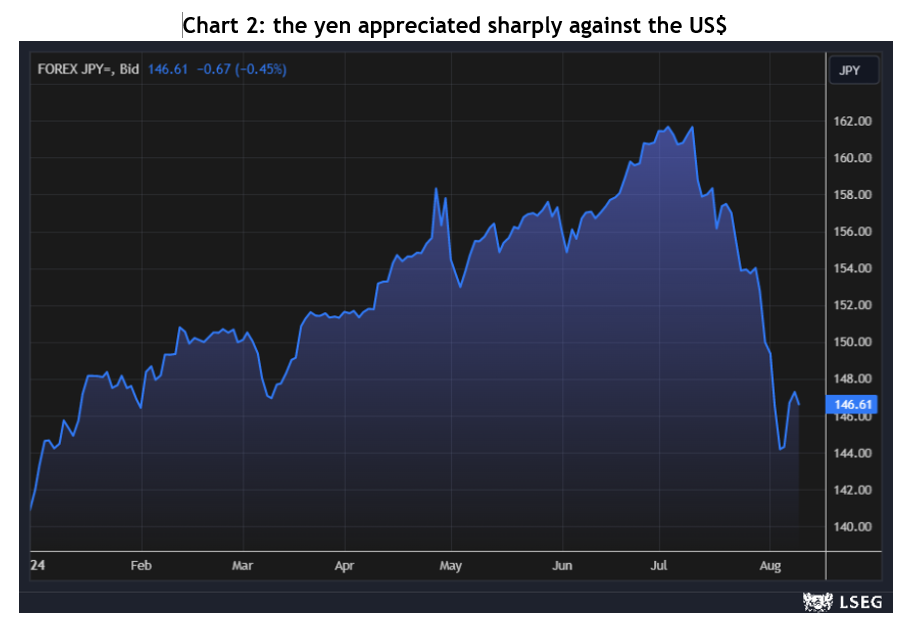
To settle the margin calls, they were selling their risk assets, such as US shares, and using the proceeds to buy back yen to repay their Japanese loans. That had the dual effect of share prices and sharply increasing demand for yen, causing the yen to appreciate massively against the US$, going from 162 to 144.
Mayhem in Japan
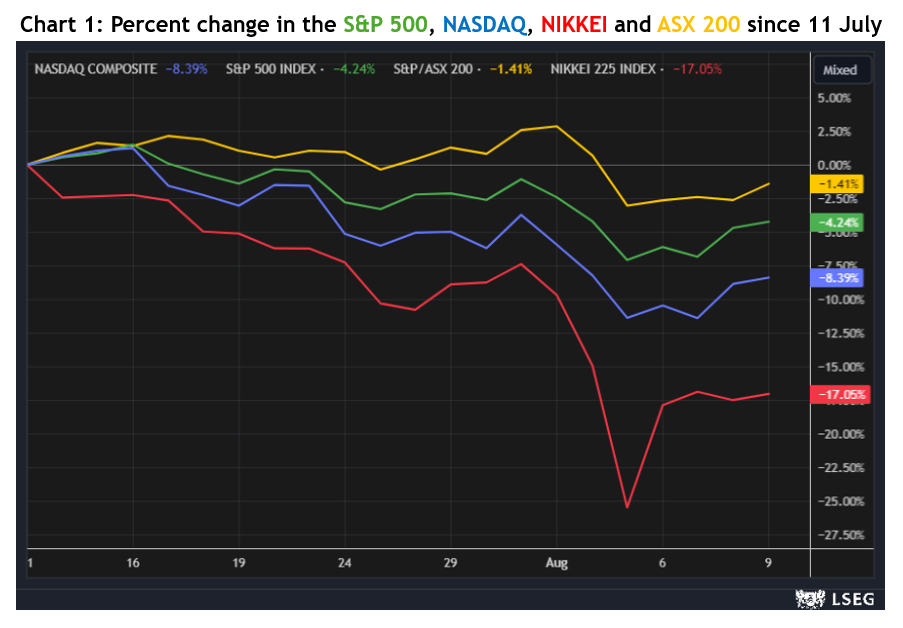
While the share market volatility certainly reverberated around the world, with the S&P500 down 6% from its highs at its worst and the NASDAQ down 11%, and the ASX 200 down 3%, Japan’s NIKKEI index dropped 25%! On Monday 5 August, the index fell 12.4%, which is its second biggest one day fall ever, after black Monday in October 1987.
That’s worth dwelling on for a moment: Japanese shares had a worse one day fall last week than they did during the GFC or COVID, or even during the post 1990 bubble correction. But it wasn’t due to any fundamental problem.
Notably, on Tuesday 6 August, the NIKKEI rose by more than 10%.
Should we be worried?
In short, we don’t believe so. Wary, yes, worried, no.
Firstly, share markets have a long history of corrections, and they invariably pick themselves up, dust themselves off, and soldier on.
In the US, over the past 100 years, 94% of years have seen at least a 5% share market drawdown, 64% have seen at least a 10% drawdown, and 26% have seen at least a 20% drawdown. Indeed, over the past 40 years the average intra-year drawdown has been 14.2%.
In Australia, over the past 30 years the average intra-year drawdown has also been 14%.
Suffice to say, right now we don’t see any big, global imbalances that a represent systemic issue. Also, the Bank of Japan has said it will not be doing anything with interest rates while financial markets are volatile.
Will the US recess?
It’s interesting to note that the very next week, the employment data in the US was better than expected. It appears the early August data was affected by Hurricane Beryl, which forced some people to stay home from work and caused a spike in temporary layoffs.
The recent data about the US services sector, in terms of both activity and employment, was unexpectedly strong, indeed it was also strong in Europe, Japan and China.
Also, the US government is running a budget deficit of more than 6% of GDP, which represents an awful lot of money going into the economy, making it harder to recess.
What about Australia?
The numbers in Australia are not as strong. While the unemployment rate has remained at 4.1%, job ads have fallen for 9 of the past 11 months. The higher interest rates have a more pronounced effect on household spending because we have a high proportion of borrowers on variable rate home loans, and GDP growth per capita has been negative for five quarters in a row.