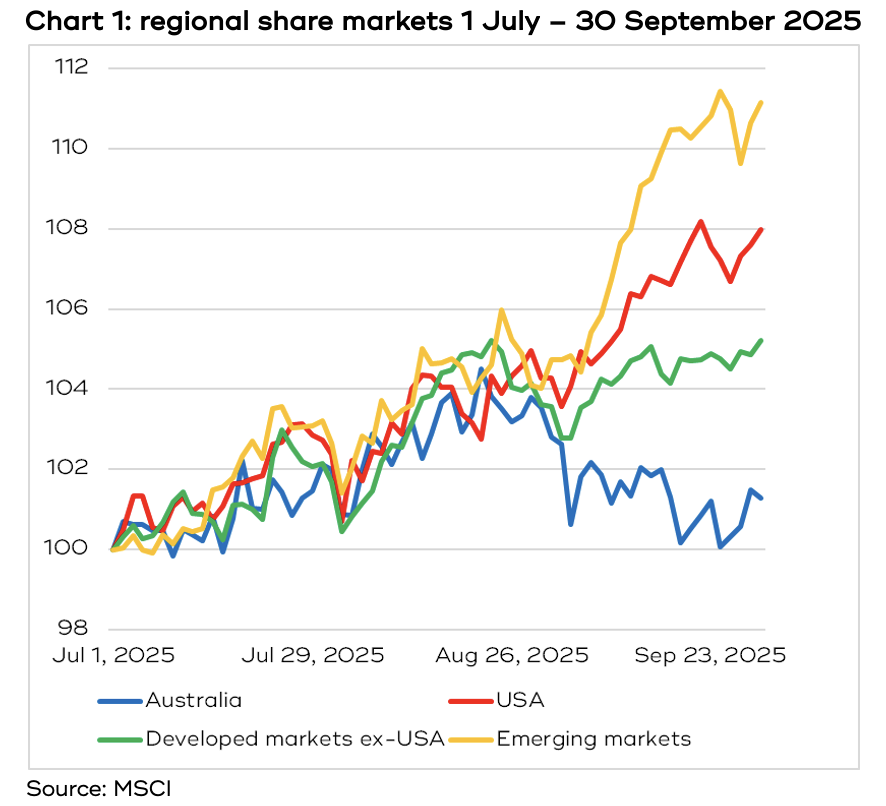
The September quarter saw global financial markets continue to power on, with 17 share markets around the world hitting all-time highs, led by the barn storming emerging markets.
Economic data continues to show recession fears, particularly for the US, are overdone. Commodities have bounced, with precious metals in the spotlight. Geopolitics continues to dominate headlines, be it war in the Middle East and Ukraine, or the day-to-day pronouncements from the Trump administration. And spending on AI by the giant tech companies sparks concerns about overreaching.
THE BULLS ARE IN CONTROL
Share markets around the world are on a tear. Exactly what’s sparked the run is difficult to put your finger on and varies from market to market, but it is very broad based.
The best performing region across the world so far this calendar year has been the emerging markets, which includes parts of Southeast Asia, South America, Europe and South Africa, and has risen 22%.
Perhaps counterintuitively, given the threat of US tariffs potentially disrupting global trade, many of the Latin American markets have risen strongly. For example, Colombia is up 38% year to date, Chile is up 34%, Mexico 30% and Brazil 22% (Argentina is the fly in the ointment, down 30%).
In the past, the emerging markets, especially Latin America, have done well when the US$ drops against global currencies, which has been the case this year. That probably made a lot more sese when these economies were dominated by resources companies, but the best performing sectors year to date have been IT (+77%), consumer discretionary (+61%) and financials (+60%), with materials up ‘only’ 43%.
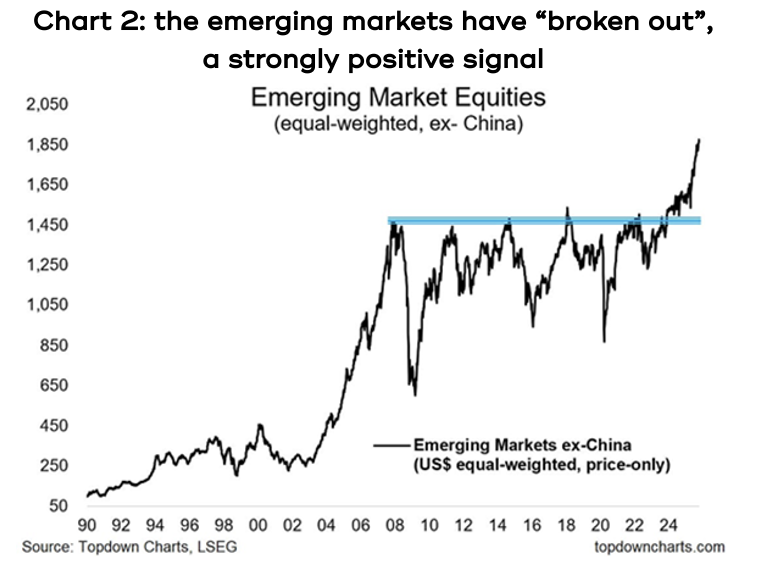
Chart 2 shows the emerging markets, in this case ex-China, have “broken out”, that is, the blue line shows a level of resistance that was bumped up against multiple times, then on the sixth attempt it’s burst through. That is a sign of strong positive momentum.
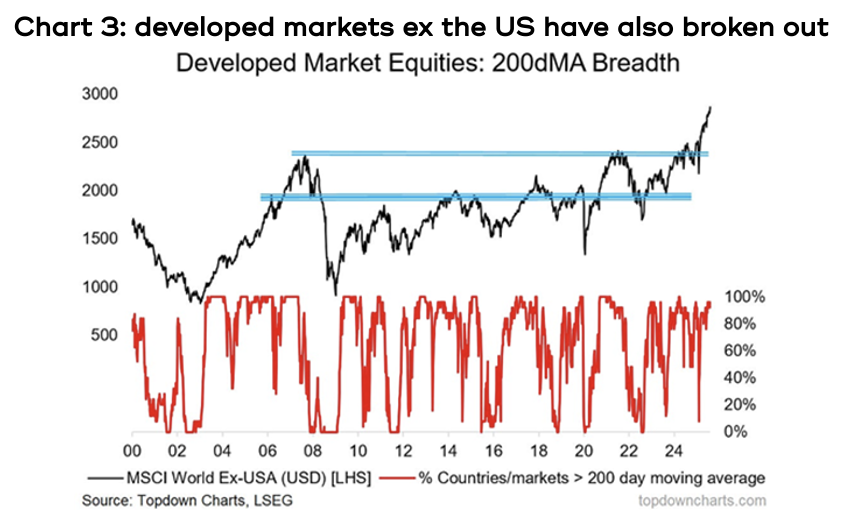
We are seeing a similarly broad break out amongst developed markets, this time ex the US. Chart 3 shows a group of the 70 biggest stock markets outside the US have performed very strongly this year (the black line), and almost all of them are showing strong momentum (the red line).
One possible tailwind is that over the past 12 months, central banks around the world have cut rates a total of 168 times. Apart from the COVID crisis, the last time rates were cut so aggressively was in October 2009, in the wake of the GFC.
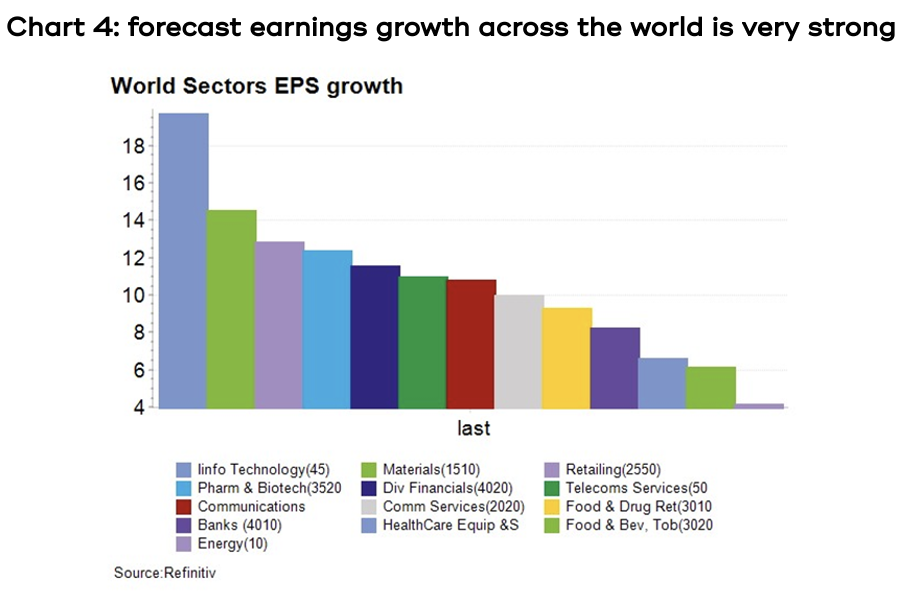
However, as we constantly bang on about, it’s earnings growth that drives share markets, and chart 4 shows the latest forecasts for the next 12 months’ earnings growth across different sectors for the world: seven of the thirteen sectors are forecast to deliver double digit EPS growth!
THE US: NO SIGN OF RECESSION
The trump administration’s tariff program prompted a slew of grim economic forecasts predicting a recession by the end of 2025. So far, those forecasts look way off the mark.
Second quarter GDP growth was revised upwards to 3.8% (from 3%). Within that, consumer spending was much stronger than had been expected, rising 2.5%, though one wrinkle is that consumers in the top 10% of income distribution accounted for almost half total spending, whereas thirty years ago that was more like 37%.
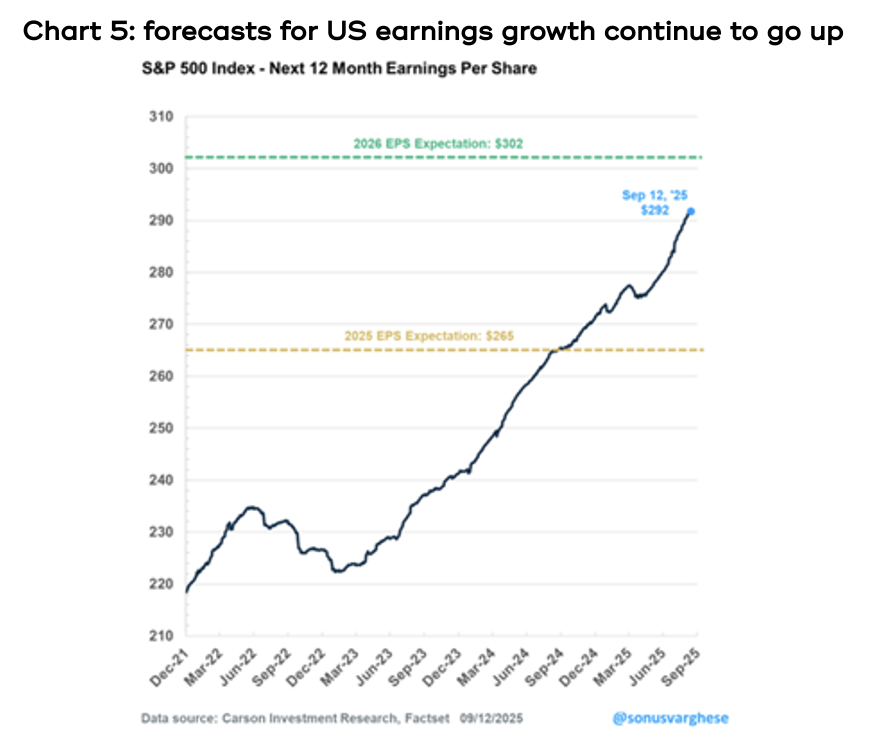
Despite the somewhat chaotic political environment, all three of the major US indices, the S&P 500, the Dow Jones and the NASDAQ, have been setting new all time highs over the past quarter, which has been another reminder that markets are driven by earnings growth, and until companies’ earnings are impacted by the political chicanery, they will continue to perform. Chart 5 shows that forecasts for US earnings growth continue to increase and in fact accelerated after the recent second quarter earnings reports.
Despite that, there is an abundance of speculation that US share markets are in a bubble, driven by the spectacular rise of AI as both a driver of perceived market growth and the potential for bringing about significant improvements in corporate productivity.
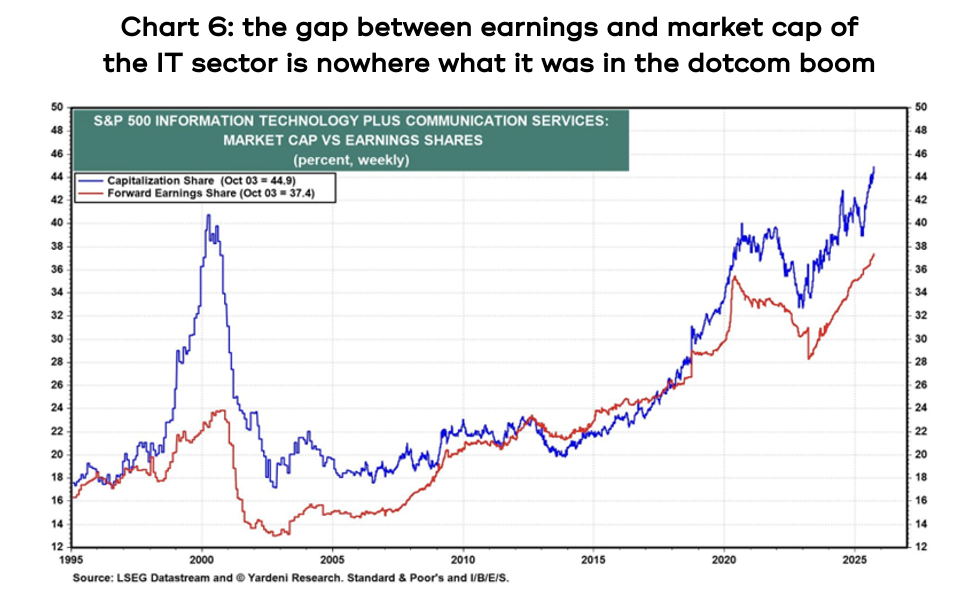
There are plenty of understandable parallels being drawn between the AI boom of today and the dotcom boom of the late 1990s, that ended in a 49% drawdown in the S&P 500. However, there is one huge distinction between the two, that’s well illustrated by chart 6, which shows the gap between the proportion of the whole market’s projected earnings per share accounted for by the IT and communication services sectors and their share of the overall index’s market capitalisation. You can see that while there is a gap at the moment, it’s nothing like what it was back in 2000.
While the argument that the AI boom is comparable to the dotcom boom in terms of valuations doesn’t really stack up, one area that probably does warrant some attention is the boom in the construction of data centres.
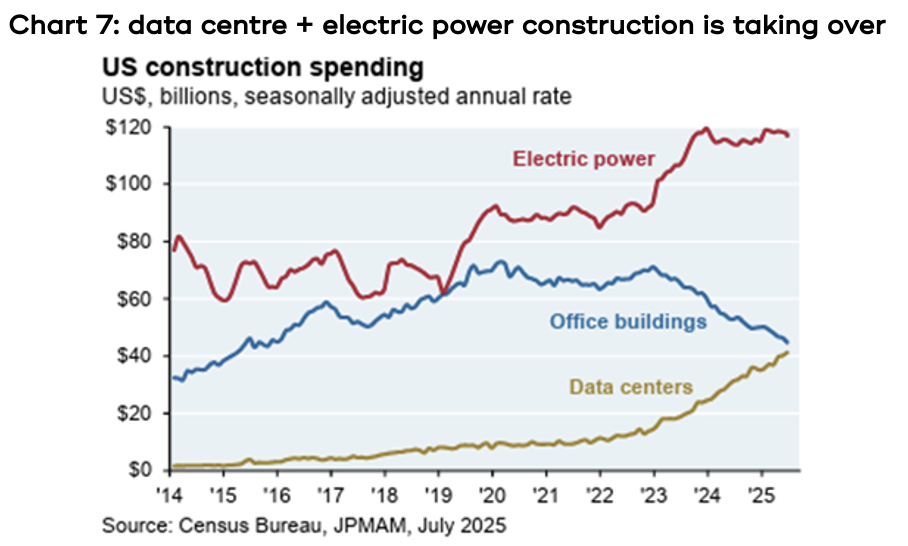
Goldman Sachs projects the five largest US AI “hyperscalers” will spend a combined US$736 billion of capital in 2025 and 2026 alone. Chart 7 shows that data centre construction is already on the cusp of outstripping the construction of office buildings, and when you add construction of new electric power, it amounts to a massive injection into US GDP growth, one that may be hard to sustain.
The added issue is that, until now, those hyperscalers have been funding their AI expenditure through operating cash flows, but they’re now looking at taking on debt. We know from countless past examples that when debt gets added to a boom, things can get out of hand.
Something notable about the US share market rally is that over the past couple of years the “Magnificent 7” tech companies (Amazon, Apple, Google, Tesla, Meta, Microsoft and Nvidia) were the principal drivers of the S&P 500, whereas so far this year, none of them are even in the top 50!
AUSTRALIA: ECONOMIC GREENSHOOTS?
The full year reporting season was another disappointment for the ASX200, with a second year of negative earnings growth at -1.7%. The difference between the top performing sector, communication services (+26.9%), and the bottom, materials (-19.8%, the resources stocks) was close to 50%.
To illustrate how poor the overall market environment has been for the ASX, the FY2025 earnings forecasts that were posted by analysts following the FY2023 earnings reporting season, so two years out, proved to be 17% too high.
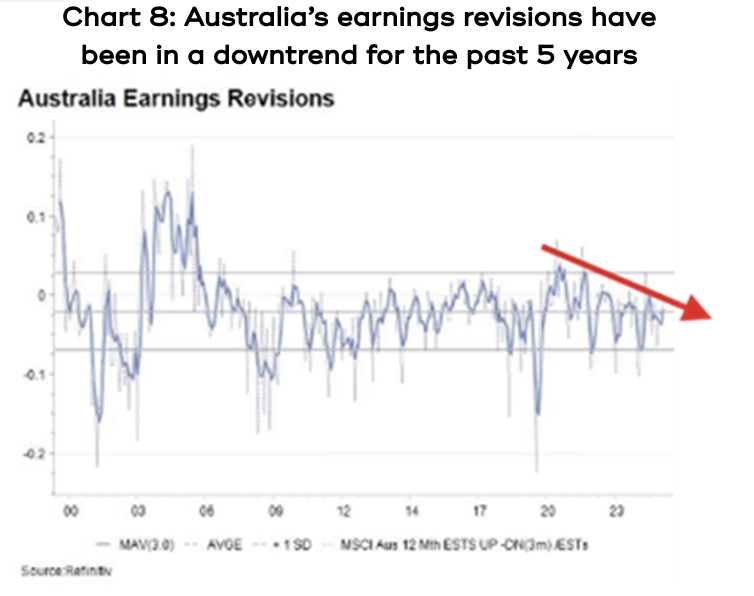
Unlike the consistently positive US earnings growth forecasts shown in chart 5 above, Australia’s earnings revisions have been in a downtrend since the post-COVID high of 2020 – see chart 8.
However, we may be seeing the early signs of a turnaround in Australia’s economic data. UBS conducts a quarterly consumer survey which found consumer sentiment is at its strongest level since late 2019, with forward spending intentions at an at least six year high – see chart 9.
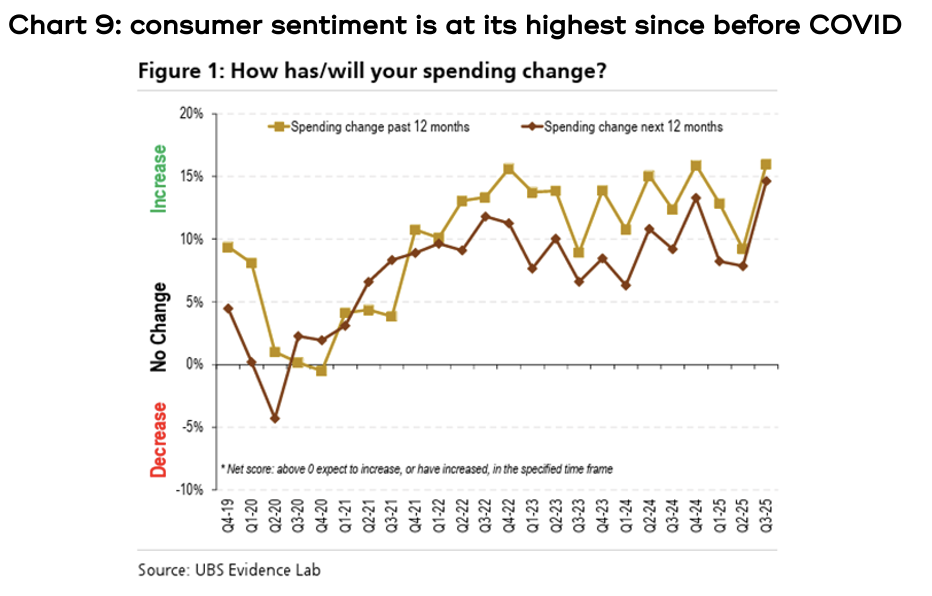
UBS observes that, “This positive shift is correlated with improved domestic economic data, favourable company reports, and receding concerns about the cost of living, and is being led by middle-income households, often referred to as the “mortgage belt”. As a result, consumer spending is shifting away from essentials and into discretionary “fun” categories like clothing, entertainment, and dining out.”
In fact, Australian consumers have gone from being the gloomiest over 2023 and 2024, to now the least gloomy (although still slightly negative), as shown in chart 10.
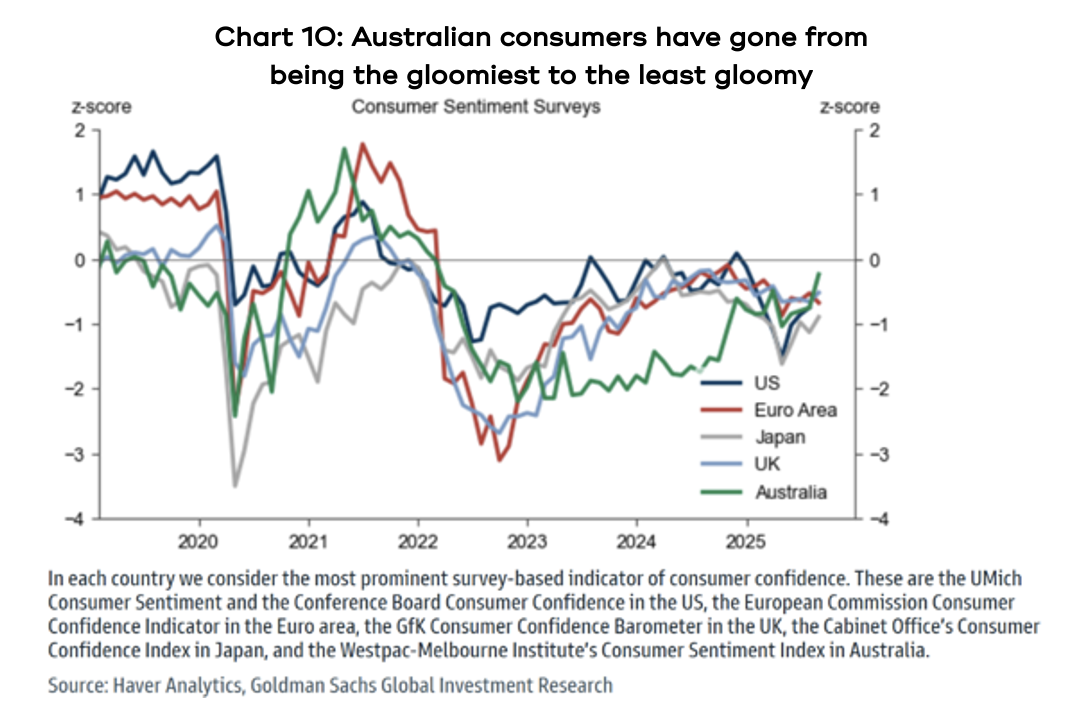
Given consumer spending accounts for about 70% of Australian GDP, it would suggest the Reserve Bank should not underestimate the impact its interest rate cuts can have on the broader economy.
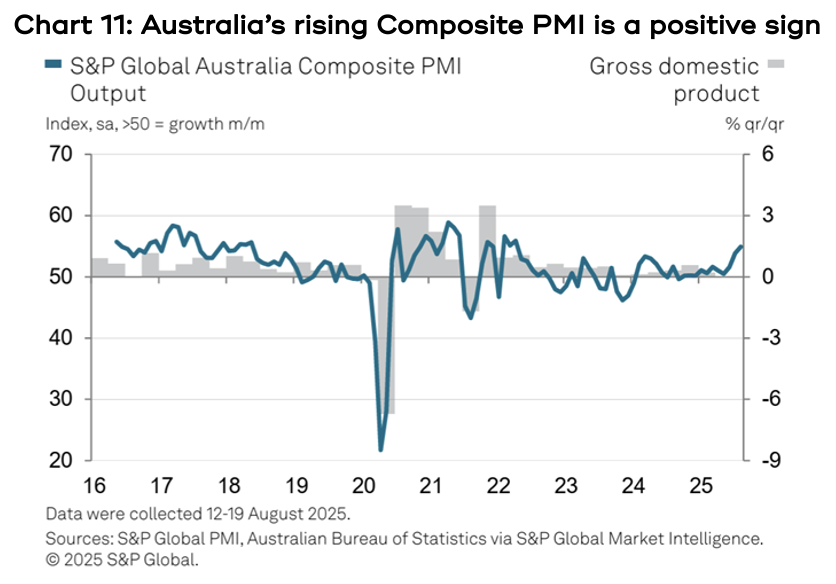
The better news on consumers was backed up by the Composite PMI, which is a leading indicator gauging private-business activity in Australia for both the manufacturing and services sectors, hitting its highest level since 2022. Chart 11 shows the PMI has a reasonable correlation to GDP growth.
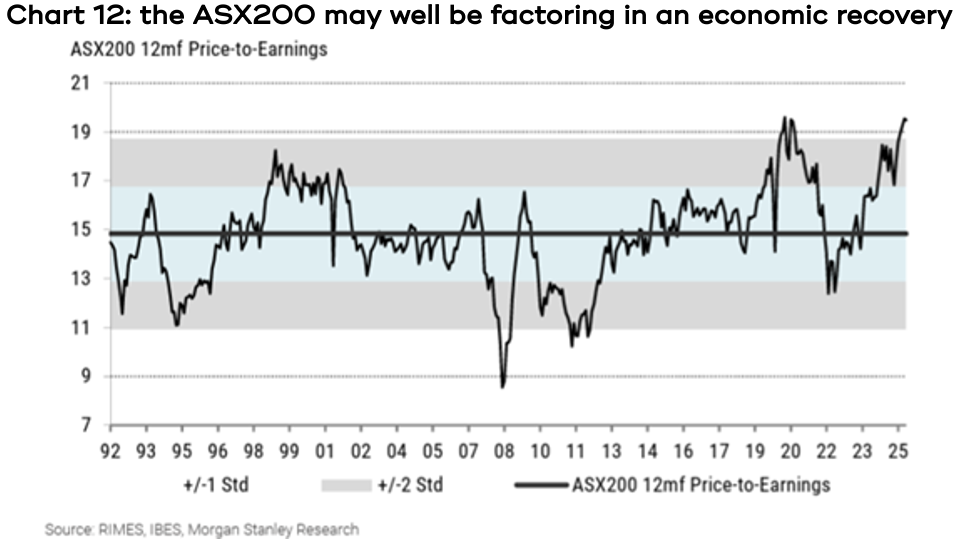
Given the ASX200 is already trading on a relatively high forward PE ratio – see chart 12 – perhaps it’s another reminder that the share market is a forward-looking indicator.
BIG MOVES IN SMALL CAPS
Associated with the dominance of the mega cap tech stocks referred to earlier, the rally in global share markets over the past few years was characterised by small cap companies significantly underperforming their large cap peers, as shown by chart 13, which compares the main US small cap index, the Russell 2000 against the S&P 500 over the past five years.
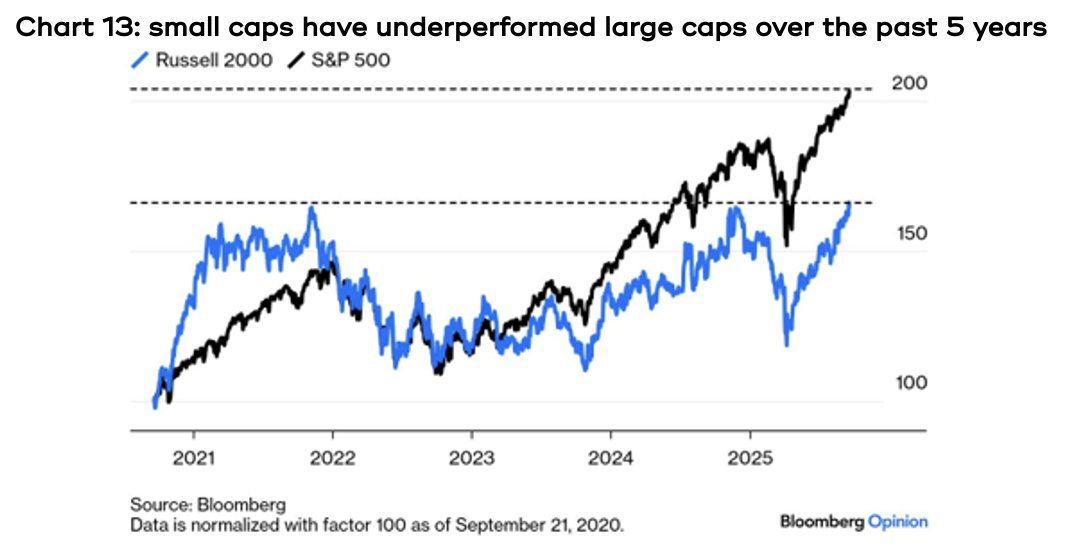
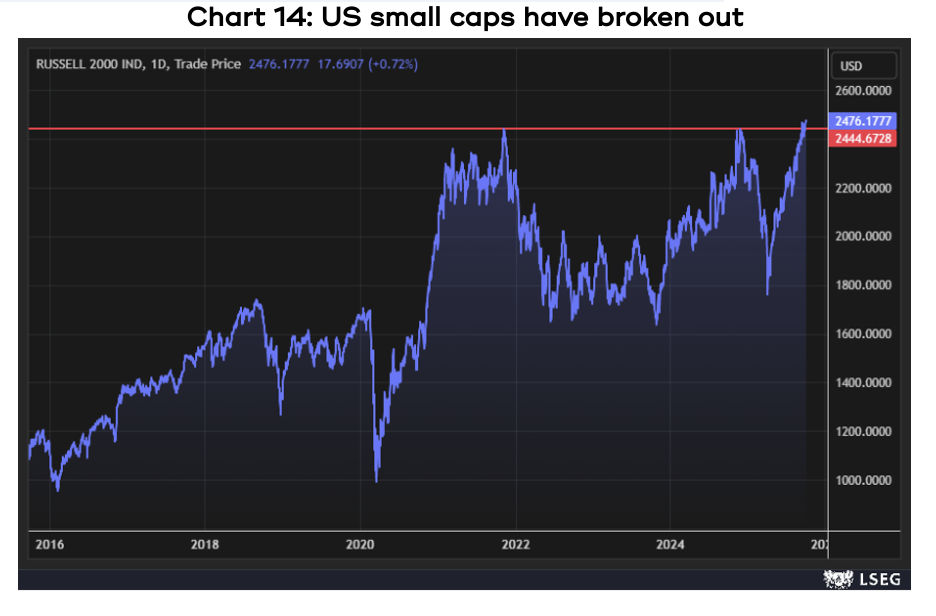
As the blue line shows, small caps have experienced a solid rally post the Liberation Day tariff sell down. What’s possibly more important is that chart 14 shows, like the emerging markets and developed ex-US, the Russell 2000 has now broken out- it might be only just, but it’s again a sign of positive momentum.
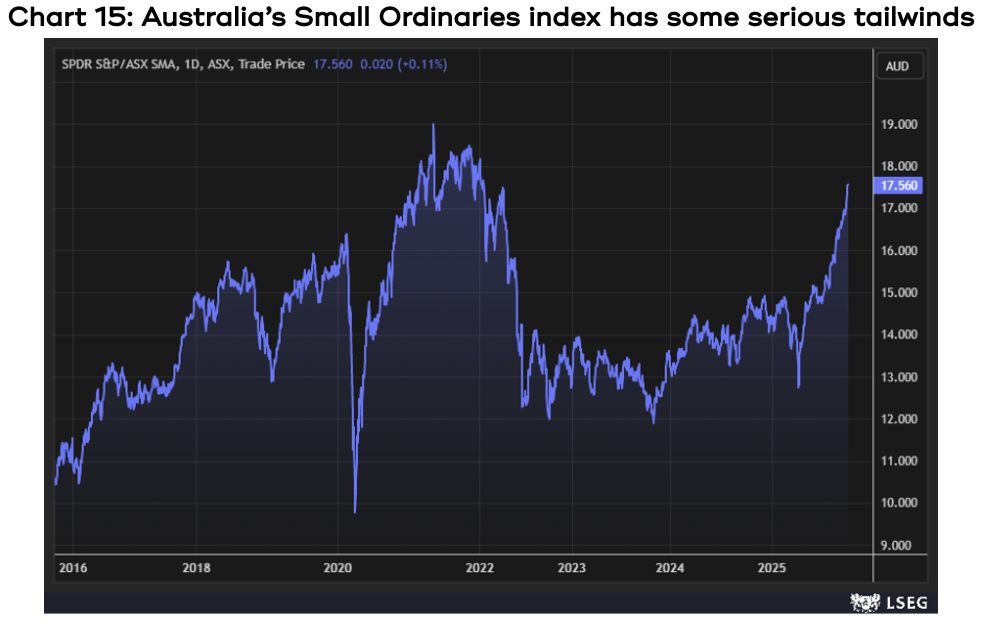
Australian small caps have also enjoyed a strong rally, with the Small Ordinaries index jumping 33% since its April 9 lows – see chart 15. Whilst it hasn’t hit a new all-time high yet, tailwinds like lower interest rates and an increase in consumer spending will be a big help.

Australian small caps have also enjoyed a strong rally, with the Small Ordinaries index jumping 33% since its April 9 lows – see chart 15. Whilst it hasn’t hit a new all-time high yet, tailwinds like lower interest rates and an increase in consumer spending will be a big help.
ALL THAT GLITTERS
Commodities have joined the bull market party and the standout amongst them has been gold, the price for which has risen by more than 115% over the past two years, setting new all-time highs – see chart 16.
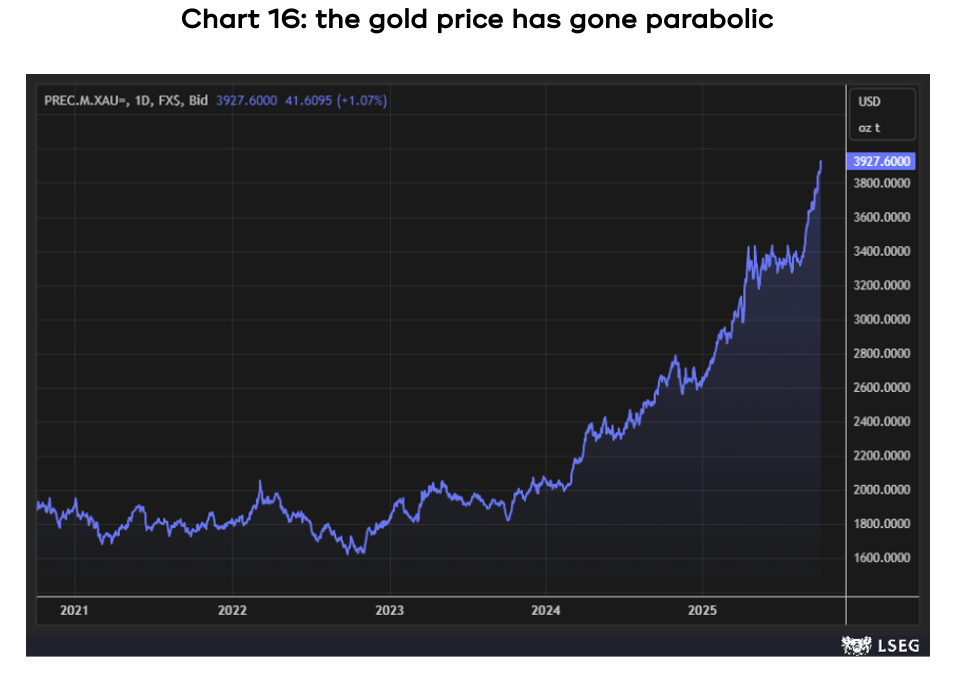
Because only a fraction of the gold produced is used for jewellery or in industry, nor does it have any intrinsic value, or generate any earnings or yield, the price is driven almost entirely by sentiment.
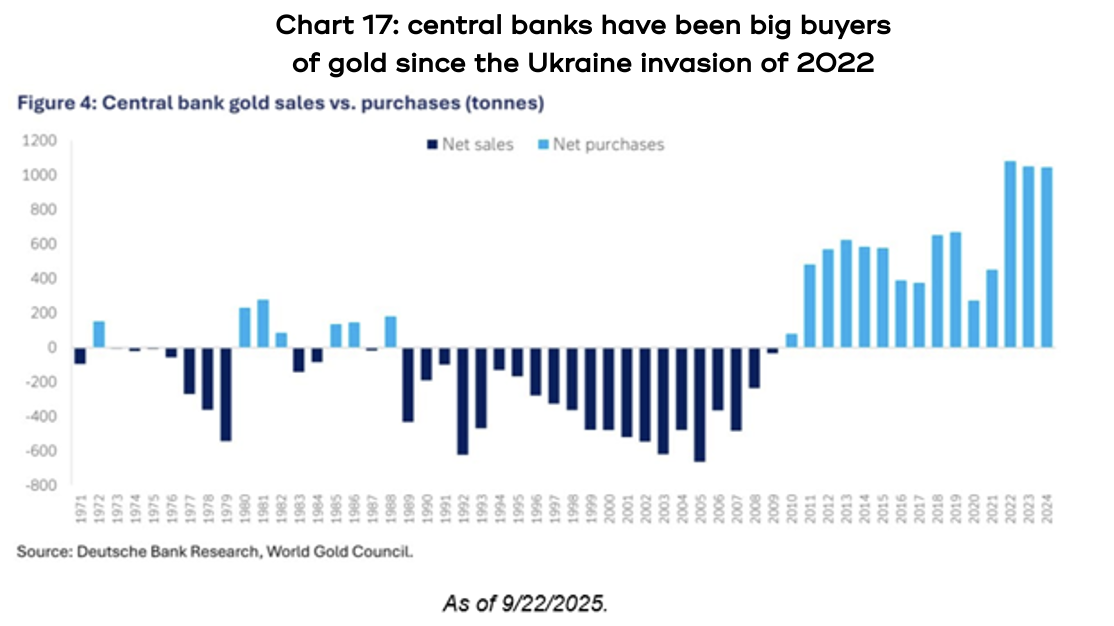
So why the sentiment shift? An important reason is that since the GFC, central banks have been net buyers of gold, and their appetite increased significantly in 2022 after Russia invaded Ukraine and the US and EU froze its dollar denominated foreign assets – see chart 17. Exactly how much more central bank buying there will be is impossible to know, but the positive momentum is, again, clearly strong.
But it’s not been just gold. The silver price has risen 64% since the start of the year, platinum is up 81%, copper is up 25%, and two commodities vital to renewable energy, cobalt (batteries) and neodymium (magnets), are up 44% and 58% respectively.
For Australia, iron ore is flat for the year, and gas is down 6%.
THE OUTLOOK
Pleasingly, the fourth quarter is typically the strongest for the year.
In the US, since 1950 the fourth quarter has averaged a return of 4.2%, compared to an average of 1.6% for the other three, and it’s been positive 80% of the time, compared to 62% for the other three.
For Australia, the fourth quarter has averaged a return of 2.4% since 2004, compared to an average of only 0.7% for the other three quarters.
