
shares - an introduction
There’s a lot to learn about shares, and investing in them, so this is intended to be an introduction to give you some background knowledge that will help us work out an appropriate portfolio for you – the all important risk profile.
Why Your Risk Profile Matters
We aim to design a wealth management strategy and investment portfolio that meets your long-term goals and makes the journey along the way as comfortable as possible.
For us to make appropriate investment recommendations for you, it’s important we understand your “risk profile”, which involves figuring out how much risk you’re willing to take, how much risk you need to take to achieve your goals, and how much risk you can afford to take.
Everyone is different and getting to the right answer on how much risk we should build into your portfolio is a balance between science and art – and communicating. To help you think about those questions, we have developed a simple guide about what “risk” actually means, financial markets and different types of investments.
You can buy shares from more than 80 different stock exchanges around the world, and the combined value of all the companies that trade on them is approaching A$200 trillion.
Naturally, Australian investors focus on the Australian share market, but in the context of the global share market, we are tiny, at less than 2% of the MSCI All Country World Index. The US is by far the dominant market, representing almost 70%.
What is noteworthy, is the US accounts for only 25% of global GDP and a little over 4% of global population. This reflects that whilst a country’s economy certainly influences the performance of its stock market, the composition of the stock market can be very different to the overall economy.
For example, the big four banks account for almost 25% of Australia’s share market, represented by the ASX 200, whereas the entire financial sector contributes around 6% of Australia’s GDP.
One of the advantages of investing in shares is that you can easily gain exposure to the rest of the world. Indeed, that’s one way of reducing the risk in a portfolio.
Shares typically deliver the best long-term returns
Because shares are more volatile than cash and bonds, as an investor you expect to be compensated for taking that extra “risk” by receiving a higher return over time. And that’s exactly how it’s worked out in the real world.
But different economic cycles will produce different results for shares, bonds and cash. There have been periods like the early 1970s where share markets struggled, and then the 1980s where they roared.
But across different time frames, shares will generally deliver a better return than cash and bonds, and, of course, the longer the time frame the bigger the difference those extra returns make.
Source: Vanguard. Australian shares = S&P/ASX All Ordinaries Accumulation Index; International shares = MSCI World ex-Australia Net Total Return Index; US shares = S&P 500 Total Return Index; Australian bonds = Bloomberg AusBond Composite 0+ Year Index; Cash = Bloomberg AusBond Bank Bill Index
The thing to remember is that the range of annual returns around those averages has been huge – for the Australian market the best year was 1983 with a return of +67% whilst the worst was 2008 when it fell 40%, while for the US the range has been from +40% to -60% in a single year.
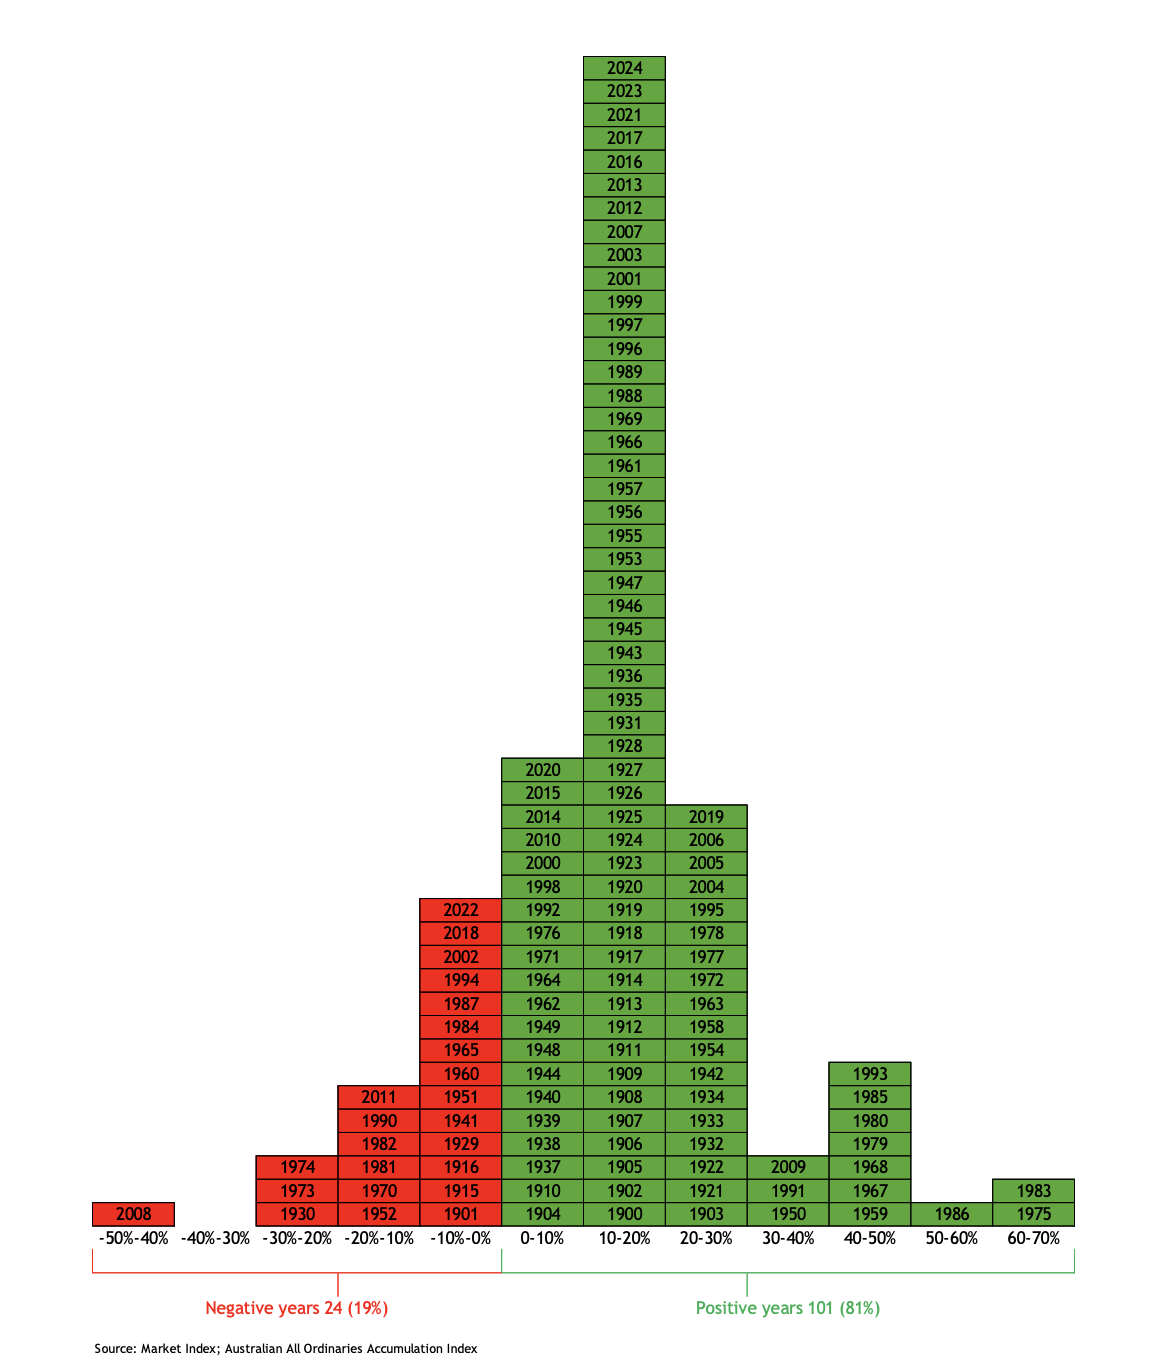
For more historical perspective, between 1950 to 2024, the Australian All Ordinaries Index (which includes the 500 largest companies on the ASX) returned an average of 13.5% per year, but it was only within +/-1% of that average three times over that 74-year period! Over that time, the index went up by more than 20% on 24 separate occasions but recorded a negative return only 18 times. When the market went up, it was by an average of 21.7%, while the negative years averaged 12.5%.
Over the long-run, shares deliver excellent returns, but as the charts above and below show, there can be periods where share markets fall significantly.
For example, on “Black Tuesday” in October 1987 the Australian share market fell 25% in a single day.
The main US index, the S&P 500, fell 49% in the dot-com crash of the early 2000s, then just when it reached a new high, it fell 57% in the 2008 Global Financial Crisis.
Even the COVID-related crash in March 2020 saw the ASX 200 fall by 33% in just a couple of months.
The chart below traces what happened to $10,000 invested in Australian and international shares and bonds over the 20 years to the end of 2024. Even though US shares delivered a great return over the entire period, they went pretty much nowhere for the first five years. An experience like that can really test the patience of any investor.

Australian shares International shares US shares Australian bonds Cash
Source: Vanguard.
Over the past 20 years, the US and Australian share markets have experienced an average intra-year decline of 14%.
In the midst of a market correction it can feel like the world will never be the same and it can be tough to see how things will get better. But the thing is, they always do.
The chart of the Dow Jones index below lists all the significant events over the past 100 years, from wars, to assassinations, to economic crises and health scares. At the time, any one of them presented a gut-wrenching test of an investor’s resolve to stick it out, but as you can see, the long run trend is upwards.
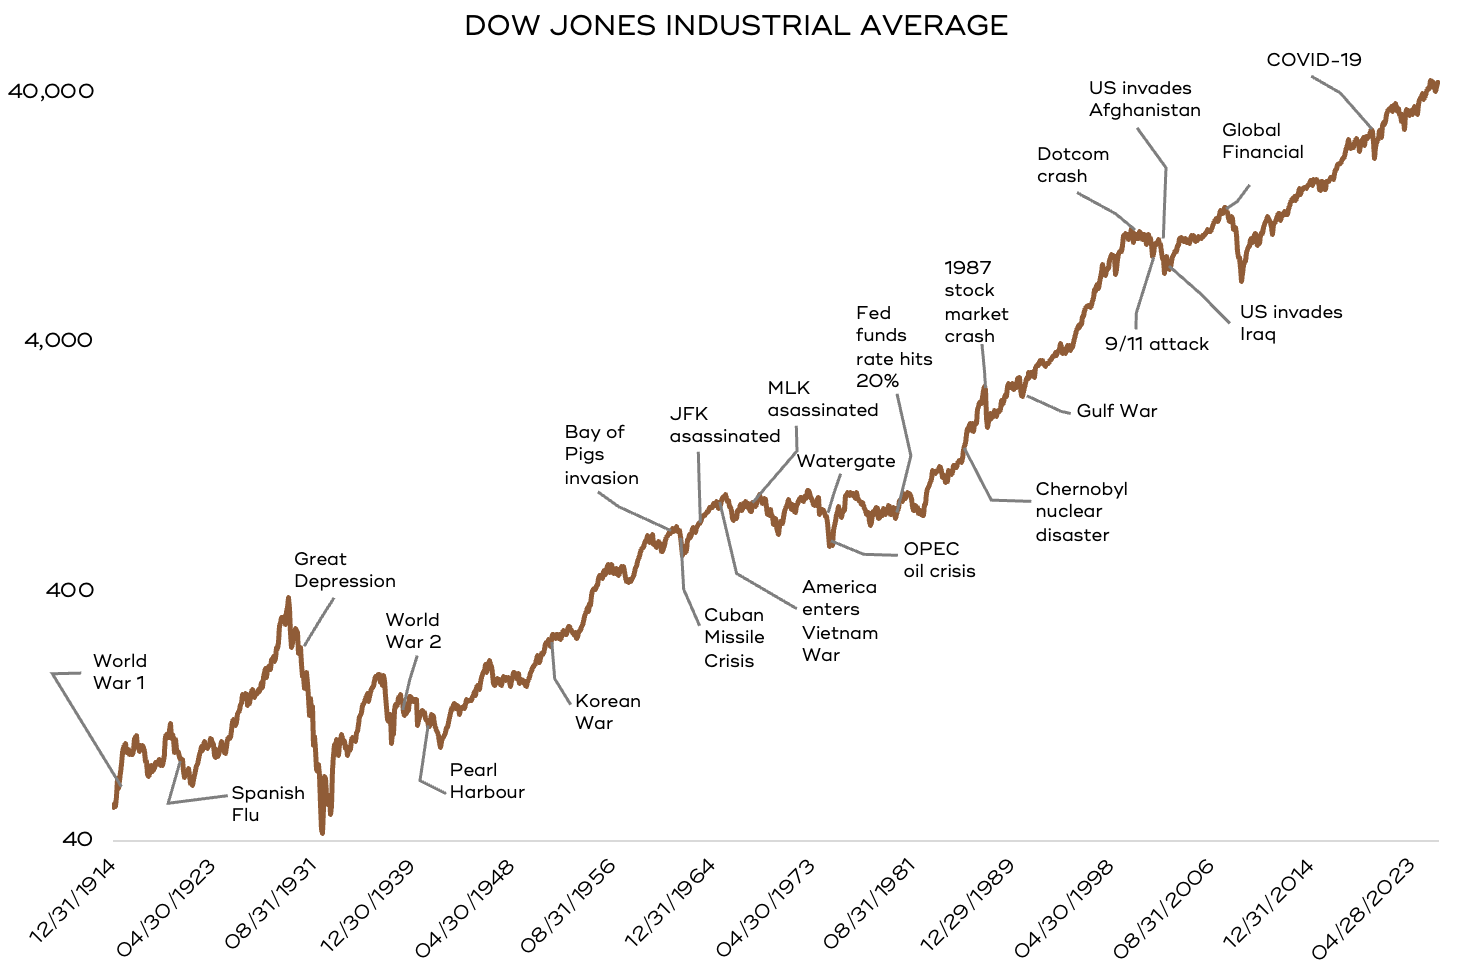
There is no question, shares have been a fabulous way to invest and build long-term wealth, but it’s inevitable there will be some volatility along the way.
The good news is there are ways investors can reduce the volatility in their portfolios, which is what we look at next.
Step 1: Thinking about your risk profile?
Understanding your comfort with risk is key to building the right portfolio. Revisit the key factors in establishing your risk profile.
STEP 3: Managing volatility in your portfolio
Volatility is normal, but it can be managed. Discover how diversification and a long-term view help smooth the ride.