
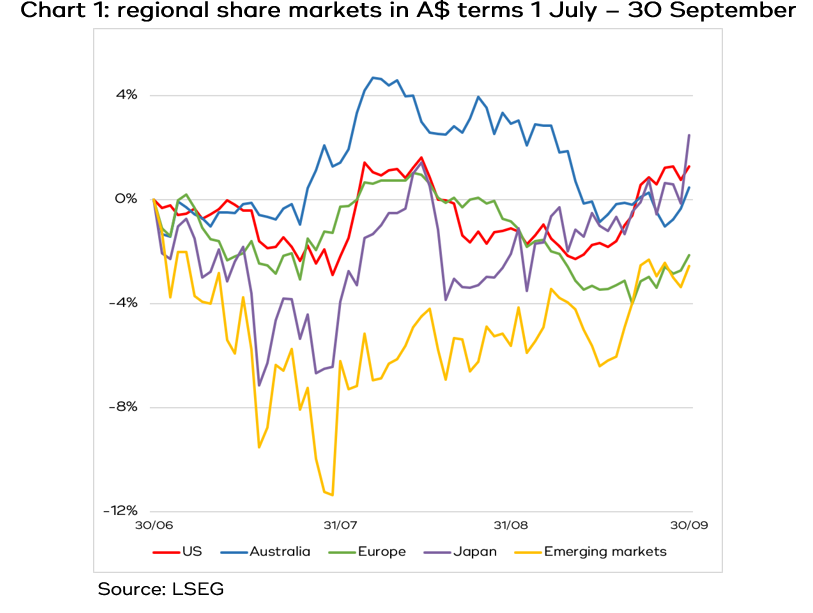
Global share markets were basically flat over the September quarter. Concerns over the inflationary effects of both the Iran and Ukraine wars saw bond yields spike and central banks raised interest rates, marking a negative shift in narrative.
The outlook is shaped by ongoing very high earnings growth forecasts out of the US, thanks to the AI capex tsunami, and what has historically been a seasonal uplift in the December quarter of a US mid-term election year.
lots of focus on inflation and bond yields
Inflationary pressures have been persistent enough across the world to see a range of central banks raise their cash rates. The problem, of course, is that most of the pressure is coming from the flow through effects of the disastrously stupid Iran war together with Ukraine targeting Russian oil refineries, both of which have pushed up oil prices, which is a supply issue not a demand issue, which interest rates are better for.
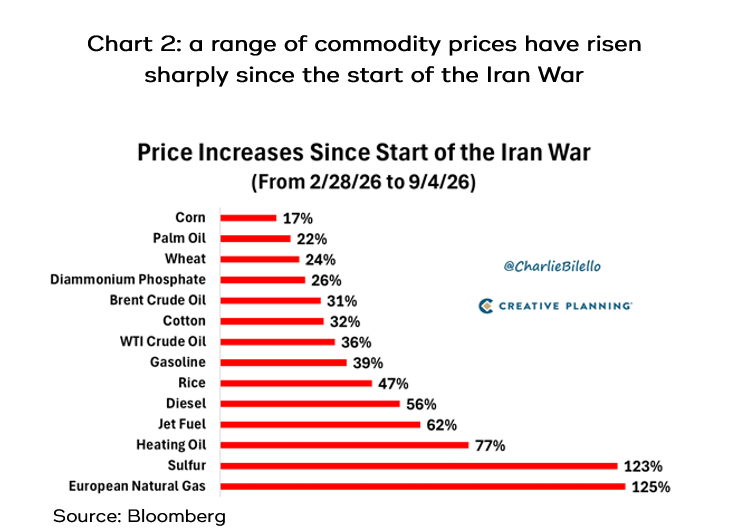
Oil feeds through to almost every layer of the economy, and we’re seeing that from the broad range of commodity prices that have gone up significantly since the start of the Iran war – see chart 2.
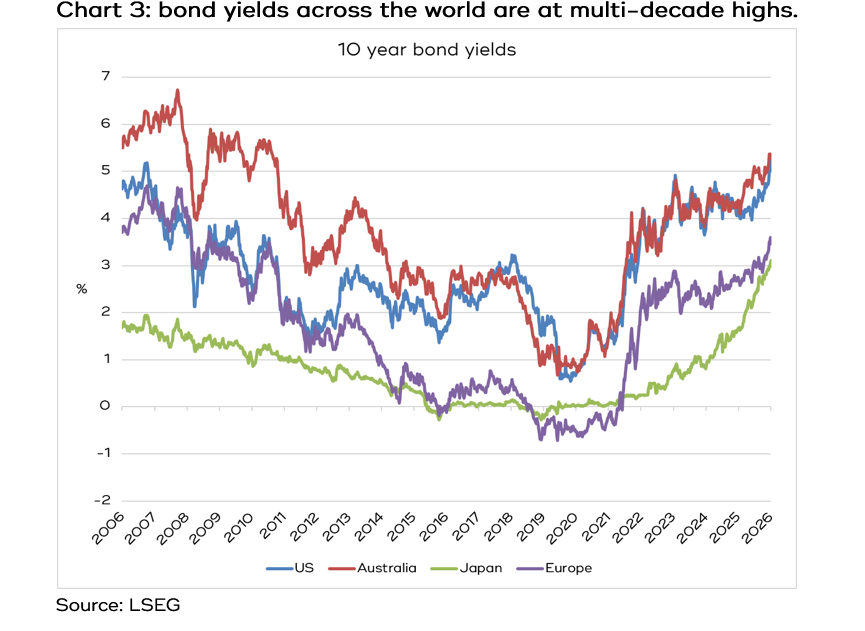
Inflation is like kryptonite for bonds, and yields climbing to multi-decade highs reflect the markets’ concerns that there appears to be little prospect for a quick resolution to either war – see chart 3.
Just like a share, when someone’s traded a bond and its yield goes up, it’s because its price has gone down. So the recent spike in yields has added to years of pain for bond investors, who have been losing money since COVID. In fact, the rolling 10-year return for US bonds is the worst it’s been in 100 years, which is a troubling outcome if you’ve been relying on bonds as the defensive part of your portfolio.
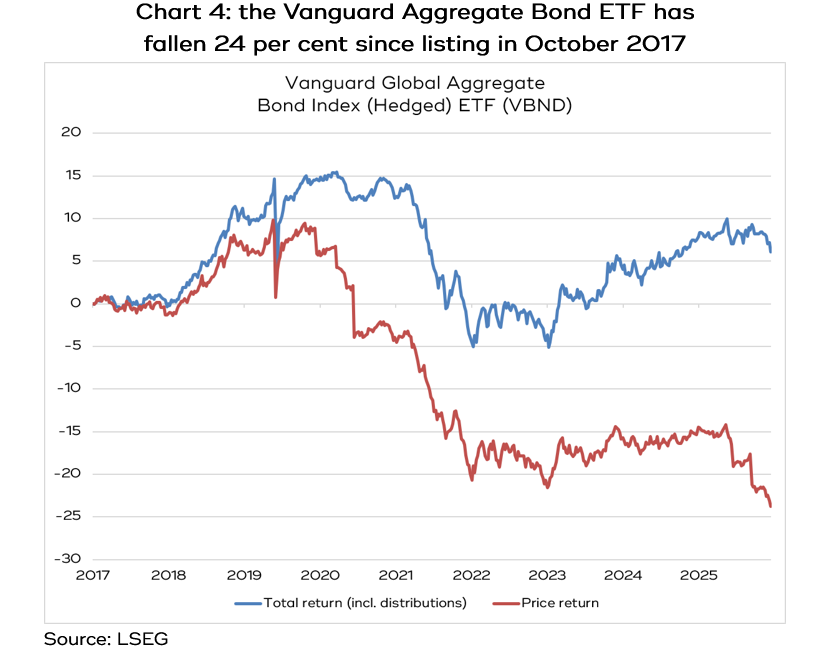
This is well illustrated by the price movements of the Vanguard Global Aggregate Bond ETF (VBND), which trades on the ASX. The price of the ETF has fallen almost 24 per cent since it was listed in October 2017, and even if you include the coupons (distributions), the total return over nine years has been 6.1%, which works out to a paltry annualised compound return of 0.66 per cent – see chart 4.
The latest reports are that Middle East Gulf crude exports, excluding Iran, recovered to pre-war levels of at least 16.5m barrels a day in September. It’s possible the US mid-term elections will also increase pressure on the Trump administration and make them more inclined to negotiate an end to the war.
At some point bonds are going to be a terrific buy. Already you’re being compensated with a yield of around 5% to hold a bond (which is a whole lot better than pre-COVID when bond yields were close to zero), but, right now, the Investment Committee is mindful of the ongoing inflationary risks. This is an area we are watching closely.
private credit
Our strategy since 2017 has been to invest in private credit in the fixed income portion of portfolios. Unlike government bonds, private credit has been offering attractive yields and, overall, steady unit prices, so they’ve done exactly what fixed income is supposed to do in a portfolio: provide some yield and an uncorrelated return to growth assets (like shares).
The outcome was terrific. On average the private credit funds we’ve invested with have returned in excess of 9% p.a. since that time, a far better result than what investors got from government bonds.
Lately, however, private credit has been copping some very negative headlines. Last year ASIC undertook a review of governance among private credit managers and made a list of recommendations to improve transparency and consistency.
Then recently a large residential building group in New South Wales, Bathla, went into voluntary administration, casting doubt over the viability of many loans made by a suite of different private credit managers. While no doubt a testing time for those managers, we understand there is a strong likelihood they will receive all their money back, as will investors. This is the advantage of holding first ranked mortgages over the land and projects.
share markets are entering a seasonal sweet spot
Rising bond yields and RBA interest rates proved a strong headwind for the ASX over September, with the index falling 2.4% over the month and rising only 1.3% over the quarter. Yarra Capital has calculated that 47 per cent of the ASX 200 is yield sensitive, whereas it’s only 16 per cent for the S&P 500.
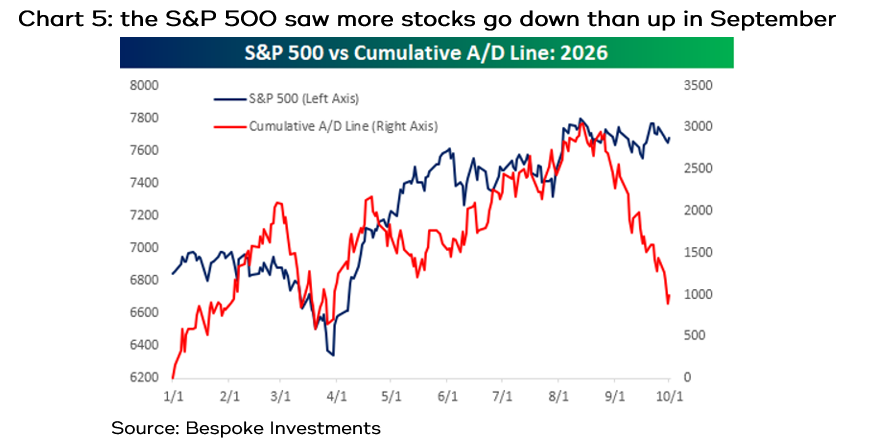
In the US, while the S&P 500 rose over September, and remains within sight of its all-time highs, the underlying picture is more complex. In the June quarter we were celebrating the impressive breadth of the market, meaning there was a broad range of shares going up and contributing to the positive performance. Now, more than 80% of stocks in the S&P 500 sit at least 10% below their peaks, while 59% are down more than 20% - see chart 5, meaning the index is back to relying on a handful of giant tech stocks.
However, we are about to hit what has historically been the best three-month period for shares in those years where the US has mid-term elections, like they do this year, and indeed the best nine-month period for the entire US four year presidential cycle – see chart 6.
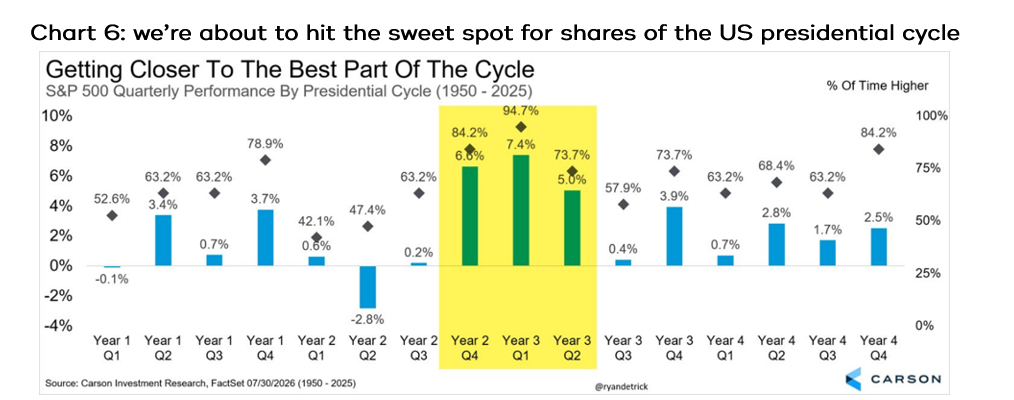
There’s quite a bit going on in this chart, so to explain: since 1950 (so 19 presidential cycles) the fourth quarter of the second year (in the yellow box) has returned an average of 6.6% (the blue bar and the left axis) and has risen 84.2% of the time (the black diamond).
Since 1934, if you bought the S&P 500 at the low point of the second year of the cycle, the average rally has been 47%! And the market has risen every single time and has gone on to establish a new all-time high 80% of times.
It’s also worth noting the first and second quarters of the second year of the presidential cycle have historically been the worst. To remind you, the March quarter was terrible in the wake of the Iran war kicking off, with the S&P 500 declining by 4.3%, but then the June quarter saw a massive rebound of 14.9%.
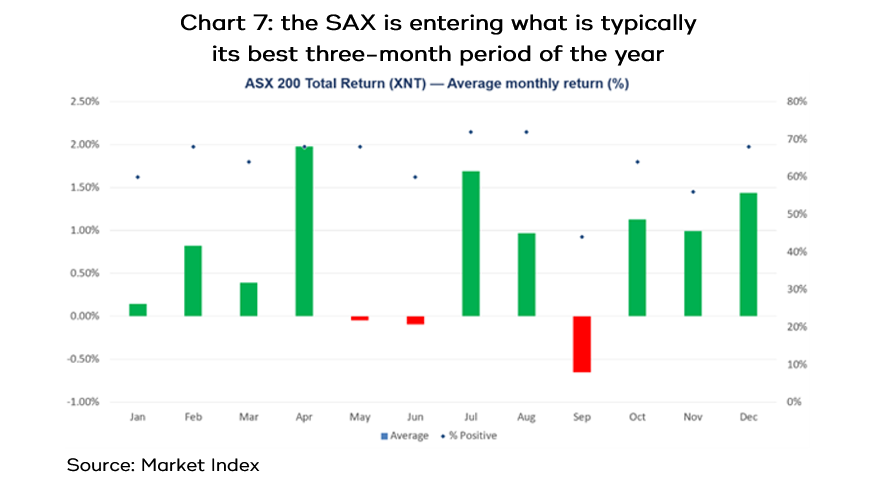
The ASX is also approaching what is typically its best three-month period of the year- see chart 7.
Obviously, there could be a first time for everything, so there are no guarantees, but let’s look at why the set up for the US is looking alright.
it's all about earnings growth
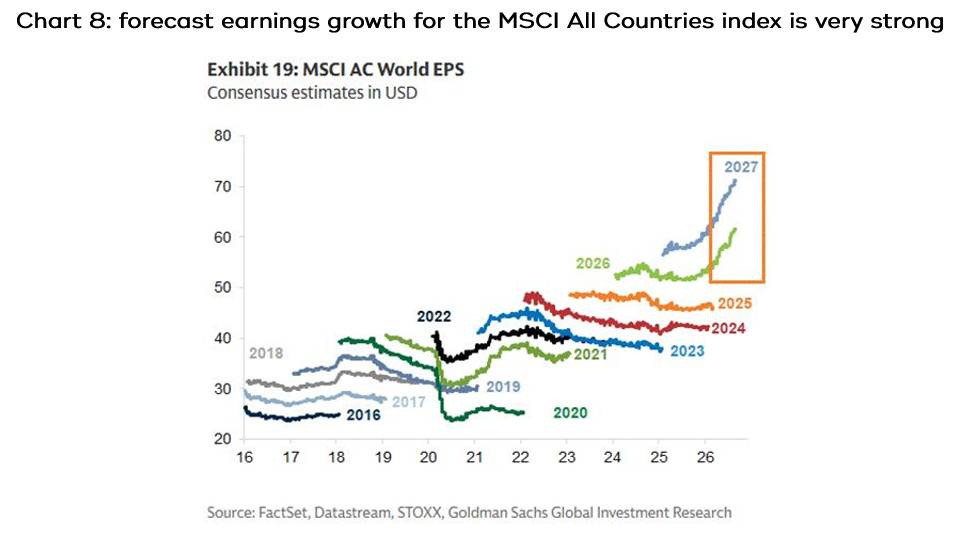
As we’ve written countless times, over the long run, share prices follow earnings growth, in fact, the long-term correlation is about 94%.
Chart 8 shows that forecast earnings growth for the MSCI All Countries Index, which includes developed and emerging markets, has risen sharply for 2026 and even more sharply for 2027.
We’ve written extensively about the colossal amounts of money being spent by the tech giants on AI capex, which is underwriting those strong earnings forecasts. The Australian-based global fund manager, Loftus Peak, recently wrote:
The investments these companies are making to effectively distribute AI services to users, both in enterprise and consumer markets, are scheduled to top US$4.6 trillion cumulatively from 2025 to 2030 for the participating hyperscalers Google, Amazon and Microsoft, according to Bloomberg estimates (including adjusting for Microsoft’s treatment of this capex as a finance lease).
To put these numbers into perspective, they are larger than the annual GDP of each country in the world with the exception of the US, China and Germany.
But these numbers should be seen in the context of cashflows of these same hyperscalers which is forecast to be US$5.3 trillion over the period, according to Bloomberg estimates.
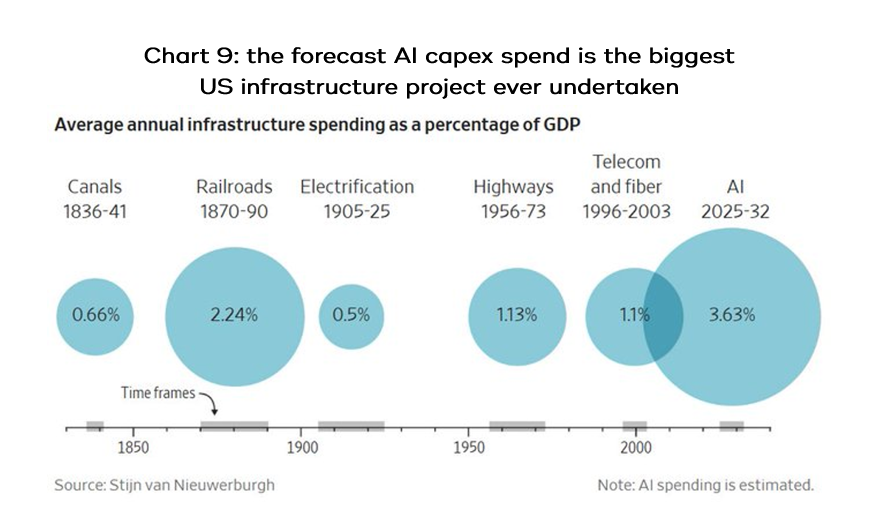
For some more perspective, chart 9 shows how big the AI capex spend is projected to be compared to other periods of high infrastructure spending in the US. In just seven years, it’s estimated there will be 50% more money spent as a proportion of GDP than what was spent over a 20-year period on railroads.
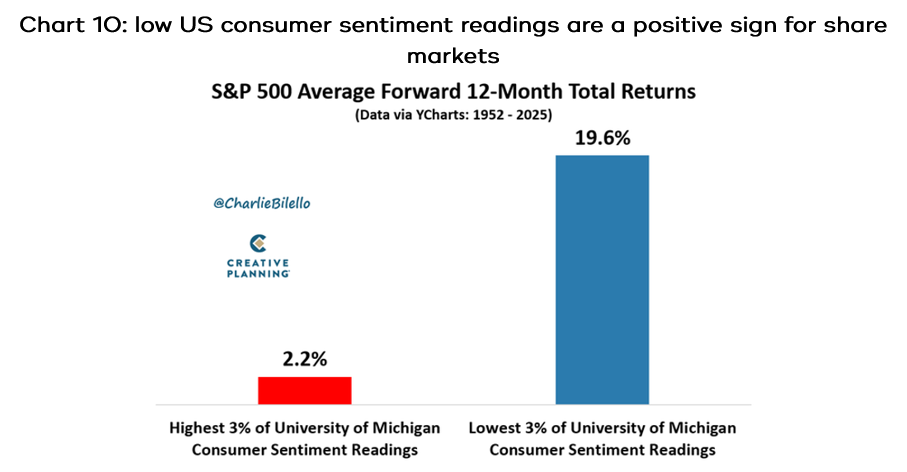
Conspicuously, US consumer sentiment is trudging along at close to all-time lows, perhaps not surprising in the middle of a cost of living crisis. However, perhaps counterintuitively, that’s a positive sign for share market returns. Over the past 75 years, the average 12-month return on the S&P 500 when University of Michigan sentiment reading hit their lowest 3% was 19.6%, compared to only a 2.2% rise following readings in the highest 3% - see chart 10.
As things stand, there are no clear signs of share market euphoria that would cause us to be concerned. By contrast, forecast earnings growth across global share markets remains strong, so we are inclined to maintain full weighting to growth assets. Unfortunately, Australia’s forecast earnings growth is still not as good as elsewhere, so we remain underweight local shares.