ere are gold bugs who would have you believe you are out of your mind if you don’t have a portion of your portfolio invested in gold at all times. I’m not one of them. But I do believe every investable asset has its day and there are good arguments to take out some portfolio insurance at the moment.
My long-term view of gold is more in the Buffet camp: it’s very pretty to look at but, like all commodities, it doesn’t pay you a dividend or yield. That leaves two obvious reasons to buy it: for a capital return or as a hedge or insurance policy.
Buying gold for a capital return
You would only buy gold for a capital return if you believe (a) it’s cheap and (b) the price is going to go up.
Is gold cheap?
This is a difficult question to answer because, like any commodity, it’s really hard to pin a valuation on gold. It doesn’t pay any dividend or interest so you can’t value it based on the present value of future cash flows. While gold has some limited industrial applications most of the demand comes from investment and jewelry, both of which are hard to forecast because sentiment plays a large part. And in terms of supply, theoretically, every ounce of gold that’s ever been plucked from the earth is still out there and there’s more being produced every year.
Many have tried to come up with models for valuing gold but at the end of the day they’re all based on comparing the current price to where it’s traded against different metrics in the past. To make those comparisons you can use what’s called fundamental analysis, which is measuring one metric against another, or technical analysis, which is using charts to gain an indication of where prices are going. Indeed, there are many good analysts who will only use a combination of the two.
Fundamental indicators
1. Gold vs. other forms of money
Gold is an internationally recognised store of value, that is, a kind of money. So it makes sense that you can analyze gold’s relationship to ‘fiat currencies’, which is the money issued by countries that they declare to be legal tender even though it’s not actually backed by anything tangible, just a promise that it will be honored.
Since 2001, the G-20’s monetary base has grown by 13% per annum, whereas the above ground supply of gold has only grown at 1.6% per annum – see chart 1.
Chart 1: Growth in the G-20 Monetary base (M0) dwarfs the growth in above ground gold supply
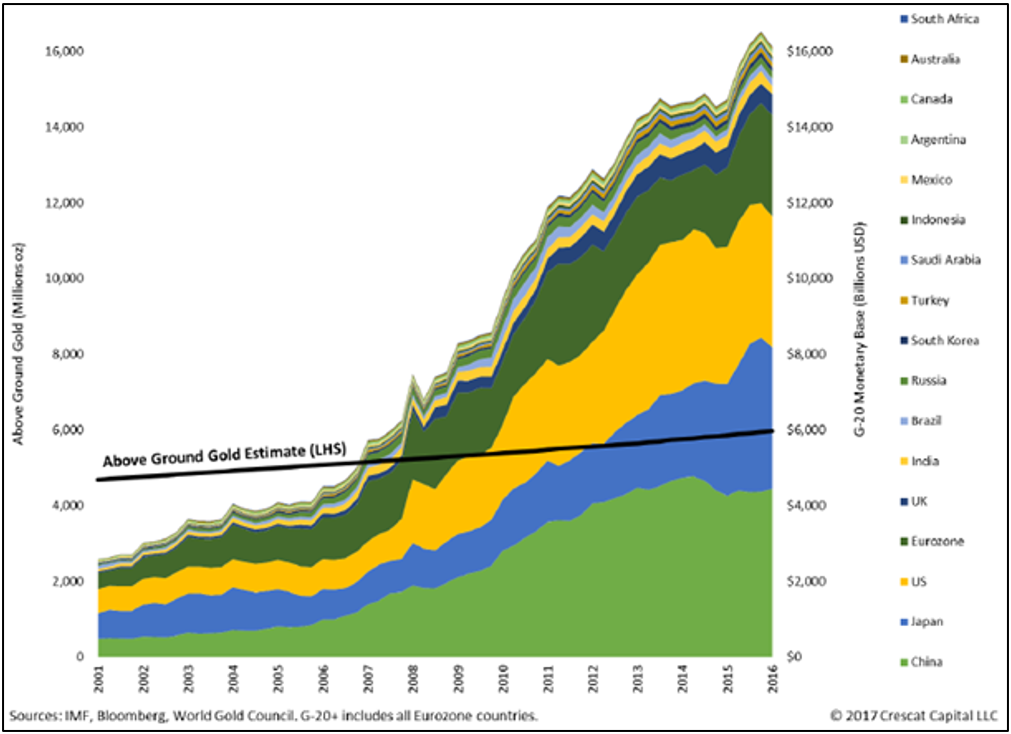
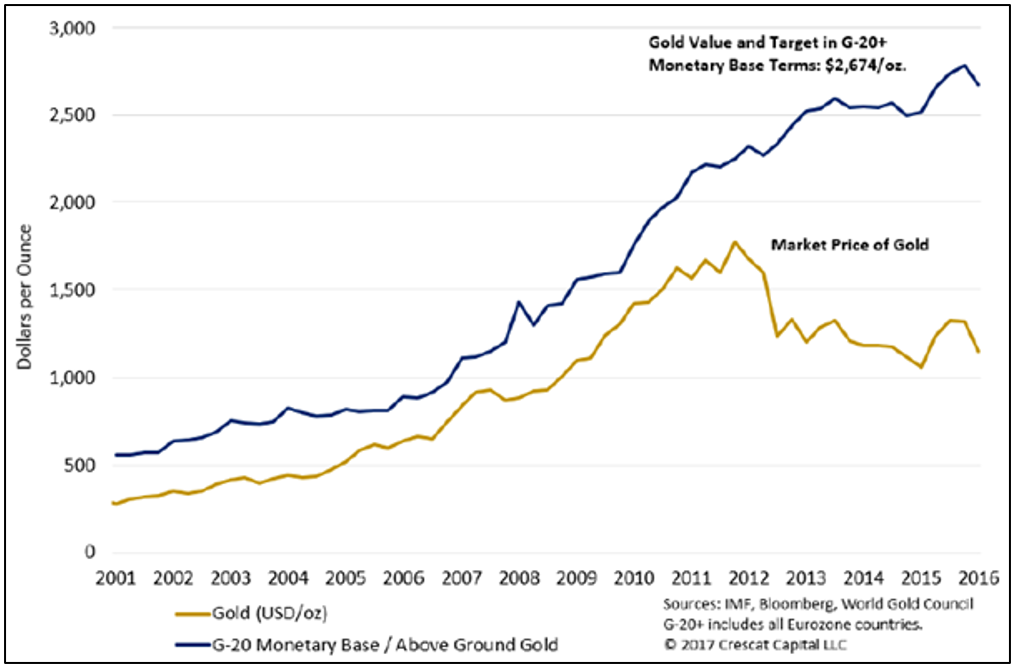
If the supply of paper money has grown eight times faster than the supply of gold, surely the price of gold denominated in that paper money should reflect that. Chart 2 shows this relationship has broken down and in fact gold is at historically undervalued levels relative to the monetary base.
Chart 2: Gold is historically undervalued relative to the G-20 monetary base (M0)
2. Gold vs. stocks
Another measure is comparing the value of shares to gold; since they are both real assets, it’s reasonable to argue that over time there should be an observable relationship in their relative value. The black line in chart 3 below (by Jesse Felder) simply divides the gold price by the S&P500 and is currently indicating that gold is cheap relative to stocks. (The gold line overlays a repeat of what happened between 2001-11 as a possible future path – with all respect to Mr Felder, you can ignore that line).
Chart 3: The gold price divided by the S&P500 indicates gold is currently good value on a relative basis
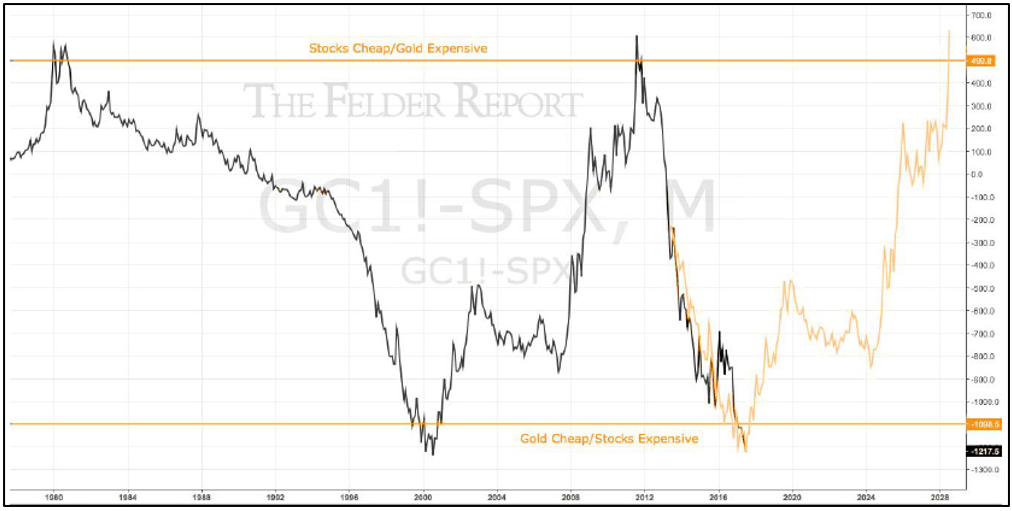
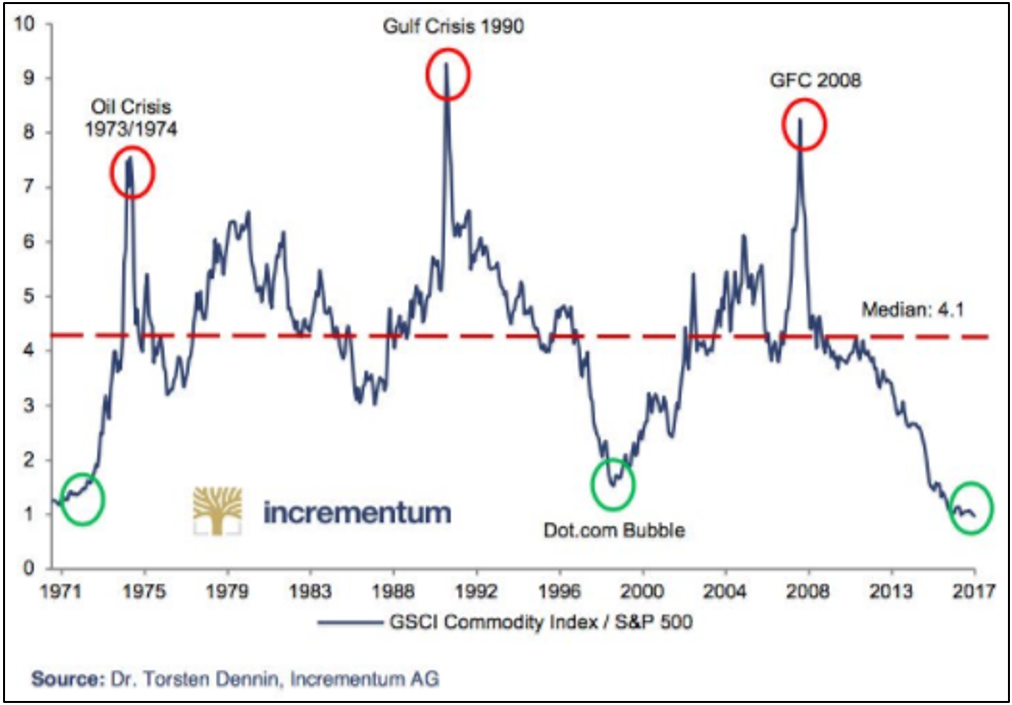
Chart 4 is a similar comparison, only this time looking at the value of commodities in general as represented by the Goldman Sachs Commodities Index compared with stocks, and once again, it indicates commodities are relatively cheap (it’s worth noting gold is the second most traded commodity behind oil). What’s also interesting is that peaks in the chart usually coincide with some kind of crisis.
Chart 4: The Goldman Sachs Commodities Index to S&P500 ratio also suggests commodities are cheap relative to stocks
3. Gold vs. stocks and bonds
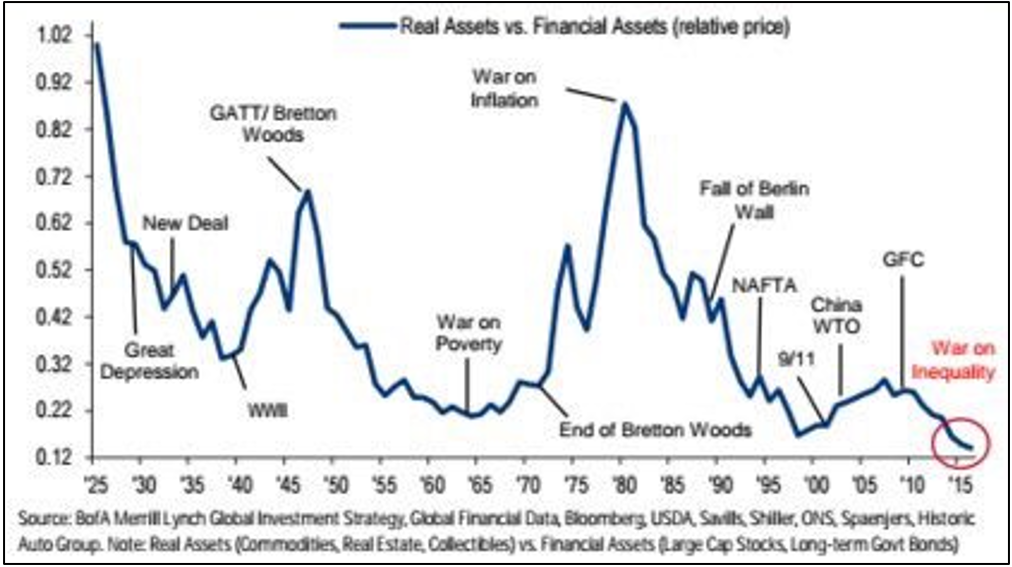
Chart 5 compares the relative value of financial assets, as represented by US stocks and bonds, to real assets, in this case commodities, real estate and collectibles. What makes this analysis more interesting is the time frame: real assets are the cheapest they’ve been relative to financial assets stretching back more than 90 years.
Chart 5: Real asset values are at all-time lows compared with financial assets
Technical indicators
1. Downtrend broken
Gold recently broke through a downtrend that has been in place since it hit an all-time high of $1,922 an ounce in September 2011, as shown in chart 6.
Chart 6: Gold has broken its downtrend
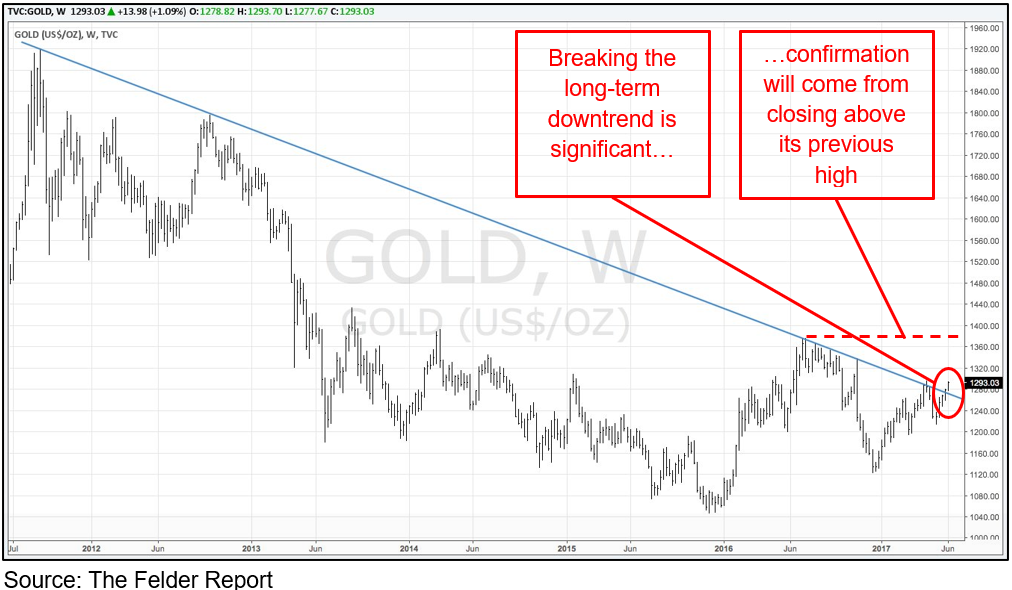
For technical analysts this is a really big deal. Per stockcharts.com: “A break above the downtrend line indicates net supply is decreasing and a change of trend could be imminent.” An uptrend will be confirmed once gold trades above its previous high of $1,377 an ounce from last year – it’s currently at $1,315.
2. Resume long-term uptrend?
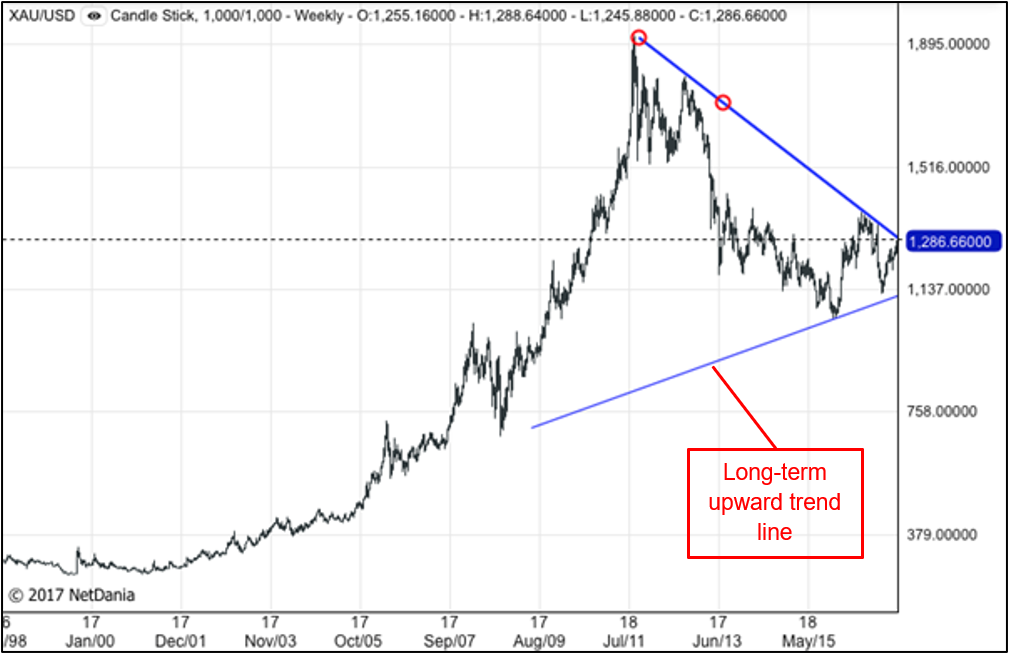
Finally, Ross Norman of Sharps Pixley bullion broking in London points out the gold price is arguably returning to a long-term trend line that had been established prior to the ‘melt up’ caused by the GFC – see chart 7.
Chart 7: gold may be returning to its long-term upward price trend
Will the gold price go up?
Of course nobody, but nobody, can give you a definitive answer to this question, but we can once again look at some indicators and evidence.
Demand
Annual total global gold demand is about 4,000 tonnes. About 70% of that is for jewelry, but the biggest swing factor is investment demand, which has been growing at 18% per annum since 2000.
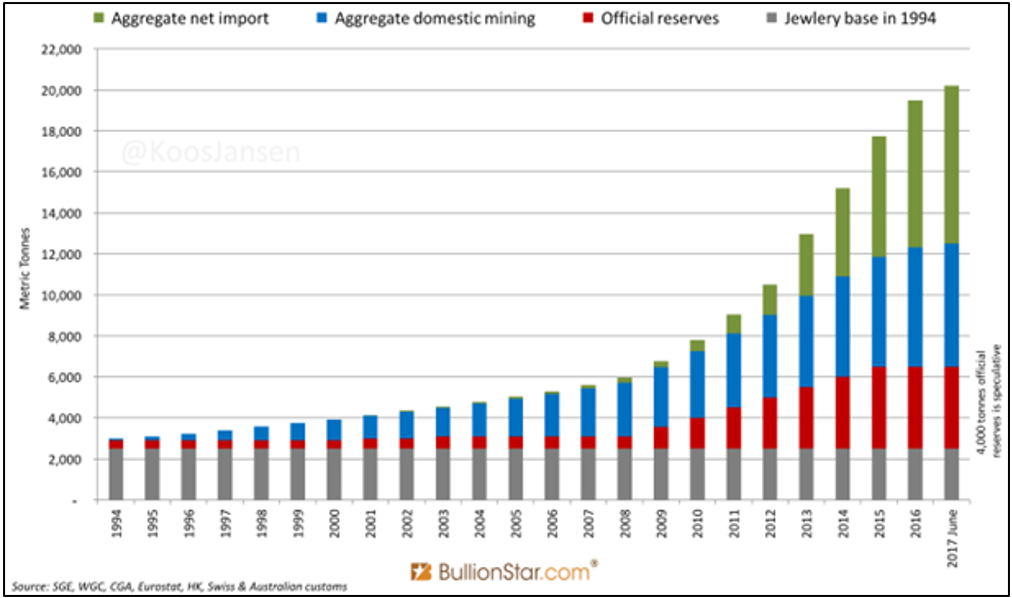
As with so many things, China has had a huge influence on gold with demand growing at 14% per annum demand over the past 10 years – as shown in chart 8. It is estimated total Chinese gold holdings are just over 20,000 tonnes, of which 80% is in private hands.
Chart 8: Estimated total Chinese gold reserves
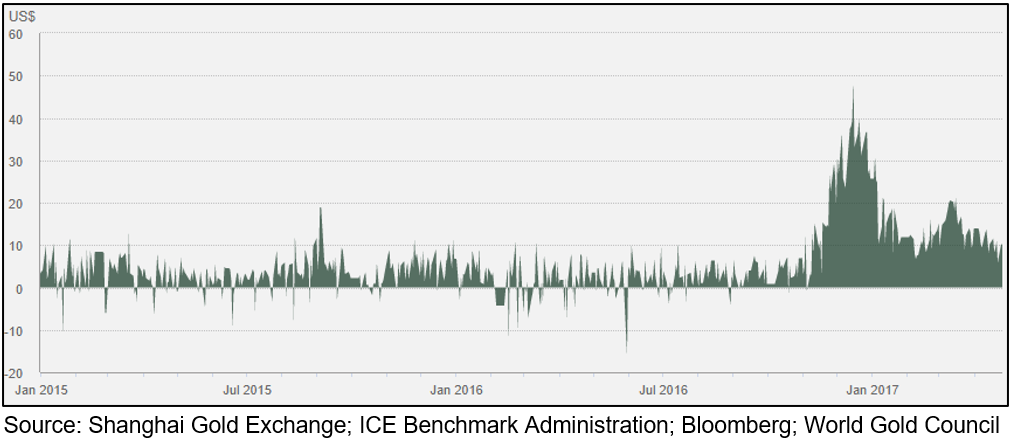
Interestingly, it appears Chinese demand shot up 56% over the year to July, with speculation that more investors are buying gold as a way of reducing their exposure to the Renminbi, which makes sense given the risks with the level of Chinese debt. That surge in demand has seen the premium Chinese investors are willing to pay over the market price for gold rise strongly late last year – see chart 9.
Chart 9: The premium over market prices Chinese investors are willing to pay to buy gold has risen sharply
Supply
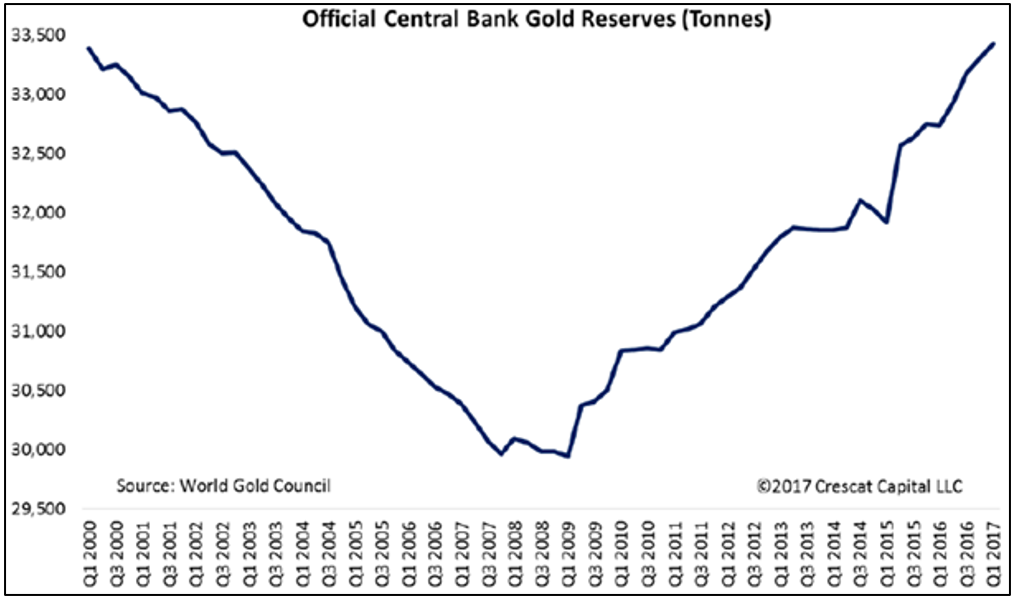
The supply of gold is also tricky, since theoretically every ounce that’s ever been produced is still out there. While mine supply is fairly consistent at 2,500-3,000 tonnes per annum, the big swing factor is central banks, which have combined estimated holdings of more than 33,000 tonnes. So if the banks decide to sell the price would fall significantly, but since the GFC central banks have actually been strong net buyers of gold – see chart 10. In fact, emerging market central banks’ gold holdings have tripled in the last 10 years.
Chart 10: Central banks have been net buyers of gold since the GFC
Holding gold as a hedge
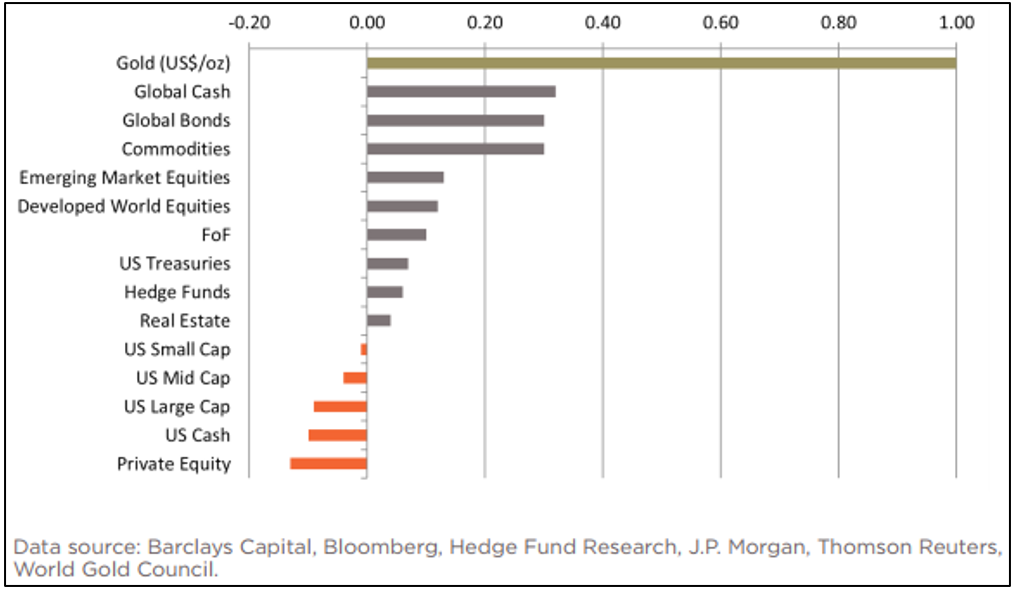
Another reason to buy gold is as a form of insurance for a portfolio. In the past gold has had a low correlation to financial assets, which means it tends to zig when shares and property zag. Chart 11 shows gold’s correlation to a bunch of asset classes ranges from about 0.3 to -0.17 (bearing in mind a correlation of 1 means it moves in perfect unison, and -1 in perfect opposite).
Chart 11: Gold has low correlation to almost all other asset classes
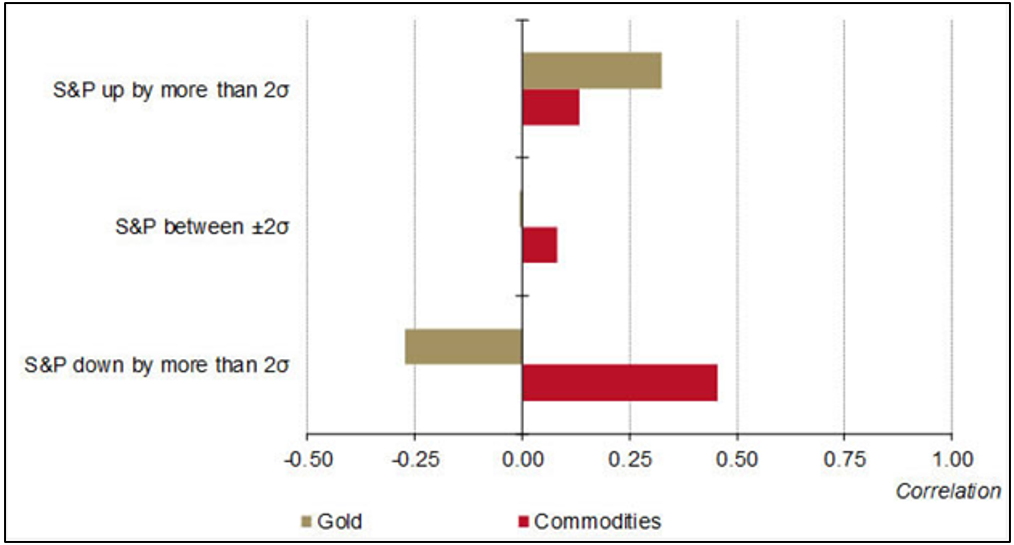
More importantly for investors who have a sizeable proportion of their portfolio exposed to shares, according to research done by the World Gold Council (the official cheerleader for the gold industry), gold is (slightly) positively correlated to a rising US stock market (when shares go up gold goes up but by less), but is negatively correlated to a falling stock market (when shares go down gold goes up) – see chart 12. Interestingly, other commodities usually fall when stocks fall, which supports the view that investors tend to buy gold as a safe haven.
Chart 12: Correlation of US stocks versus gold and commodities
Is there a need to hedge at the moment?
There are always people claiming the stock market is about to fall and vice versa. It’s the nature of financial markets that two people can look at the same thing and have completely different views. I am not saying I think markets are about to crash – I have absolutely no idea. What I am saying though, is there are reasonable arguments to suggest that taking out some protection might well be prudent if your portfolio can accommodate it.
The greatest concern for global share markets is the US, which has enjoyed a phenomenal rise since 2009, having gone up some 280% over 101 months, making it the second longest bull market in history (for context, the longest was a rise of 484% over 113 months between 1990-2000). Of itself, how much a market has risen and over how long has no bearing at all on whether or when it will fall. It rests entirely on questions of valuation and risks.
Positives
- Very low (real) interest rates, which make shares look attractive.
- We’ve never been in circumstances quite like this, so arguably we don’t really know what the ‘right’ valuations are. And while there is a disturbing buildup of corporate debt in China, elsewhere it is not as bad.
- Earnings growth is reasonable.
- Economic growth, while low compared with the 1990s, is still positive and Europe particularly is showing signs of recovery.
Negatives
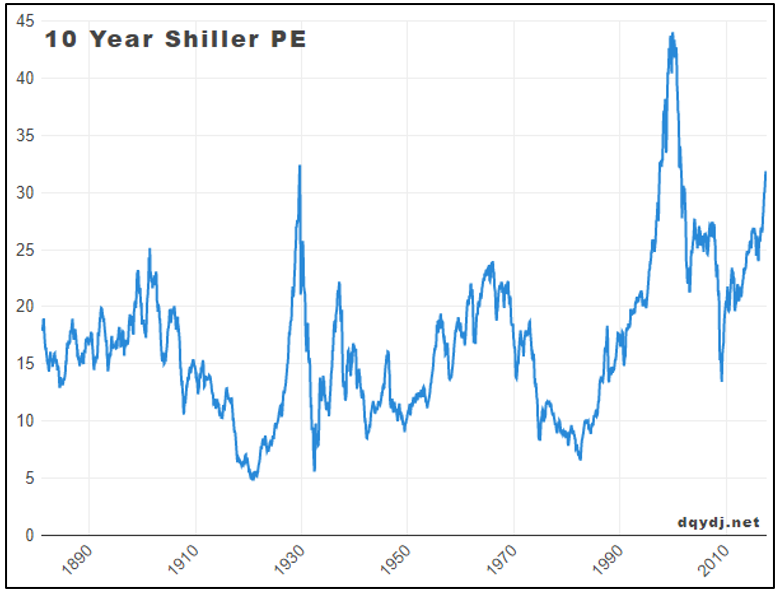
- The S&P500 ‘CAPE Shiller ratio’, which looks at valuations based on rolling 10 year earnings, is trading at its third highest point ever – see chart 13.
Chart 13: S&P500 CAPE Shiller ratio
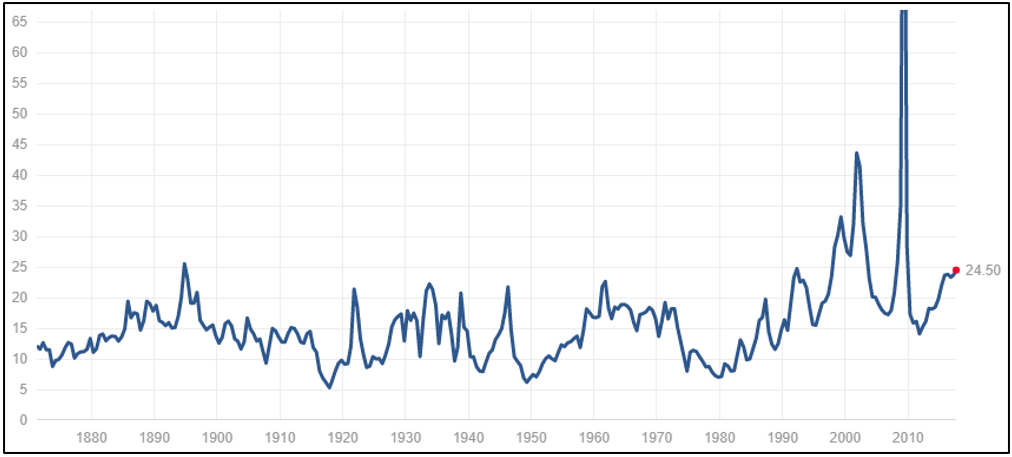
- The current Price to Earnings (PE) ratio for the S&P500 (based on 12 months trailing earnings) is also historically high at 24.4 times the last year’s earnings (versus the 100 year average of 15.7) – see chart 14.
Chart 14: S&P500 current PE ratio
- In the five years to July 2017 US ‘adjusted’ earnings rose 12% yet the market has increased by 80%; the differential is due to the rising PE ratio, which is essentially a measure of sentiment (the counter argument to this is as above: what is the right PE when real interest rates are almost zero?).
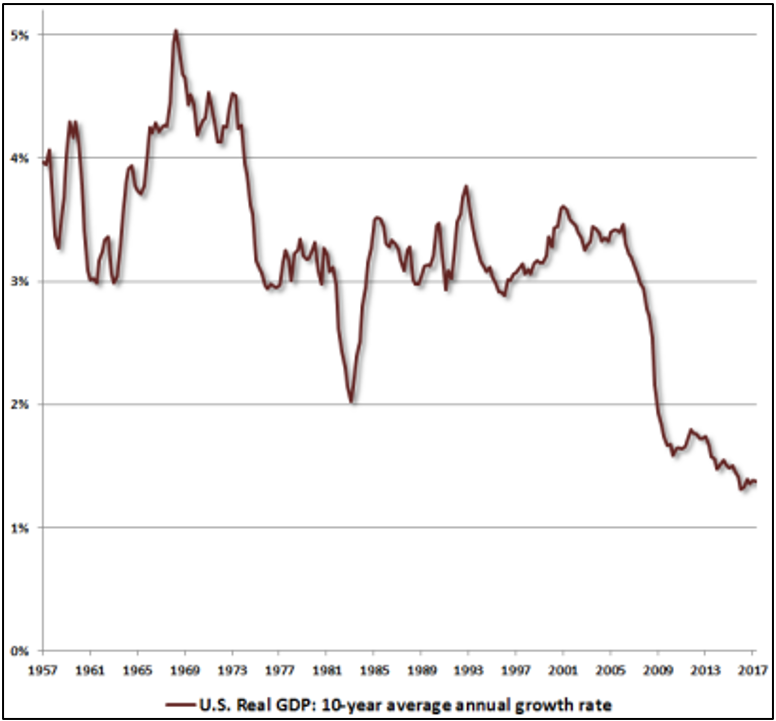
- Long-term US real GDP growth is close to 60 year lows – see chart 15.
Chart 15: US 10 year average real GDP growth is at 60 year lows
- The total US stock market capitalization as a percentage of GDP, Warren Buffett’s favorite yardstick, recently hit an all-time high of 145.5, compared with an average of 60 between 1970-95 and 100 between 1995-2017 – see chart 16.
Chart 16: US stock market capitalization to GDP

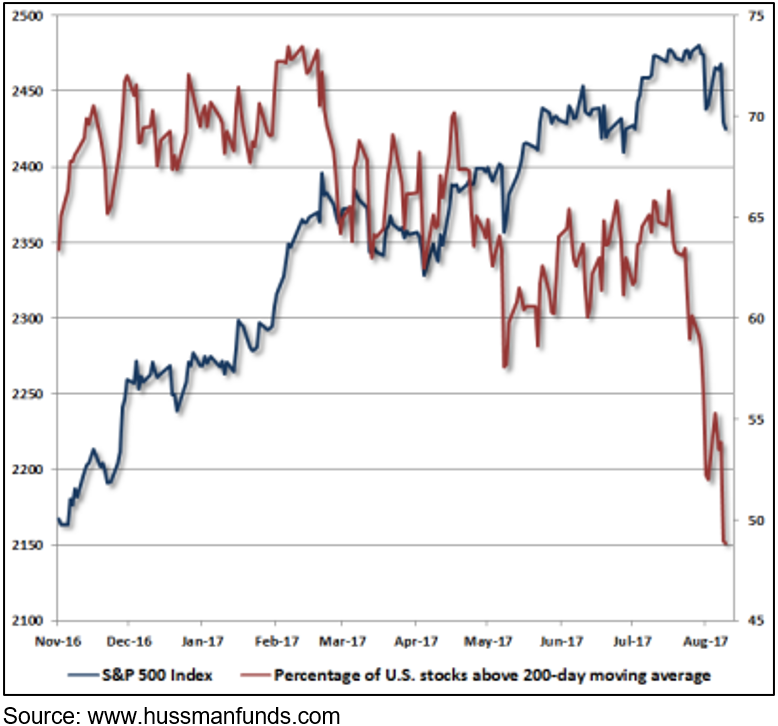
- Chart 17 shows the ‘breadth’ of the market’s rally is narrowing: in other words, there are fewer and fewer stocks still trading at elevated levels to hold the market up. This is a popular technical indicator for the stock market.
Chart 17: percentage of stocks trading above their 200 day moving average and S&P500
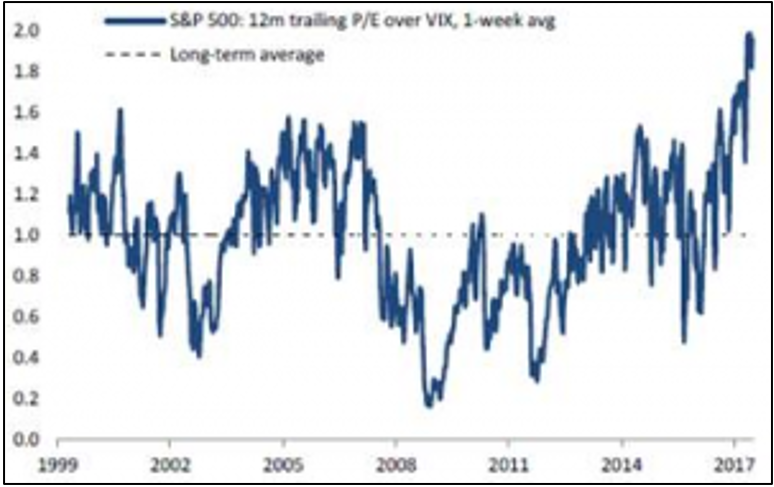
- Volatility in the US, as measured by the ‘VIX’, is at an all-time low, while the PE is high, meaning the so-called ‘complacency index’ is as high as it’s ever been – see chart 18.
Chart 18: the US ‘complacency index’ is as high as it’s ever been
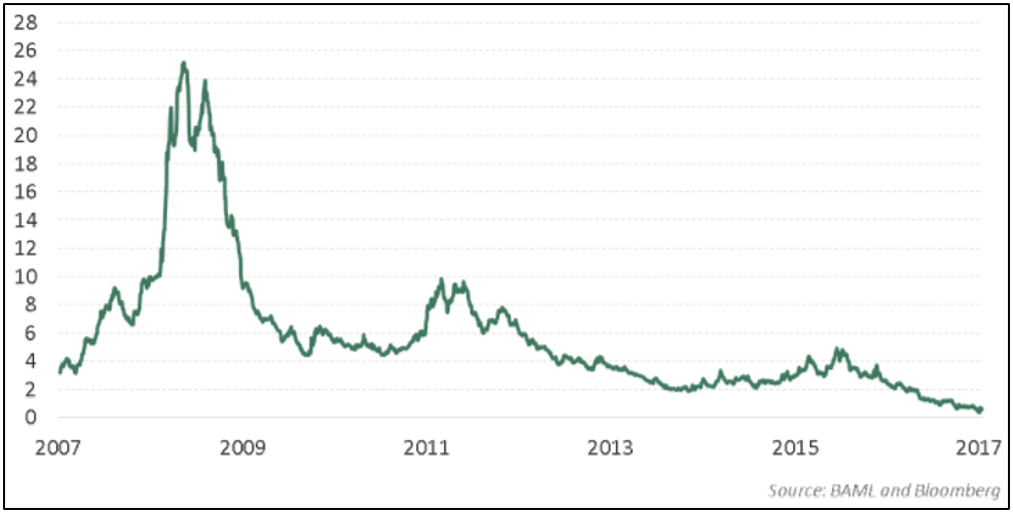
- Credit markets are showing a disregard for risk as well: the difference in return between European High Yield bonds (the higher the yield the riskier the bond) and US government bonds is all but zero (that makes almost no sense) – see chart 19.
Chart 19: the spread between European High Yield bonds and US Treasuries is approaching zero
Can gold deliver a reasonable return?
Yes. Between 1968-1980 the gold price rose at 30% compound per annum! By comparison, the best 10 year period for US stocks was 19.5% from 1918, and for Australian stocks was about 23% from 1989.
Like everything though, timing has a lot to do with it. Since 1980 the returns from the Dow Jones Index were 17 times higher than that of gold, and if you had reinvested dividends it was 79 times! Then since 2000, gold has delivered an annualised return three times higher than US stocks and double London property (thanks to the GFC). But going from the peak of the gold price in 2011 to now, US stocks have returned 15.5% per annum with dividends reinvested and Australian stocks 10.7% while gold lost 6.1% per annum.
So, yes gold can deliver strong returns, but timing is important and trying to pick timing on any investment is notoriously difficult. The best you can do is weigh the evidence.
Conclusion
There are arguments to suggest that gold is relatively cheap compared with financial assets, that there are reasonable prospects for demand for gold to hold up, and that portfolios may benefit from taking out a bit of insurance, be it gold or something else. The key to remember is it’s never all or nothing: like any insurance, you never completely sell out of the asset you’re holding.


